KTeV Results on Chiral Perturbation Theory
Contribution to the proceedings of HQL06,
Munich, October 16th-20th 2006
Elliott Cheu
Department of Physics
1118 E 4th Street
Tucson, AZ 85749 USA
1 Introduction
The decays , and can all be used as tests of chiral perturbation theory. In particular, predictions for the branching ratios of these modes show significant increases when one uses versus chiral perturbation theory. The first measurements of [1, 2] were a factor of three higher than the prediction, but were consistent with the calculation.[3] This was also seen in the decay decay where the prediction was inconsistent with the measurement, but consistent with the calculation.[4] For the decay, the branching ratio vanishes at chiral perturbation theory, yet is non-zero at higher order. Recent predictions for this decay range from . [5, 6]
In addition, the two decays and are important for understanding the direct CP violating decay . Three components contribute to the amplitude: direct CP violation, indirect CP violation (and an interference term), and a CP conserving term. Recent measurements of the decay [7] and [8] have helped to determine the indirect CP violating contributions to and . The magnitude of the CP conserving contributions to can be determined by measurements of the decay [9, 10] and . The CP conserving term is estimated to be small[11].
2 The KTeV Experiment
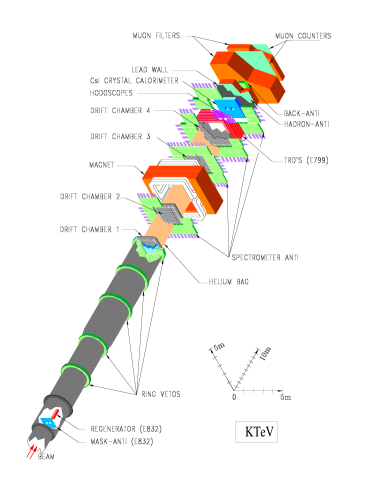
The KTeV experiment, shown in Figure 1, is a Fermilab fixed target experiment. The detector ran in two different configurations: E799 and E832. The E799 configuration took advantage of a higher kaon flux to search for rare kaon decays. The E832 configuration was used primarily for a measurement of . The main difference between the two configurations was the use of a regenerator to produce decays in the E832 configuration. The two experimental configurations also had a few other differences as noted below.
The KTeV detector contains a charged spectrometer with four drift chambers, two on either side of a large dipole magnet. At the downstream end of the detector is a two-meter square calorimeter consisting of 3100 pure CsI blocks. Following the calorimeter are 10 cm of lead and 5 meters of steel which act as a muon filter. Two planes of scintillator, used for muon detection, are located just downstream of the steel. Photon vetoes to detect the the presence of particles that would otherwise escape detection surround the spectrometer. The charged spectrometer achieves a hit resolution of better than 100 m, while the CsI calorimeter obtains better than 1% energy resolution over the range of energies of interest. Just upstream of the CsI calorimeter is a transition radiation detector (TRD) capable of separation of 200:1 with a 90% efficiency. The TRDs were employed during E799 running, and were moved out of the way during E832 running.
The KTeV experiment took data during a number of different periods between 1996 and 1999. In the E832 configuration, we had three different running periods: 1996, 1997 and 1999. The E799 running occurred in 1997 and 1999. Between the 1997 and 1999 runs, a number of upgrades were made to the detector to increase its reliability and to improve its live time. In addition during E799 running, the transverse kick from the magnet was reduced from 205 MeV/ to 150 MeV/, enabling a larger acceptance for high multiplicity decay modes. For the entire E799 data set, approximately kaon decays occurred in the KTeV detector. This large kaon flux allows us to have an unprecedented sensitivity to a number of rare kaon decays with large multiplicity final states.
3 Measurement of
In the decay , the final state consists of four photons, two from the and two from the . Our analysis requires four electromagnetic clusters in the CsI calorimeter, with no tracks or extra clusters. One can combine the four clusters in three different combinations. We choose the combination in which the two photon invariant mass reconstructs closest to the known mass.
Backgrounds to this decay originate from two main sources, and . The first background has the same topology as our signal events. However, the relatively small branching ratio for and kinematic cuts reduce this background to a negligible level. In particular, we look at all possible photon combinations of the four photons and reject any event in which the invariant mass for both pairs of photons reconstruct near the mass.
decays constitute the largest source of background to . These events can contribute to the background in three distinct ways. First, two photons from the decay can miss the calorimeter, with the remaining four photons interacting in the CsI calorimeter. Another possibility is that one photon misses the calorimeter while two photons overlap in the calorimeter. Finally, all six photons can hit the calorimeter, with four of the six photons from the decay overlapping in the calorimeter, producing four separate clusters in the calorimeter.
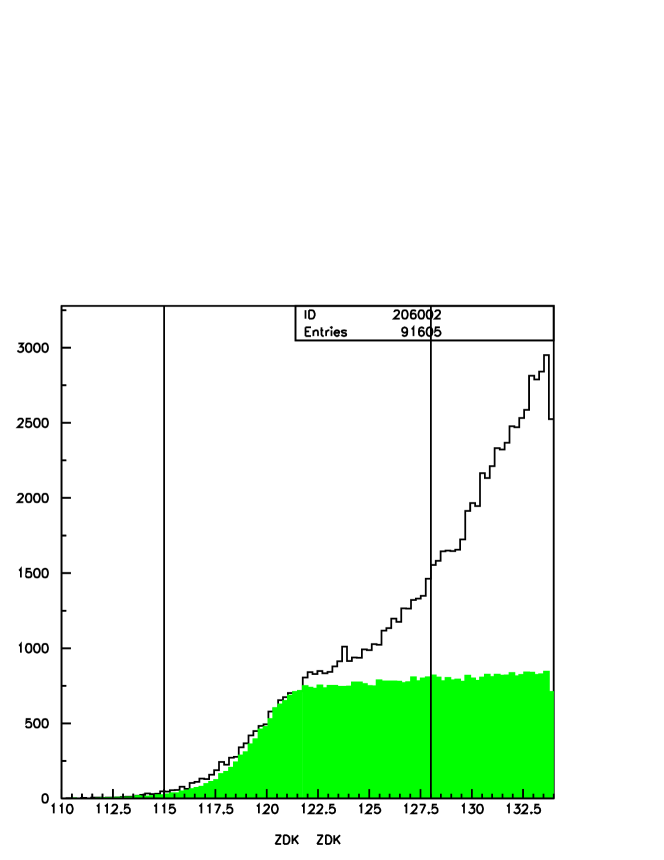
The first source of background can be reduced by first eliminating events with signals in the photon vetoes. In addition, one can improve the signal to background ratio by cutting on the reconstructed position of the event. When the energy in the calorimeter is less than the kaon energy, the event reconstructs downstream of its true decay position. This can be seen in Figure 2 where the signal events are relatively flat, while the background events show a large enhancement at the downstream end of the detector.
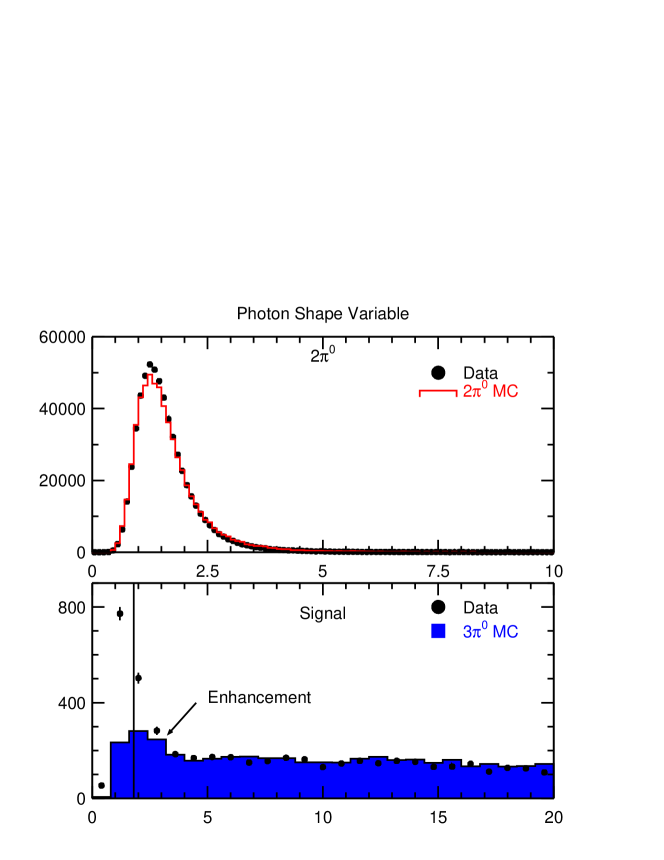
To get rid of events in which photons overlap in the CsI calorimeter, we define a photon shape variable. This variable uses the 3x3 array of CsI crystals containing the core of the shower and compares the energy distribution to an ideal energy distribution determined from Monte Carlo. This shape variable can be seen in Figure 3. The top plot shows the photon shape variable for events for both the data and the Monte Carlo, and shows good agreement between the two. The bottom plot shows the data with the Monte Carlo overlaid. As can be seen, the signal events tend to peak at low values of the shape variable, while the background is relatively flat. We require that the shape variable be less than 1.8, which removes the majority of the events.
Because of the discrepancy between the NA48 and KTeV published results on , we reexamined the data used in our previous result.[10] We found that we underestimated the impact of a disagreement between the data and the Monte Carlo photon shape variable. This led to an underestimate of the background in our final sample. With an improved simulation of the photon shape variable, our background estimate nearly doubles, and the branching ratio decreases.
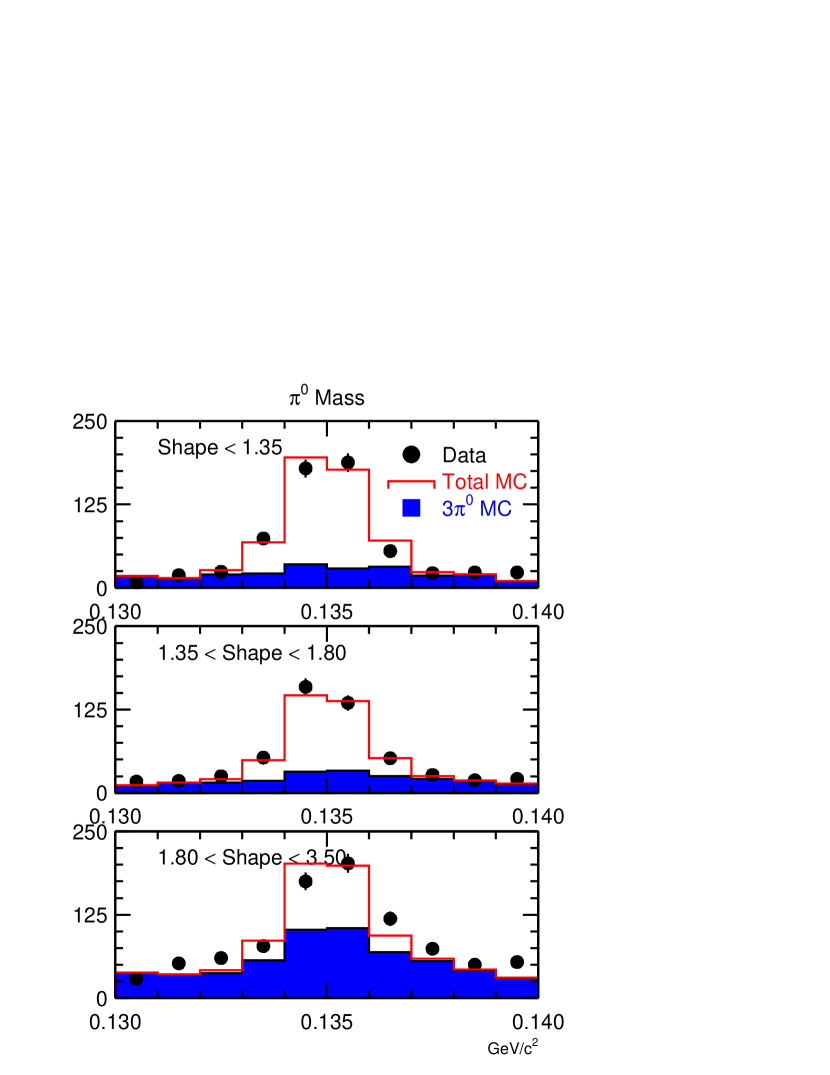
After all cuts, the background is dominated by events, with the total background constituting approximately 30% of the final events. To check that we understand the background level, we examine the data/MC overlays of the distributions. Any underestimate of the background would manifest itself as a data/MC mismatch in the tails of the distributions. As shown in Figure 4, at small values of the photon shape variable, the tails agree quite well in the distributions.
The systematic errors associated with this measurement are shown in Table 1. The main sources of uncertainty stem from understanding the background and its normalization. Other sources of systematic uncertainty come from our knowledge of the photon veto system, the acceptance determination and external factors such as the measured branching ratios. The total systematic uncertainty is 2.9%.
| Source of Uncertainty | Uncertainty (%) | |
|---|---|---|
| dependence | 1.5 | |
| background | 1.3 | |
| MC statistics | 1.0 | |
| Normalization | 0.9 | |
| Photon Shape | 1.1 | |
| Tracking Chambers | 0.9 | |
| branching ratio | 0.9 | |
| Photon vetoes | 0.9 | |
| Kaon Energy | 0.7 | |
| Decay Vertex | 0.4 | |
| Total | 2.9 |
After all cuts have been implemented, we find 1982 events with a background of 601 events. The reconstructed mass is shown in Figure 5. The distinctive shape results from coupling of the system to two virtual pions, and peaks around 320 MeV/. We determine the branching ratio to be: BR() = , where the first error is statistical and the second error systematic. As shown in Figure 5, this result is compatible and competitive with the result from NA48. Our new result supercedes the previous KTeV measurement of BR(), which was in nominal disagreement with the NA48 result.
4 Measurement of
The decay produces two charged tracks in the spectrometer and three photons in the CsI calorimeter. The three photons can be combined in three different ways to form a neutral pion. We choose the combination that has the best mass. The neutral vertex is used to determine the decay position rather than the charged vertex due to its better resolution.
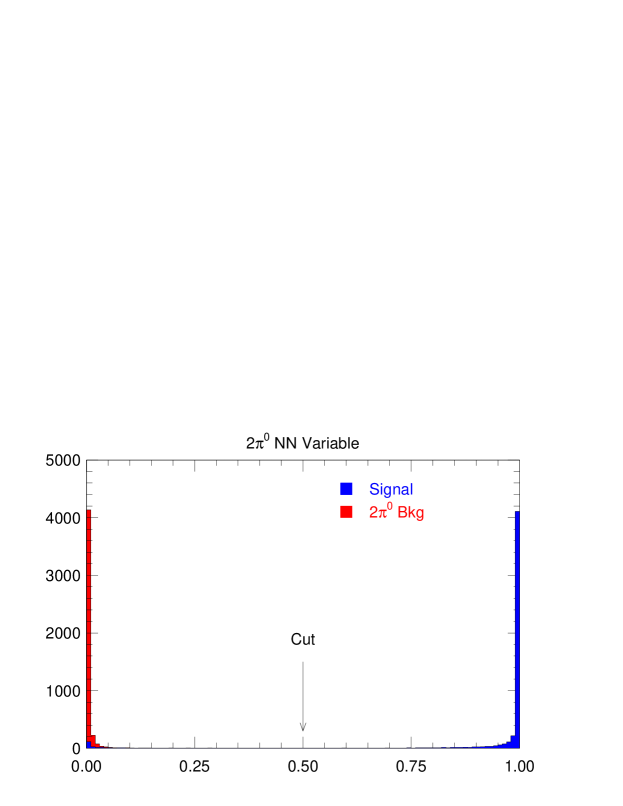
Like the decay, the main backgrounds to this decay are from and . The difference is that one of the undergoes Dalitz decay to . To help reduce the background from decays, we formed a neural net variable using the reconstructed masses and from the second and third best combinations. We define the second and third best combinations by how far from the nominal mass the combination reconstructs. The neural net variable can be seen in Figure 6. In this plot the events are well-separated from the signal events. We require that the neural net variable be greater than 0.5
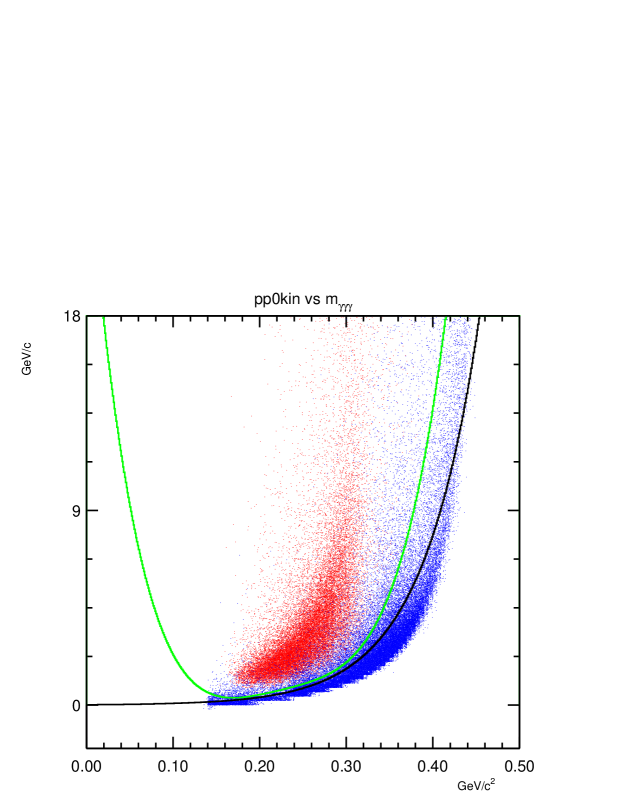
To reduce backgrounds we also require that the photon shape variable, defined above, be small for each photon candidate. We can use the decay kinematics to help reduce the background from decays. We define a variable , which is the longitudinal momentum squared of the missing in the kaon rest frame. We perform a two-dimensional cut on the variable versus the three photon invariant mass, . This distribution is shown in Figure 6. There is good separation between the signal events, shown in blue, and the background. We use a polynomial to define the cut shown in Figure 6.
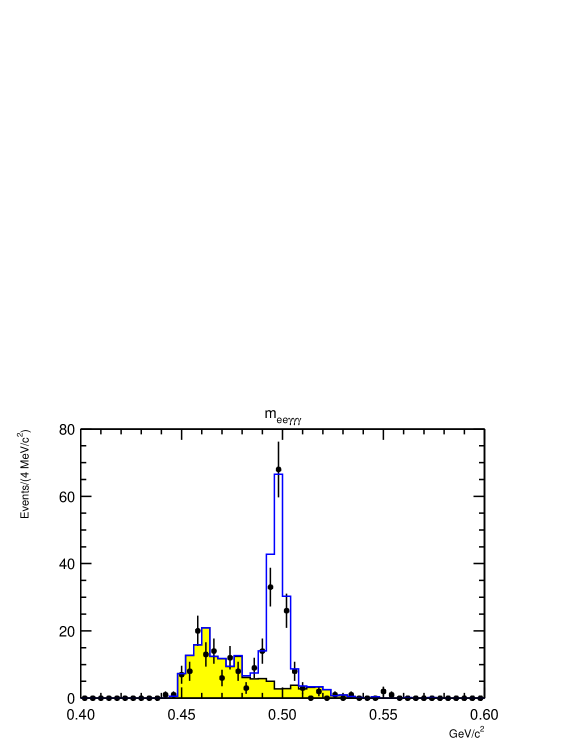
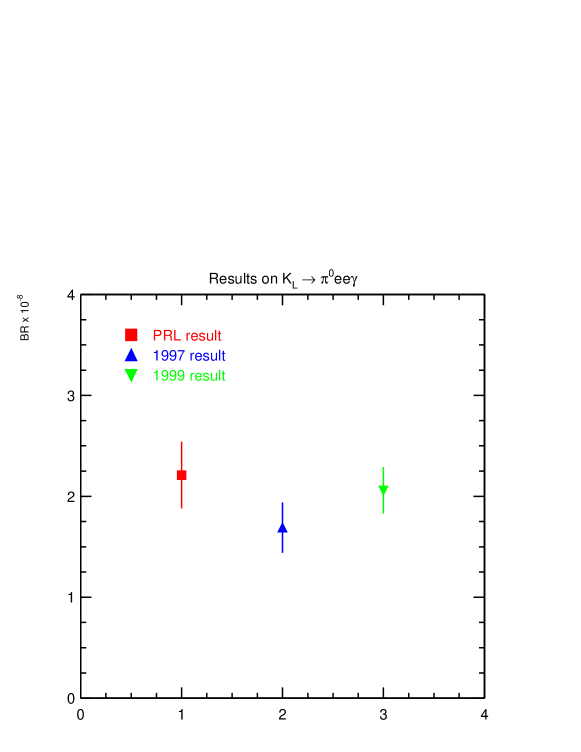
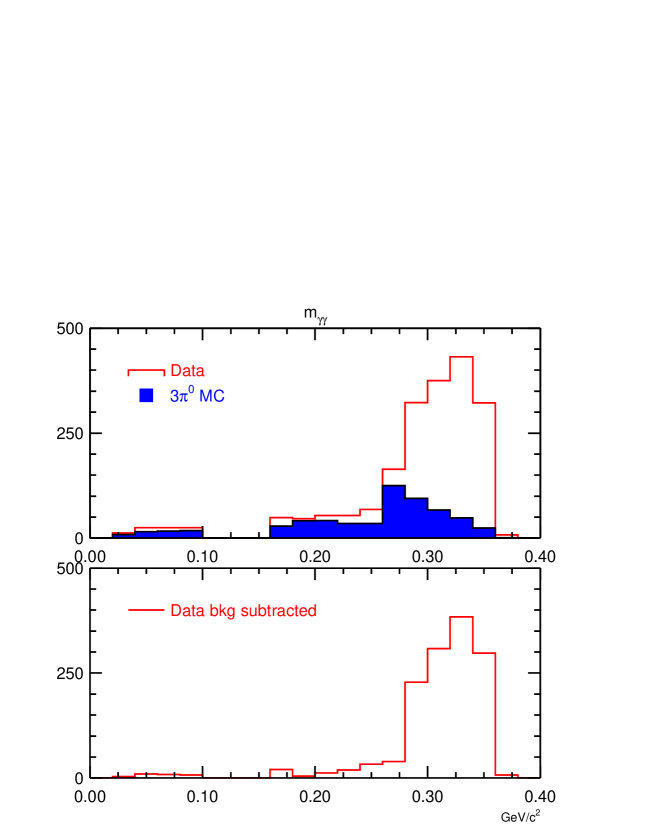
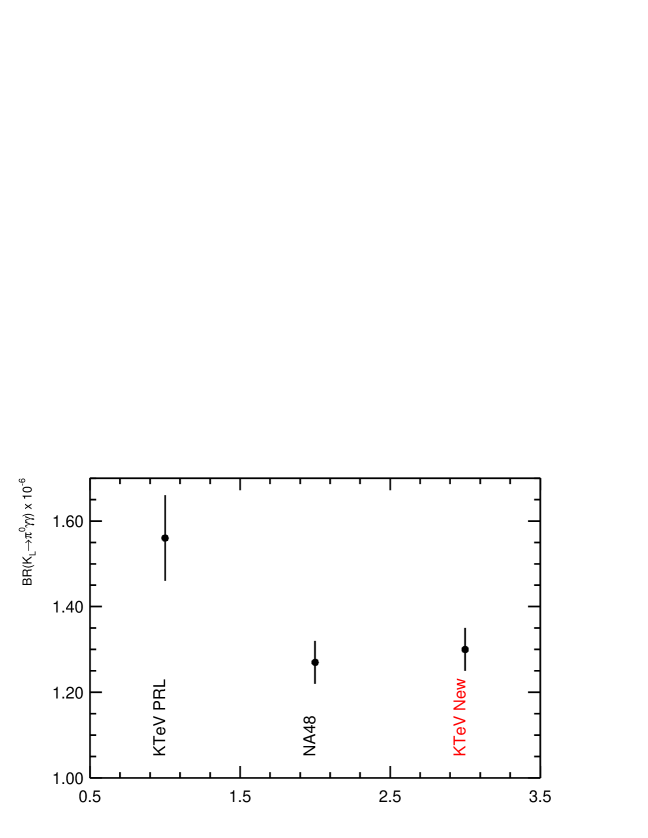
After applying all cuts, we find 139 events over a background of 14.4 events as shown in Figure 7. We reconstructed 80,445 events used for normalization. This allows us to determine the branching ratio for to be BR() = where the first error is statistical and the second is systematic. The results from the 1997 and 1999 data sets are shown separately in Figure 7, along with the previously published result on . The published result and our new 1997 result use the same data set. Although the branching ratio results for these two results differ, the two results are statistically consistent with each other. We expect the two results to differ because of differences in selection criteria and calibration constants. As in the , the normalization mode branching ratio has decreased by approximately 8% from the value used in the published KTeV result. The systematic uncertainties are listed in Table 2. The largest systematics come from the limited Monte Carlo statistics and the dependence of the result on the parameter .
| Systematic | Error (%) |
|---|---|
| MC Statistics | 4.2 |
| dependence | 3.8 |
| and BR | 2.8 |
| bkg | 0.8 |
| acceptance | 0.4 |
| background | 0.1 |
| Total | 6.4 |
5 Search for
In this decay we use the Dalitz decay for one of the neutral pions. We chose this because the fully neutral mode trigger was heavily prescaled, whereas the KTeV two-track trigger was not. The final state consists of an pair, and three photons in the CsI calorimeter. As in the other analyses discussed in this paper, there are three possible combinations of photons for each event. Again, we choose the combination that reconstructs closest to the mass.
The main background to this decay comes from events, since cannot contribute to the background without the addition of accidental particles. Two variables are effective in reducing the background to this mode. The first is to employ the photon shape variable described above. This reduces events in which two of the photons overlap in the calorimeter. The second varible used is the missing momentum in the kaon rest frame, . Cutting on this variable significantly reduces the background.
A unique feature of this analysis is that the normalization mode is not fully reconstructed. Rather we use events in which one of the photons passes through one of the beam holes in the CsI calorimeter. This photon is kinematically constrained using the known kaon mass.
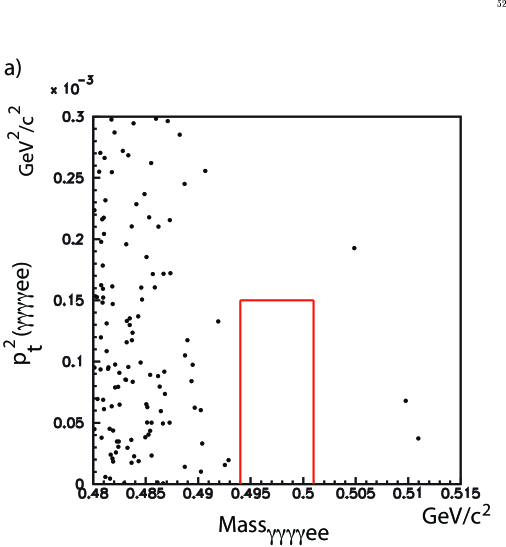
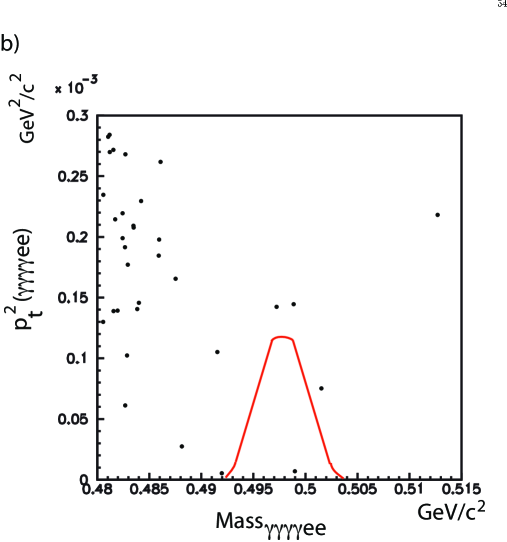
The final candidates are shown in Figures 8, where the reconstructed kaon mass is shown along the -axis and the kaon transverse momentum squared, , is shown on the -axis. For the 1997 sample we chose a square signal region, while for the 1999 sample we formed a likelihood from the product of the and probabilities. After all cuts we found no events in the 1997 sample and one event in the 1999 sample. The probability of this event to come from background is determined to be approximately 10%.
Using our normalization sample, we determine an upper limit of BR() . This constitutes an improvement of about 20 over the previous limit from NA31. However, this limit is well-above the predictions for this decay.
6 Summary and Conclusions
The KTeV experiment has presented three new results on , and . The first result is competitive with the world’s best result from NA48, while the other two represent the world’s best measurements on these two decays. The measured branching ratios are both inconsistent with the predictions from chiral perturbation theory, and consistent with chiral perturbation theory.
References
- [1] G.D. Barr et al., Phys. Lett. B284, 440 (1992).
- [2] V. Papadimitriou et al. Phys. Rev. D44, 573 (1991).
- [3] G. D’Ambrosio and J. Portoles, Nucl. Phys. B492, 417 (1997).
- [4] J. Donoghue and F. Gabbiani, Phys. Rev. D56, 1605 (1997).
- [5] P. Heiliger and L.M. Sehgal, Phys. Lett. B307, 182 (1993).
- [6] G. Ecker, H. Neufeld and A. Pich, Nucl. Phys. B413, 321 (1994).
- [7] J.R. Batley et al., Phys. Lett. B576, 43 (2003).
- [8] J.R. Batley et al., Phys. Lett. B599, 197 (2004)..
- [9] A. Lai et al., Phys. Lett. B536, 229 (2002).
- [10] A. Alavi-Harati et al., Phys. Rev. Lett. 83, 917 (1999).
- [11] G. D’Ambrosio, G. Ecker, G. Isidori and J. Portoles, J. High Energy Physics, 08, 004 (1998).