Improved Measurement of the Branching Fraction and Energy
Spectrum of from Decays
O. Aquines
Z. Li
A. Lopez
S. Mehrabyan
H. Mendez
J. Ramirez
University of Puerto Rico, Mayaguez, Puerto Rico
00681
G. S. Huang
D. H. Miller
V. Pavlunin
B. Sanghi
I. P. J. Shipsey
B. Xin
Purdue University, West Lafayette, Indiana 47907
G. S. Adams
M. Anderson
J. P. Cummings
I. Danko
J. Napolitano
Rensselaer Polytechnic Institute, Troy, New York
12180
Q. He
J. Insler
H. Muramatsu
C. S. Park
E. H. Thorndike
F. Yang
University of Rochester, Rochester, New York 14627
T. E. Coan
Y. S. Gao
F. Liu
Southern Methodist University, Dallas, Texas 75275
M. Artuso
S. Blusk
J. Butt
J. Li
N. Menaa
R. Mountain
S. Nisar
K. Randrianarivony
R. Redjimi
R. Sia
T. Skwarnicki
S. Stone
J. C. Wang
K. Zhang
Syracuse University, Syracuse, New York 13244
S. E. Csorna
Vanderbilt University, Nashville, Tennessee 37235
G. Bonvicini
D. Cinabro
M. Dubrovin
A. Lincoln
Wayne State University, Detroit, Michigan 48202
D. M. Asner
K. W. Edwards
Carleton University, Ottawa, Ontario, Canada K1S 5B6
R. A. Briere
I. Brock
Current address: Universität Bonn; Nussallee 12; D-53115 Bonn
J. Chen
T. Ferguson
G. Tatishvili
H. Vogel
M. E. Watkins
Carnegie Mellon University, Pittsburgh, Pennsylvania
15213
J. L. Rosner
Enrico Fermi Institute, University of Chicago,
Chicago, Illinois 60637
N. E. Adam
J. P. Alexander
K. Berkelman
D. G. Cassel
J. E. Duboscq
K. M. Ecklund
R. Ehrlich
L. Fields
R. S. Galik
L. Gibbons
R. Gray
S. W. Gray
D. L. Hartill
B. K. Heltsley
D. Hertz
C. D. Jones
J. Kandaswamy
D. L. Kreinick
V. E. Kuznetsov
H. Mahlke-Krüger
P. U. E. Onyisi
J. R. Patterson
D. Peterson
J. Pivarski
D. Riley
A. Ryd
A. J. Sadoff
H. Schwarthoff
X. Shi
S. Stroiney
W. M. Sun
T. Wilksen
M. Weinberger
Cornell University, Ithaca, New York 14853
S. B. Athar
R. Patel
V. Potlia
J. Yelton
University of Florida, Gainesville, Florida 32611
P. Rubin
George Mason University, Fairfax, Virginia 22030
C. Cawlfield
B. I. Eisenstein
I. Karliner
D. Kim
N. Lowrey
P. Naik
C. Sedlack
M. Selen
E. J. White
J. Wiss
University of Illinois, Urbana-Champaign, Illinois
61801
M. R. Shepherd
Indiana University, Bloomington, Indiana 47405
D. Besson
University of Kansas, Lawrence, Kansas 66045
T. K. Pedlar
Luther College, Decorah, Iowa 52101
D. Cronin-Hennessy
K. Y. Gao
D. T. Gong
J. Hietala
Y. Kubota
T. Klein
B. W. Lang
R. Poling
A. W. Scott
A. Smith
P. Zweber
University of Minnesota, Minneapolis, Minnesota
55455
S. Dobbs
Z. Metreveli
K. K. Seth
A. Tomaradze
Northwestern University, Evanston, Illinois 60208
J. Ernst
State University of New York at Albany, Albany, New
York 12222
H. Severini
University of Oklahoma, Norman, Oklahoma 73019
S. A. Dytman
W. Love
V. Savinov
University of Pittsburgh, Pittsburgh, Pennsylvania
15260
(October 10, 2006)
Abstract
We present an improved measurement of the meson energy
spectrum in decays, using 1.2 of data
taken at the center-of-mass energy with the CLEO III
detector. We compare our results with models of the
gluonic form factor that have been suggested to explain the
unexpectedly large
rate. Models based on perturbative QCD fail to fit
the data for large energies, and thus an explanation
outside the realm of the Standard Model or an improved understanding
of non-perturbative QCD effects may be needed to account for this
large rate.
pacs:
13.25.Gv,13.25.Hw,13.66.Bc
††preprint: CLNS 06/1970††preprint: CLEO 06-15
I Introduction
CLEO observed a surprisingly large branching fraction for the
decay at large momenta of the meson
Browder ; Ernst . BaBar babar later obtained . This momentum is beyond the end
point for most decays, so the yield from is expected to be only of the order of .
Predictions assuming factorization Kagan:1997 ; qcdfact
estimate the charmless component of this branching fraction to be
also about . Thus conventional calculations
cannot account for the measured rate and they also fail to predict
the right shape for the momentum spectrum Kagan02 .
These findings motivated intense theoretical
activity because new physics could account for such an
enhancement. However, Standard Model explanations have also been
proposed. For example, Atwood and Soni Atwood:1997bn argued
that the observed excess is due to an enhanced penguin
diagram, complemented by a strong coupling,
induced by the gluonic content of the wave function.
Fig. 1 (left) shows the corresponding Feynman diagram.
The high region of the vertex function
involved in this process also affects fast production in
decay Kagan02 ; Atwood:1997bn ; Ali:2000ci , whose
relevant diagram is shown in Fig. 1 (right). Thus a
precise measurement of the inclusive spectra from the
process can improve our
understanding of important meson decays.
Figure 1: Feynman
Diagram for (left) and (right).
The effective vertex function can be written as
Atwood:1997bn , where is the virtual
gluon’s four-momentum, is the “on-shell” gluon’s
momentum (), , represent color indices,
are the polarization
vectors of the two gluons, and is the
transition form factor. Different assumptions on the form factor
dependence have been proposed Atwood:1997bn ; Hou:1997wy ; Kagan:1997 ; Ali:2000ci ; pQCD ; kroll .
While ARGUS was the first experiment to study the inclusive production at the argus , they did not have enough
data to separate from the other components
discussed below. CLEO II jc was the first experiment to
have sufficient statistics to measure inclusive
production from the subprocess . These data
ruled out a class of form factors characterized by a very weak
dependence Atwood:1997bn ; Hou:1997wy . Subsequently,
several theoretical calculations Ali:2000ci ; pQCD ; kroll
derived the perturbative QCD form factors from models of the wave function. Attempts to use CLEO II data to constrain the
model parameters ali-extended were not conclusive, due to
the limited statistics at the end point of the spectrum.
Thus, it was difficult to establish whether neglecting higher
order terms in the perturbative expansion was appropriate
ali-extended . An improved measurement, based on a
higher-statistics sample, is important to provide an improved
determination of the QCD parameters, and, consequently, a more
stringent test of the theory. This work reports a new measurement
of the inclusive spectrum from the process based on the largest sample
presently available, more than a factor of 11 greater than the
previous study jc .
II Data sample and analysis method
We use 1.2 of CLEO III data recorded at the
resonance, at 9.46 GeV center-of-mass energy, containing
events, and off-resonance continuum data collected
at center-of-mass energies of 10.54 GeV (2.3 ).
The CLEO III detector includes a high-resolution charged particle
tracking system track , a CsI electromagnetic calorimeter
csi , and a Ring Imaging Cherenkov (RICH) hadron
identification system rich . The CsI calorimeter measures
the photon energies with a resolution of 2.2% at GeV and
5% at =100 MeV. The tracking system also provides charged
particle discrimination, through the measurement of the specific
ionization .
We detect mesons through the channel , with . The branching fractions
for these processes are (44.51.4)% and (39.380.26)%
pdg06 respectively. We identify single photons based on
their shower shape. The photon four-vectors are constrained to
have invariant mass equal to the nominal mass.
Subsequently, candidates are combined with two oppositely
charged tracks to form an . Loose consistency
criteria based on measurements are applied to the charged
tracks.
The gluonic production at the is expected to be
dominant only at very high , or, equivalently, at high
scaled energy , where is defined as
(1)
where is the energy and is
the beam energy. Enhanced production at high would
indicate a large coupling.
For low-energy mesons, photons coming from low energy s are a severe source of background. Thus a veto is
applied for , whereby photon pairs that have an invariant
mass consistent within 2.5 with the nominal mass
are not included as the candidate photons for reconstruction.
We consider only with scaled energy between 0.2 and 1
and divide this range into eight equal bins. Fig. 2
shows the yields in these bins for the sample.
Fig. 3 shows the corresponding distributions from the
continuum sample taken at a center-of-mass energy of 10.54 GeV. In
order to derive the signal yields, we fit the distributions [] in each bin with a Gaussian function
representing the signal, and a polynomial background. The Gaussian
is used only to define a signal interval. Then the
yield in this interval is evaluated counting events in the
signal window, after subtracting the background estimate obtained
from the fit function. As the signal is not
described well by a single Gaussian function, this procedure
minimizes systematic uncertainties associated with the choice of an
alternative signal shape.
Figure 2: The spectra of the difference of the
and invariant masses in
different ranges reconstructed from data,
fit with a single Gaussian function for the signal and a first-order
polynomial for the background.Figure 3: The spectra of the difference of the
and invariant masses in
different ranges reconstructed from continuum data taken at
a center-of-mass energy of 10.54 GeV,
fit with a single Gaussian function for the signal and a first order
polynomial for the background.
Information on the gluon coupling of the can be drawn only
from the decay chain , described
by the Feynman diagram in Figure 1. Thus we need to subtract both
continuum production and from the process . The latter component is estimated
using
(2)
where is the ratio between the hadronic cross section and the di-muon cross section at an energy close to 9.46 GeV. We use ammar:1998 and % pdg06 . The yield is
estimated with the relationship
(3)
where is the number of hadronic events in our
sample, and is the number of continuum
events derived from the 10.54 GeV continuum data set, corrected for
the luminosity difference between resonance and continuum data, and
the center-of-mass dependence of the cross section for the process
.
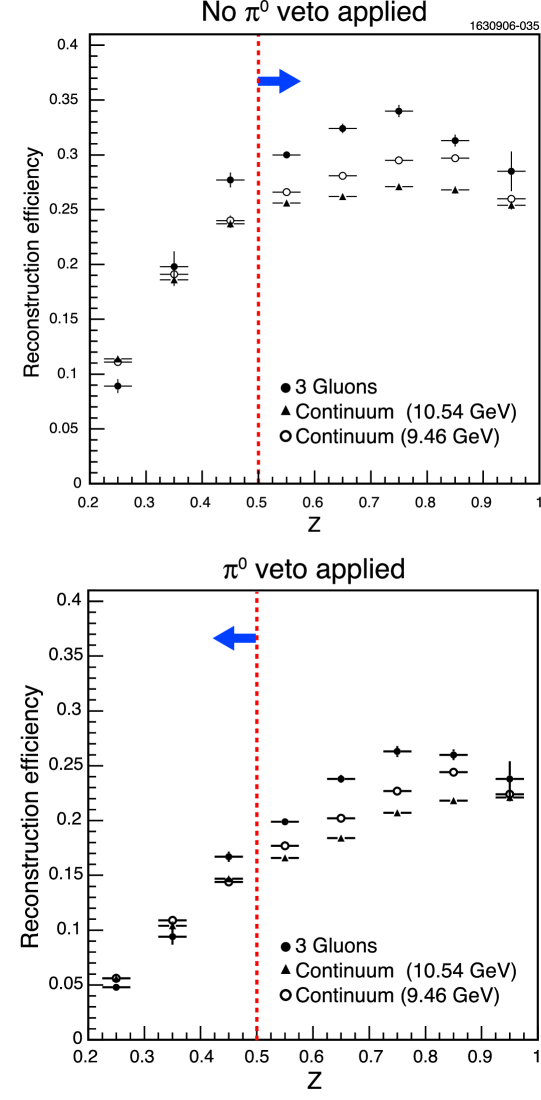
The two dominant components of the spectrum have different
topologies: produces a spherical event
topology, whereas processes are more jet-like. This
difference affects the corresponding reconstruction efficiencies.
The cross section is only about 3% of the
cross section; thus we make no attempt to subtract the former
component from the latter. Fig. 4 shows the efficiencies
obtained for the two event topologies with CLEO III Monte Carlo
studies. We use GEANT-based geant Monte Carlo samples,
including and continuum samples. In order to use the
continuum sample taken at 10.54 GeV center-of-mass energy for
background subtraction, we develop a “mapping function” to correct
for the difference in phase space and range spanned in the two
samples. The procedure is described in detail in Ref. jc . In
brief, we use the energy distribution functions for the
Monte Carlo continuum samples at center-of-mass energies equal to
9.46 and 10.54 GeV and obtain a relationship between the measured
at higher center-of-mass energy :
(4)
Figure 4: The reconstruction efficiencies as
function of
for different MC samples with no veto, and with veto in
photon selection. The veto was applied in this analysis for .
We derive the spectrum from the decay from the efficiency corrected yields
in each bin, subtracting the contributions from continuum and
as shown in Equation 3. In this case,
the spectrum from the process
is corrected for the distortion introduced by initial state
radiation (ISR) on the continuum energy spectrum used to
account for this effect. The partial yield is estimated with the relationship
(5)
where accounts for the difference between the
and the spectra due to initial state radiation (ISR) effects,
estimated using Monte Carlo continuum samples with and without ISR
simulation, and accounts for the relative cross section of these two
processes. The correction factor differs from 1
by a few percent at low and as much as 25% at the end point of
the energy. The cross sections used are
nb pdg06 and
nb
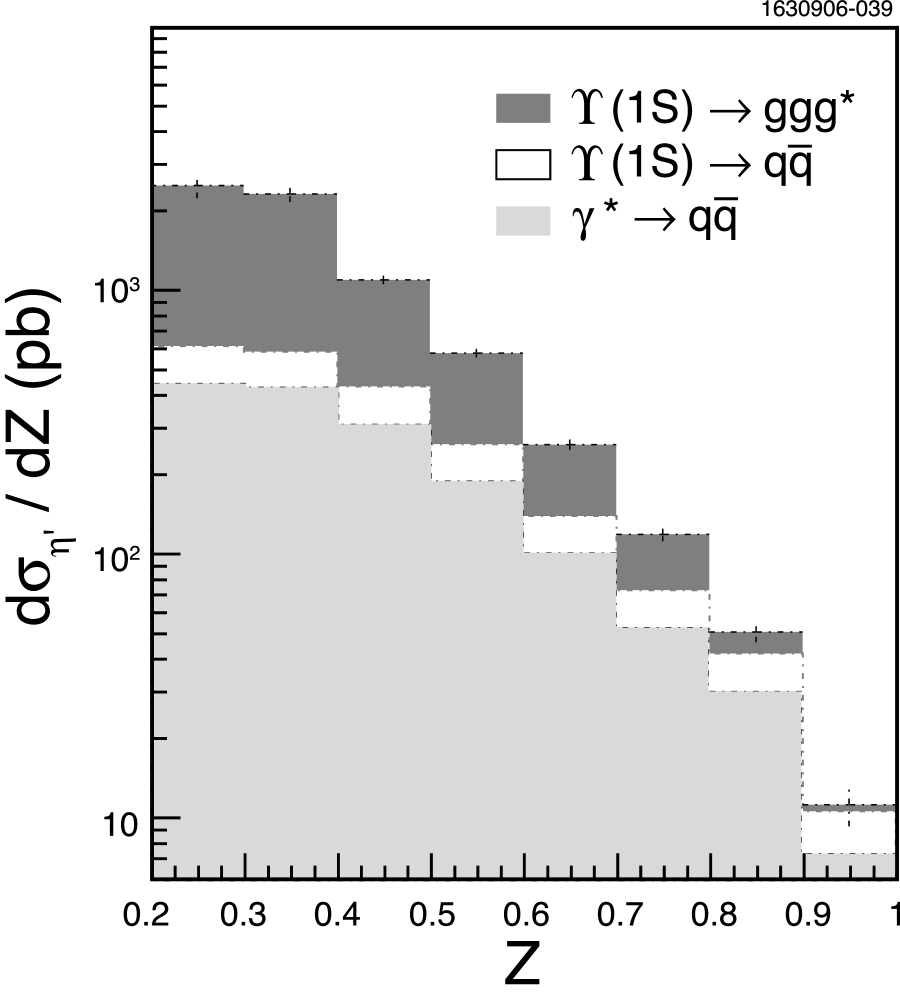
fpair . Fig. 5 shows the measured
differential cross sections for the processes
, , and, .
Figure 5: The measured differential cross
sections for a)
(shaded), b) (white) and c) (black).
Theoretical predictions give the energy distribution function
; we obtain the corresponding experimental quantity
by dividing by the total number of ,
estimated by applying Equation 3 without any
restriction. Figure 6.a) shows the energy distribution function, whereas
Fig. 6.b) and c) show the corresponding distributions
for , normalized with respect of the
total number of and ,
normalized with respect to the total number of .
Figure 6: The energy distribution function
as defined in
the text for a) , b) , and c) .
The inclusive production at the is expected to be
dominated by the transition only at
high energy. The energy at which this occurs cannot be
predicted from first principles: an empirical criterion is the
of the theory fit to the data. For example, a numerical
analysis of the CLEO II data ali-extended obtained a of 2.4 for three degrees of freedom, using the 3 experimental
points at , and 24 for 4 degrees of freedom
using the 4 points at . This observation led Ali and
Parkhomenko to conclude that the region likely to be dominated
by starts at . Thus we
quote global branching fractions for and the
corresponding results for separately.
Table 1 summarizes the dominant components of the
systematic uncertainties. The overall relative errors on the branching fractions are for ,
for for and for all other branching fractions.
Sources
Sample ()
Sample
All others
Reconstruction efficiency of
2.0
2.0
2.0
Reconstruction efficiency of
5.0
5.0
5.0
Number of from fit
1.0
1.0
1.0
Total number of
1.0
1.0
1.0
3.4
3.4
3.4
-
3.0
-
Ratio of integrated luminosity
1.9
1.0
-
0.7
1.3
-
veto
-
1.7
0.4
mapping
6.0
3.0
3.0
Total
9.1
8.1
7.2
Table 1: The components of the systematic errors
(%) affecting the branching fractions reported in this paper.
Thus we obtain
(6)
The branching fractions at high momentum () are measured to be
to obtain a first rough discrimination between form factors having
drastically different dependence. At the time that
Ref. Kagan02 was published, the comparison was based on 90%
C.L. upper limits on the data. This test repeated with our present
data give values of for a representative slowly
falling form factor Hou:1997wy , for the
intermediate form factor studied by Ref. Kagan:1997 , and
for the perturbative QCD inspired shape. Thus
the last shape is the closest to the data, but it does not match
them very well.
Several perturbative QCD calculations of this process exist, and are
based on different choices of the form factor : Kagan and
Petrov Kagan02 assume ; Ali and Parkhomenko relate to the
expansion of the two light-cone distribution amplitudes (LCDA)
describing the quark and gluon components of the wave
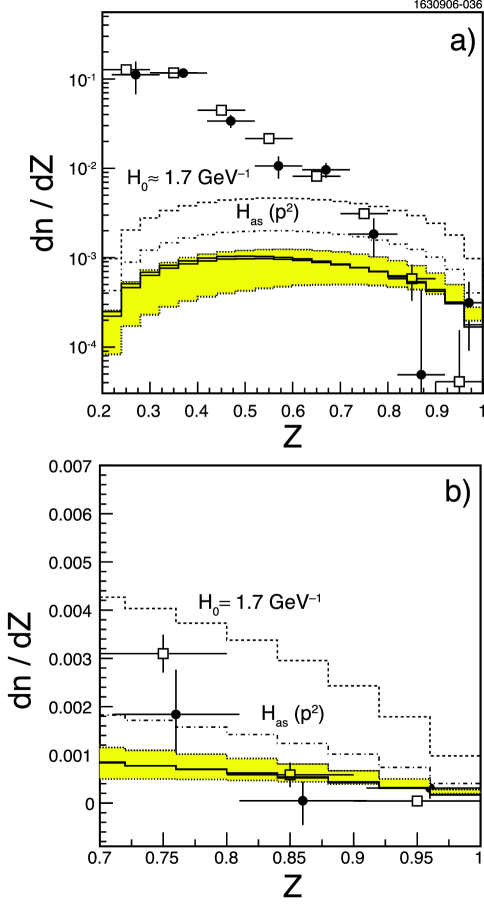
function ali-extended . Figure 7 shows the
measured distribution, compared with three representative
choices for : GeV-1,
, based on the asymptotic form of the
meson LCDAs, and corresponding to the Ali and Parkhomenko
ali-extended formalism, with the parameters extracted from
the previous CLEO II data and the constraints from the transitions kroll . Note that in the range where
is the relevant source of most of the
discrepancy between theory and data occurs in the bin. In
fact, the for the fit of the new data with this
theoretical parametrization is 27 for 3 degrees of freedom. This may
imply that higher order terms in the QCD expansion need to be taken
into account, or that the is not the dominant
source of , at least at a scaled energy as high as .
In conclusion we have measured the energy spectra of the
meson in the decay . Our results are not very
well described by existing models based on strong gluonic coupling
of the . Thus the observed inclusive
branching fraction is unlikely to be explained by an enhanced
form factor, and an explanation outside the
realm of the Standard Model or an improved understanding of
non-perturbative QCD effects may be needed to account for this
large rate.
Figure 7:
Energy spectrum of the -meson in the decay
(open squares correspond to the data
presented in this paper, filled circles are the previously
reported CLEO II data jc ): a) measured spectra (log
scale);
b) expanded view of the region
to show the comparison with the theoretical
predictions more clearly (linear scale). The dashed curve corresponds to a constant
value of the function GeV-1, and the
dash-dotted curve () corresponds to the asymptotic form
of the -meson LCDA ali-extended (i.e., and
). The spectrum with the Gegenbauer coefficients ali-extended in
the combined best-fit range of these parameters is shown in the
shaded region. The solid curve
corresponds to the best-fit values of the parameters in the
form factors from Ref. ali-extended
from the analysis of the CLEO II data alone.
IV Acknowledgements
We would like to thank A. Kagan and A. Ali for useful discussions
and for providing us with their calculations. We gratefully
acknowledge the effort of the CESR staff in providing us with
excellent luminosity and running conditions. D. Cronin-Hennessy and
A. Ryd thank the A.P. Sloan Foundation. This work was supported by
the National Science Foundation, the U.S. Department of Energy, and
the Natural Sciences and Engineering Research Council of Canada.
References
(1)
T. E. Browder et al. [CLEO Collaboration], Phys. Rev. Lett.
81, 1786 (1998) [hep-ex/9804018].
(2)
G. Bonvicini et al. [CLEO Collaboration],
Phys. Rev. D 68, 011101 (2003)
[hep-ex/0303009].
(3)
B. Aubert et al. [BABAR Collaboration],
Phys. Rev. Lett. 93, 061801 (2004)
[hep-ex/0401006].
(4)
A. Datta, X. G. He, S. Pakvasa,
Phys. Lett. B 419, 369 (1998) [hep-ph/9707259].
(5)
A. Kagan and A. A. Petrov [hep-ph/9707354].
(6) A. L. Kagan, AIP Conf. Proc. 618, 310 (2002)
[hep-ph/0201313].
(7)
D. Atwood and A. Soni,
Phys. Lett. B 405, 150 (1997) [hep-ph/9704357].
(8)
A. Ali and A. Y. Parkhomenko,
Phys. Rev. D 65, 074020 (2002) [hep-ph/0012212].
(9)
W. S. Hou and B. Tseng,
Phys. Rev. Lett. 80, 434 (1998) [hep-ph/9705304].
(10)T. Muta and M. Z. Yang,
Phys. Rev. D 61, 054007 (2000) [hep-ph/9909484].
(11)
P. Kroll and K. Passek-Kumericki, Phys. Rev. D 67, 054017
(2003) [hep-ph/0210045].
(12)
H. Albrecht et al. [ARGUS Collaboration],
Z. Phys. C 58, 199 (1993).
(13)
M. Artuso et al. [CLEO Collaboration],
Phys. Rev. D 67, 052003 (2003).
(14)
A. Ali and A. Y. Parkhomenko,
Eur. Phys. J. C 30, 183 (2003)
[hep-ph/0304278].
(15)
D. Peterson et al., Nucl. Instrum. Meth. A 478, 142
(2002).
(16)
Y. Kubota et al., Nucl. Instrum. Meth. A 320, 66
(1992).
(17)
M. Artuso et al.,
Nucl. Instrum. Meth. A 502, 91 (2003) [hep-ex/0209009].
(18)
R. Ammar et al. [CLEO Collaboration],
Phys. Rev. D 57, 1350 (1998) [hep-ex/9707018].
(19) W. M. Yao et al., Journal of
Physics G 33, 1 (2006).
(20)
R. Brun et al., computer code GEANT3.21, CERN Program Library
Long Write Up W5013 (1992).
(21)
R. Kleiss and S. van der Marck, Nucl. Phys. B 342, 61
(1990).