High-statistics measurement of the pion form factor in the -meson energy range with the CMD-2 detector
Abstract
We present a measurement of the pion form factor based on annihilation data from the CMD-2 detector in the energy range GeV with a systematic uncertainty of 0.8%. A data sample is five times larger than that used in our previous measurement.
aBudker Institute of Nuclear Physics, 630090, Novosibirsk, Russia
bNovosibirsk State University, 630090, Novosibirsk, Russia
cBoston University, Boston, MA 02215, USA
dYale University, New Haven, CT 06511, USA
eUniversity of Pittsburgh, Pittsburgh, PA 15260, USA
fWeizmann Institute of Science, 76100, Rehovot, Israel
1 Introduction
Measurement of the pion form factor , or the cross section , in the center-of-mass (c.m.) energy range GeV is interesting for studies of the pion internal structure, for the analysis of the properties of the light vector mesons (, , ) and their excitations, and as a determination of an important contribution to .
The total cross section , which is dominated by the cross section in the energy range under discussion, is often expressed as the dimensionless ratio
| (1) |
and has been an important topic in high energy physics since the quark model was established. Recent interest to the measurement of was stimulated by the measurement of the anomalous magnetic moment of the muon at BNL [1] with the unprecedented precision of 0.54 ppm. The measured value of is about 2 to 3 standard deviations above the Standard Model expectation, which could indicate the long-sought existence of New Physics. When integrated with the proper kernel function, gives a value of — the leading order hadronic contribution to . The accuracy of the SM prediction, currently ppm [2], is dominated by the knowledge of at GeV, where the measurement of the cross section is the only source of .
The energy range GeV has been studied at the electron-positron collider VEPP-2M [3] (Novosibirsk, Russia). Two experiments, CMD-2 [4, 5] and SND [6], started in 1992 and 1995, respectively, and continued up to 2000, when the collider was shut down. The CMD-2 detector consists of the drift chamber, the proportional Z-chamber, the barrel CsI calorimeter, the endcap BGO calorimeter and the muon range system. The drift chamber, Z-chamber and the endcap calorimeters are placed inside a thin superconducting solenoid with a field of 1 T.
CMD-2 collected data at five separate energy scans, starting from 1994. Approximately events were selected for analysis. From analysis perspectives, the VEPP-2M energy range is naturally subdivided into three intervals. In the energy range GeV, covered in the 1996 data taking run, the momentum resolution of the drift chamber is good enough to separate the , and in the final states [7]. At higher energies, the energy deposition in the calorimeter is used for the separation. The energy range GeV, covered in the 1997 run [8], is distinguished by the relatively small value of the cross section. The bulk of the data were collected in the energy range GeV, where the cross section is enhanced by the resonance. This interval was covered in the 1994-95 run [9, 10], and later the measurement was repeated in 1998 with five times larger integrated luminosity. The analysis of the 1998 data sample is discussed in this paper.
2 Data Analysis
2.1 Overview
The data were collected at 29 energy points covering the c.m. energy range GeV with energy steps varying from 0.001 GeV at the -meson peak to 0.030 GeV at the -resonance tails.
The analysis follows the approach used in our previous measurement [9, 10]. From triggers recorded, about events were selected as collinear, with a signature of two particles of opposite charges and nearly back-to-back momenta originating from the interaction point. The following selection criteria were used:
-
1.
The event was triggered by the trackfinder.
-
2.
Two tracks of opposite charge originating from the interaction region were reconstructed in the drift chamber.
-
3.
Each track was reconstructed using at least 7 wire hits.
-
4.
The minimal distance from two tracks to the beam axis, , is less than 0.3 cm and z-coordinate of the vertex (along the beam axis) is within cm.
-
5.
The average momentum of the two particles is between 200 and 600 MeV/c.
-
6.
The transverse momentum of each track is above 100 MeV/c.
-
7.
The difference between the azimuthal angles (in the plane perpendicular to the beam axis) of the two particles .
-
8.
The difference between the polar angles (the angle between the momentum and the beam axis) of the two particles .
-
9.
The average polar angle of the two particles is within . This criterion determines the fiducial volume.
The sample selected contains beam-originating , , events and the small background of cosmic particles, mostly muons, which pass near the interaction region and mimic collinear events. The number of the background events is determined from the analysis of the spatial distribution of the vertex.
The three beam-originating final states were separated using the information on the particle energy deposition in the CsI calorimeter. The separation procedure is based on the minimization of the unbinned likelihood function:
| (2) |
where is the final state (, , , ), is the number of events of the type and is the probability density function (p.d.f.) for an event of type to have the energy depositions and .
It is assumed that and are independent for events of the same type, therefore the p.d.f. can be factorized as
where are the energy deposition p.d.f.s for individual , , and cosmic muons. This assumption is not entirely correct. The energy deposition depends on the calorimeter thickness seen by particle ( at ). Since the incident angles at which the two particles in the final state hit the calorimeter are nearly the same, that leads to a correlation between and . This effect is corrected for by the recalibration of the energy deposition. The second source of the correlation is introduced by initial state radiation. This effect will be discussed in more detail in section 2.4.
The overlap between the energy deposition of electrons and pions is rather small, which makes the described procedure very robust. However, the energy deposition of muons and pions is not that different, therefore the small errors in the p.d.f. for these particles lead to a large correlated error for and . To avoid this problem, the ratio of the number of pairs to the number of pairs is fixed during the minimization at the value calculated according to QED with radiative corrections and detection efficiencies taken into account:
where are the Born cross-sections, are the radiative corrections and are the efficiencies.
The specific form of the energy deposition functions (p.d.f.s) was evaluated in the variety of studies. P.d.f.s for electrons (positrons) and background muons were obtained with the specially selected subsets of data. P.d.f.s for minimum ionizing particles (muons and pions without nuclear interactions) were extracted from the simulation. The complete p.d.f. for pions with nuclear interactions taken into account was obtained from the analysis of the energy deposition of tagged pions coming from the decay, a high-statistics measurement of which was performed at CMD-2 in separate data taking runs [11]. In all cases, only the functional form of p.d.f.s was fixed. The particular values of the function parameters were determined by the minimization procedure.
To simplify the final error calculation, the likelihood function (2) is rewritten to have the following global fit parameters: and instead of and (with and fixed).
The pion form factor is calculated as:
| (3) |
where the ratio is determined in the minimization of (2), are the corresponding Born cross sections, integrated over the fiducial volume, are the radiative corrections, are the detection efficiencies, and are the corrections for the pion losses caused by decays in flight and nuclear interactions, respectively, is the correction for background and is the correction for the systematic shift, introduced by the separation procedure. In the case of , corresponds to point-like pions.
2.2 Efficiency
The most significant difference between 1994-95 and 1998 data analyses lies in the measurement of the detection efficiency . The efficiency is the product of the reconstruction efficiency and the trigger efficiency.
For the 1994-95 data the reconstruction efficiency is high ( 97%–99%) and the same for all three final states — studies showed that the difference does not exceed 0.2%. Therefore, the efficiencies cancel in (3).
In the run of 1998 the CMD-2 drift chamber showed signs of aging. That led to a lower reconstruction efficiency and, more important, to different values of the efficiency for the three final states. This difference, if unaccounted for, would lead to a significant systematic error on the form factor. Therefore, a direct measurement of the reconstruction efficiency for all types of collinear events was necessary.
This measurement is based on a well-known technique. A test sample of collinear events is selected using criteria based on the calorimeter data, which are uncorrelated with the standard selection criteria based on the information from the tracking system. The efficiency is calculated as a fraction of test events, which passed the standard selection criteria for collinear events.
The selection criteria for the test sample are the following:
-
1.
The event was triggered by the trackfinder.
-
2.
There are exactly two clusters in the calorimeter.
-
3.
There is a hit in the Z-chamber near each cluster. This requirement selects the clusters produced by a charged particle.
-
4.
The clusters are collinear if one takes into account the particle deflection in the detector magnetic field:
where and are the polar and azimuthal angles of the cluster and is the expected azimuthal deflection angle of particles in the CMD-2 magnetic field of 1 T.

The test event sample is subdivided into three classes:
-
1.
For the subset, the energy deposition of each cluster is between and MeV.
-
2.
For the subset, the energy deposition of one cluster is between 70 and 120 MeV and the energy deposition of another cluster is between 120 MeV and MeV.
-
3.
For the subset, the energy deposition of each cluster is between 70 and 120 MeV.
The definitions of the three classes of test events are demonstrated in Fig. 1.


The events have a unique signature of two high-energy clusters in the calorimeter, therefore this subset contains virtually no background. On the contrary, the and test samples contain a significant contribution of cosmic muon background. To subtract the background, the additional requirement to have at least one reconstructed track was added to the selection criteria for test events. This cut rejects only of events, and therefore does not introduce a significant contribution to the systematic error of the efficiency measurement. For each class of the test events, the distributions of the z-coordinate of the track origin were collected for events which pass the standard selection criteria and for events which failed them. The distributions, shown in Fig. 2, were fitted with the combination of a Gaussian-like distribution, which represents the beam-originating events, and a uniform distribution, which represents the background events. The efficiency for a particular class of test events is calculated as
where and , obtained from the fit, are the integrals of the Gaussian-like distributions for the cases, when test event pass and fail the standard selection criteria. The results of the efficiency measurement, and , are shown in Fig. 3. The wave-like structure of the efficiency as a function of energy is explained by varying conditions of data taking. The drift chamber performance was changing during the run, generally degrading with time as we scanned from higher to lower energies. Additional problems occurred during a long period when data were taken around the meson mass.


The test sample in addition to contains those events, where both pions in the final state interact as the minimum-ionizing particles (MIP). While it is possible to extract separate efficiencies for and events, the results have poor statistical precision. Therefore, a different approach was used. Since the difference between - and -signals in the drift chamber is much smaller than the difference between - and -signals, the difference is much smaller than . That allows us to measure the combined efficiency using the combined and test event samples, and then to extract the individual efficiencies and , applying a small correction estimated with the help of the GEANT simulation (Fig. 4(a)) to .
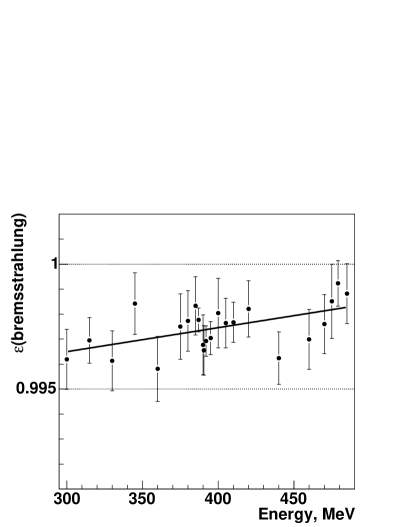
The procedure described does not account for Bhabha events where the electron or positron in the final state radiates a high-energy photon while passing the wall of the beam pipe or the inner part of the drift chamber. Such events mostly (90%) disappear from the test sample, as they typically have more than two clusters in the calorimeter. This contribution to the Bhabha reconstruction inefficiency was evaluated in the separate simulation. It changes slowly from 0.3% at MeV to 0.2% at MeV (Fig. 4(b)).
The efficiency measurement was tested with the full GEANT simulation, where the , , events were generated and mixed together. The drift chamber performance in the simulation was tuned to represent adequately the performance seen with the data. The complete procedure described above was applied to the simulated data. It was found that the difference between the measured and the true efficiencies does not exceed 0.2%.


The events used in the form factor analysis were triggered by the trackfinder — the dedicated track processor. The trackfinder generated positive decision when at least one track candidate was identified in the event. Information about all identified candidates is saved in the raw data stream.
The trigger efficiency measurement is based on the fact that there are two well-separated tracks in the final state. Using one track to ensure the trigger, the efficiency for a single track was calculated as the probability for the trackfinder to identify a track candidate in the vicinity of the second track. The trigger efficiency was calculated from the single track efficiency as .
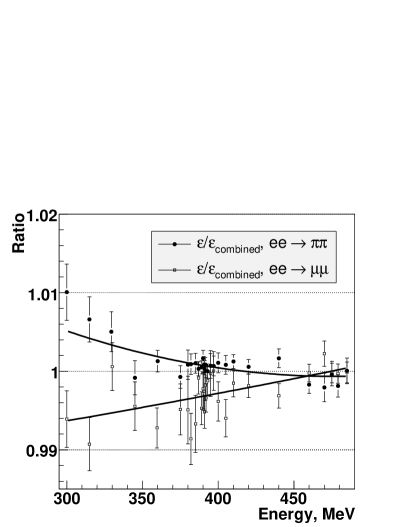
The same three samples of test events as for the reconstruction efficiency were used to measure the trigger efficiency. The contribution of the cosmic background was subtracted using the -distribution of the track origin. The results of the measurement are shown in Fig. 5. The trigger efficiency for and was found to be the same within 0.2%. The difference between efficiencies for and events, important for the form factor analysis, is negligible for energies GeV. For the lower energies the difference increases to , which coincides in time with the malfunction of one of the elements of the tracking system.
2.3 Radiative corrections
The radiative corrections in (3) were calculated according to [12]. The radiative corrections for and account for the radiation by the initial and final particles and for the effects of the vacuum polarisation. The radiative corrections for account for only the radiation by the initial and final particles.
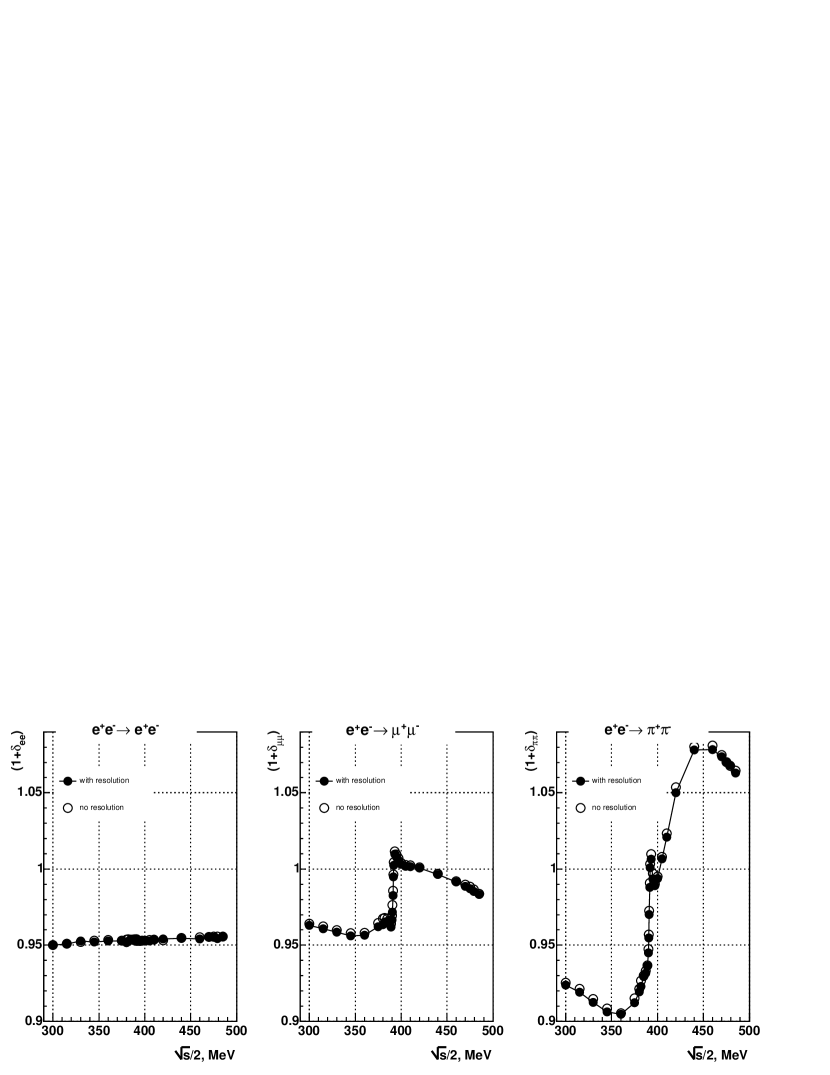
The calculation was performed using the fast Monte Carlo technique. The events have been first generated with the weak cuts in the wide solid angle, then the angles of the particles were smeared with the detector resolution and, finally, the selection cuts were applied. The detector resolution was obtained from the fit of the experimental and distributions with the convolution of the ideal and distributions, obtained from the primary generator, and the detector response function.
The results of the calculation are shown in Fig. 6. It is clear that the contribution from the detector resolution is negligible for the standard data selection. It becomes much more important if stricter cuts are applied.
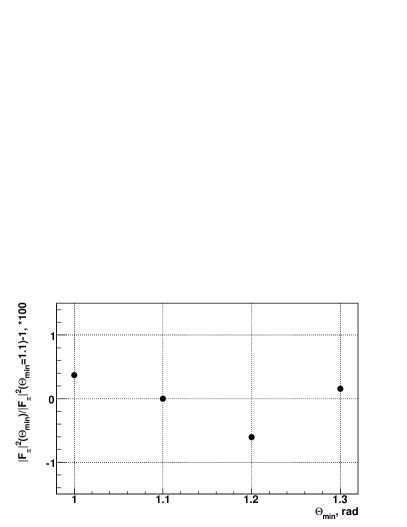
As an indirect test of calculations, the whole data analysis procedure was repeated for different cuts on , and . This test probes all pieces of the data analysis procedure. But since these cuts affect the radiation corrections much stronger than any other contribution, such as the efficiency, the procedure mainly tests the radiative corrections. The results are shown in Fig. 7. No changes outside the allowed limits were observed.

2.4 Other corrections
The corrections for the pion decay in flight , for the nuclear interactions of pions with the material of the beam pipe and the drift chamber and for the background were calculated with the help of simulation. The values of the corrections are the same as those used for the 94-95 data analysis [9].
One new correction, denoted as in (3), was applied to the 98 data set. An event where one of the original particles emits a hard photon is usually rejected because the final particles are not back-to-back. But if both initial particles radiate a hard photon, the final particles could stay back-to-back and therefore be accepted for the analysis. The effect of this double bremsstrahlung on the selection efficiency was taken into account in the radiative correction calculation. But this effect also introduces a correlation between the energy depositions of two final particles in the calorimeter, which introduces a systematic shift of the likelihood fit results.
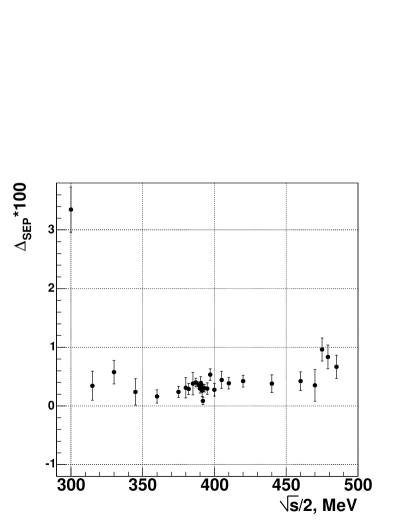
Two approaches were used to take this effect into account. The first one, applied in the analysis of the data above the -meson, is based on the minimization of the modified likelihood function, where the correlation term is introduced [8]. The different approach was used here. The correction to the results of the event separation was evaluated using the Monte Carlo simulation and applied to the final result. The size of the correction is small (0.3%), so this simple approach does not introduce any sizable systematic uncertainty. The correction is shown in Fig. 8. The same correction was evaluated when the double bremsstrahlung was switched off in the Monte Carlo simulation. A significantly smaller effect was observed, which proves that the double bremsstrahlung is the main source of the shift.
2.5 Systematic errors
| Source | Contribution, % |
|---|---|
| Event separation | 0.2 |
| Detection efficiency | 0.5 |
| Fiducial volume | 0.2 |
| Correction for pion losses | 0.2 |
| Beam energy determination | 0.3 |
| Radiative corrections | 0.4 |
| Total | 0.8 |
The main sources of the systematic error are summarized in Table 1. Some contributions have not changed since the 94-95 data analysis and are not discussed here, namely the fiducial volume and the corrections for the pion losses.
The event separation was tested with the help of simulation. In these studies the double bremsstrahlung was switched off in the primary generator, as was discussed in section 2.4. We studied how the following contributions affect the results: the calorimeter calibration, the initial and final state radiation, “dead” crystals in the calorimeter. The largest observed shift was about 0.2%, which was taken as a systematic error estimate. The additional double bremsstrahlung correction is small, so it was assumed that it gives no contribution to the systematic error.
The systematic error of the efficiency measurement was discussed in detail in section 2.2. We estimate this contribution to the systematic error to be less than 0.5%. It should be noted that the difference between the reconstruction efficiencies for and events on average is 2% and never exceeds 5%. Therefore, the estimated 0.5% suggests that this difference is known to about 25%.
The absolute beam energy was determined from the value of the collider magnetic field, which provided an accuracy better than . The energy uncertainty leads to a 0.3% systematic error of the contribution to the , which we include in the total systematic error in Table 1. The absolute energy scale can be calibrated with the measurement of the mass of -meson, the only narrow resonance in the energy range under analysis. To do the calibration we performed a fit of the measured form factor in which the mass was a free fit parameter, and obtained MeV, or . An independent determination of the mass with the same data set was performed in channel [13]. The result MeV, is consistent with our measurement.
The contribution of the radiative corrections to the systematic error is determined by the precision of the ratio . The radiative correction to each final state is known to 0.2% or better. We’ve added the contributions from two final states linearly to obtain 0.4% as the total contribution. Taking the detector resolution into account does not change the results significantly, therefore no additional contribution to the systematic error was added.
3 Results
| , MeV | , nb | |||
|---|---|---|---|---|
| 600 | 7.89 | 0.33 | 330.1 | 13.7 |
| 630 | 10.53 | 0.29 | 415.6 | 11.5 |
| 660 | 14.21 | 0.34 | 529.1 | 12.7 |
| 690 | 21.27 | 0.42 | 746.4 | 14.7 |
| 720 | 31.96 | 0.41 | 1053.6 | 13.5 |
| 750 | 42.13 | 0.62 | 1296.6 | 19.0 |
| 760 | 43.62 | 0.83 | 1311.4 | 25.0 |
| 764 | 44.48 | 0.73 | 1325.8 | 21.7 |
| 770 | 44.17 | 0.74 | 1302.0 | 21.7 |
| 774 | 45.46 | 0.53 | 1332.2 | 15.4 |
| 778 | 44.52 | 0.42 | 1296.0 | 12.2 |
| 780 | 43.00 | 0.56 | 1237.5 | 16.0 |
| 781 | 41.40 | 0.53 | 1178.3 | 15.2 |
| 782 | 39.64 | 0.20 | 1111.7 | 5.6 |
| 783 | 36.46 | 0.42 | 1007.0 | 11.7 |
| 784 | 33.80 | 0.37 | 922.4 | 10.1 |
| 786 | 31.25 | 0.38 | 844.1 | 10.2 |
| 790 | 31.05 | 0.61 | 836.6 | 16.4 |
| 794 | 30.61 | 0.48 | 822.5 | 12.8 |
| 800 | 29.82 | 0.39 | 794.8 | 10.4 |
| 810 | 26.78 | 0.38 | 701.6 | 9.9 |
| 820 | 23.44 | 0.26 | 602.9 | 6.6 |
| 840 | 17.89 | 0.20 | 443.3 | 5.1 |
| 880 | 10.37 | 0.15 | 239.0 | 3.4 |
| 920 | 6.76 | 0.09 | 145.4 | 2.0 |
| 940 | 5.20 | 0.12 | 108.0 | 2.5 |
| 950 | 4.75 | 0.10 | 97.2 | 2.1 |
| 958 | 4.26 | 0.09 | 86.0 | 1.8 |
| 970 | 3.94 | 0.09 | 78.0 | 1.8 |
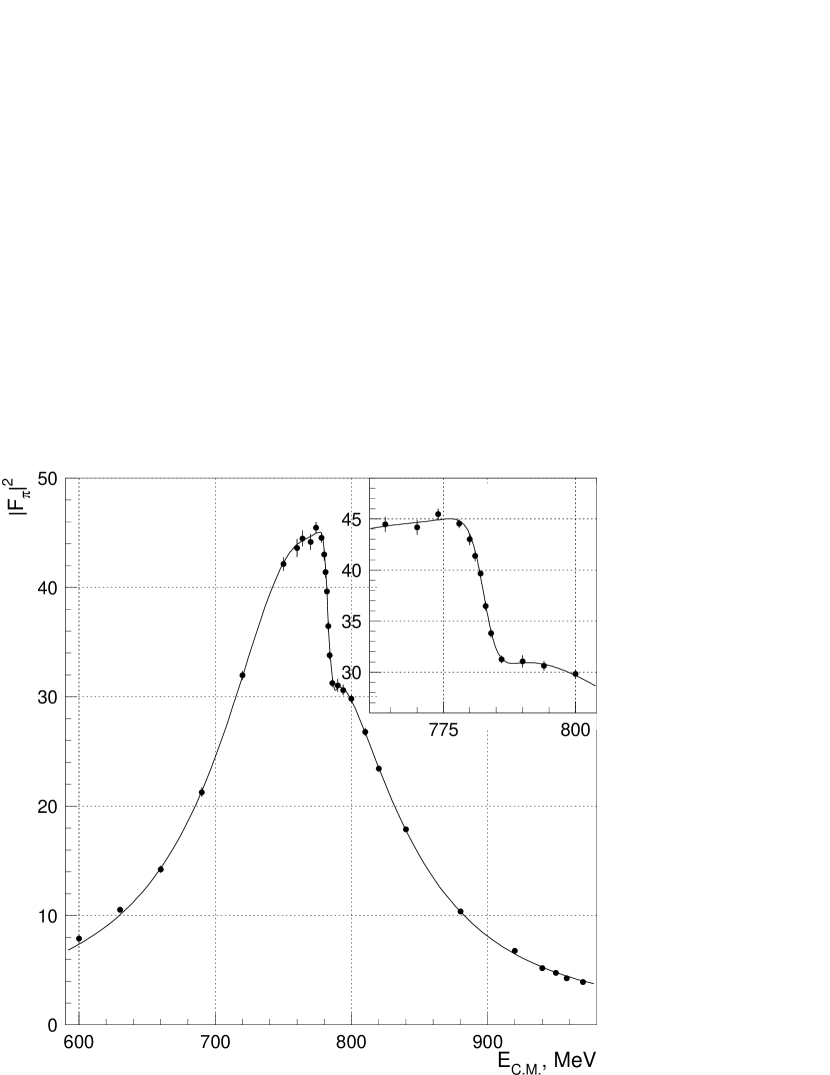
The measured values of the pion form factor are shown in Table 2. Only the statistical errors are shown. Also presented are the values of the bare cross-section defined as
where the factor excludes the effect of leptonic and hadronic vacuum polarization and the factor provides a correction for the final state radiation.
To obtain the parameters of the meson, the measured form factor was fitted with the same model, as was used in our previous measurement, which includes the contributions of the , and and is based on the Gounaris-Sakurai parameterization of the meson:
It is assumed that decays to through mixing only. More details on this model and the values of all fixed parameters can be found in [9]. The following parameters of the and were obtained:
The first error is statistical and the second is systematic taking into account the systematic uncertainties of the data and the beam energy. These results are in good agreement with our previous measurement [9, 10]. It should be noted that in our parameterization represents the combined effect of the and and therefore cannot be used to obtain the branching ratio. The value of is calculated from assuming VDM relations and keV, as described in [9].
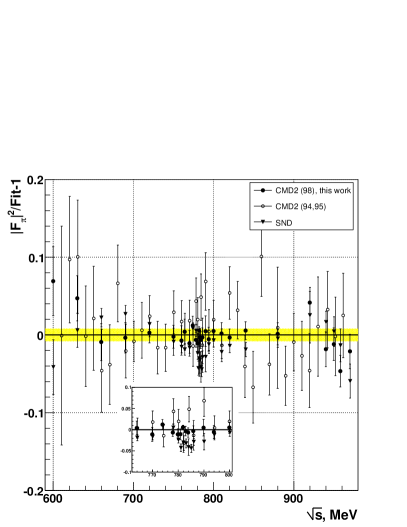
Comparison between the results of this, our previous and the recently published SND measurement [14, 15] is shown in Fig. 10(a). The average difference between the two CMD-2 results is , while between the SND and this measurement it is , where the first error is statistical and the second is the uncorrelated systematic one.
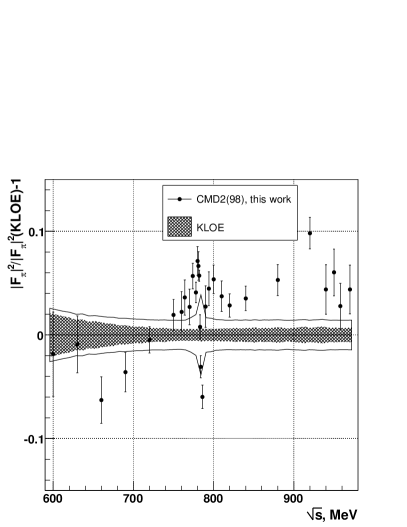
Recently the KLOE collaboration published the first measurement of the cross-section [16] based on the analysis of the distribution of the invariant mass of two pions in the final state (the initial state radiation or ISR approach). Comparison between the results of KLOE and our measurements is shown in Fig. 10(b). Only the statistical errors are shown. There is some systematic difference between the results, particularly in the energy range GeV. Its nature is not understood at the moment.
| Experiment | |
|---|---|
| CMD-2, 1994-1995 data | |
| CMD-2, 1998 data (this work) | |
| SND | |
| KLOE |
In Table 3 we compare the contributions of the above four measurements to the leading order hadronic term of the muon anomalous magnetic moment coming from the energy range 630–958 MeV. The results are obtained by direct integration of the experimental points using a trapezoidal method. All four measurements give consistent values of . In accordance with the discussion above, the CMD-2 result based on this measurement (1998 data) has better statistical error than the result based on our previous study. The combined uncertainty of the new measurement is about the same as before.
This work is partially supported by the Russian Foundation for Basic Research, grants 03-02-16477, 03-02-16280, 04-02-16217, 04-02-16223, 04-02-16434, 05-02-17169, 06-02-16156, 06-02-16445, 06-02-26859 and the U.S. National Science Foundation.
References
- [1] G. W. Bennett et al., Phys. Rev. D 73 (2006) 072003.
- [2] M. Davier and W.J. Marciano, Annu. Rev. Nucl. Part. Sci. 54 (2004) 115.
- [3] V. V. Anashin et al. , Preprint Budker INP 84-114, Novosibirsk, 1984.
- [4] E. V. Anashkin et al., ICFA Instrumentation Bulletin 5, 18 (1988).
- [5] E. V. Anashkin et al., Instrum. Exp. Tech. 49 (2006) 798 (translated from Prib. Tekh. Eksp. 49 (2006) 63).
- [6] M. N. Achasov et al., Nucl. Instrum. Meth. A 449 (2000) 125.
- [7] V. M. Aulchenko et al., JETP Lett. 84 (2006) 413 (translated from Pisma Zh. Eksp. Teor. Fiz. 84 (2006) 491).
- [8] V. M. Aulchenko et al., JETP Lett. 82 (2005) 743 (translated from Pisma Zh. Eksp. Teor. Fiz. 82 (2005) 841).
- [9] R.R. Akhmetshin et al., Phys. Lett. B 527 (2002) 161.
- [10] R.R. Akhmetshin et al., Phys. Lett. B 578 (2004) 285.
- [11] R.R. Akhmetshin et al., Phys. Lett. B 642 (2006) 203.
- [12] A.B.Arbuzov et al., Eur. Phys. J. C 46 (2006) 689.
- [13] R.R. Akhmetshin et al., Phys. Lett. B 605 (2005) 26.
- [14] M.N. Achasov et al., JETP 101 (2005) 1053 (translated from Zh. Eksp. Teor. Fiz. 128 (2005) 1201).
- [15] M.N. Achasov et al., JETP 103 (2006) 380 (translated from Zh. Eksp. Teor. Fiz. 130 (2006) 437).
- [16] A. Aloisio et al., Phys. Lett. B 606 (2005) 12.