Prospects of the measurement of oscillations with the ATLAS detector at LHC
B. Epp, E. Kneringer, H. Duer, P. Jussel
Institute of Astro- and Particle Physics, University of Innsbruck, Austria
Abstract
An estimation of the sensitivity to measure
- oscillations with the ATLAS detector
is given for the detector
geometry of “initial layout”. The reach is derived from
unbinned maximum likelihood amplitude fits using events
generated with a simplified Monte Carlo method.
I Introduction
The observed and particles are linear combinations of
the two mass eigenstates with masses and and a mass
difference of . Transitions between the two flavor eigenstates
are allowed due to non–conservation of flavor in weak–current
interactions and will occur with a frequency proportional to .
Together with the mass difference of the system, which
has already been measured with high accuracy (PDG2004 ), the measurement of is an important
ingredient for the precise determination of the side of the
CKM unitarity triangle. The direct determination of and
from and is hampered by hadronic uncertainties.
These uncertainties partially cancel in the ratio of mass differences
(1)
Using the experimentally-measured masses and a value for the factor
, which can be computed in lattice QCD, the constraint from the ratio
is more effective in limiting the position of the apex of
the unitarity triangle than the value obtained by measurements
alone.
oscillations have been observed recently at the Fermilab
Tevatron collider. Whereas the DØ collaboration is reporting a
two-sided bound at 90% CL D0 , CDF
presents the first measurement of the - oscillation
frequency finding a signal for
(stat) (sys)
at 95% CL CDF . Both results are consistent with the
prediction of the Standard Model for the upper bound of CKM01 .
The work presented here gives an updated
estimate for the sensitivity from the ATLAS experiment using Monte Carlo events of the hadronic channels and with and .
the following sections contain a brief
discussion of the event selection, analysis cuts and the most important
kinematic distributions of the candidates.
II Tools and detector layout
A detailed description of the generation, simulation, reconstruction and analysis software tools used for this study as well as a short characterization of the properties of the ATLAS Inner Detector layout is given in BsMixRome . The ATLAS B-physics trigger with various strategies for B-trigger selections is described in BTrig .
III Event selection and analysis results
In the offline analysis the meson is reconstructed from its decay products, applying kinematical cuts on tracks, kinematical and mass cuts on intermediate particles like and . A vertex fit includes mass constraints and requires that the
total momentum of the vertex points to the primary vertex and the
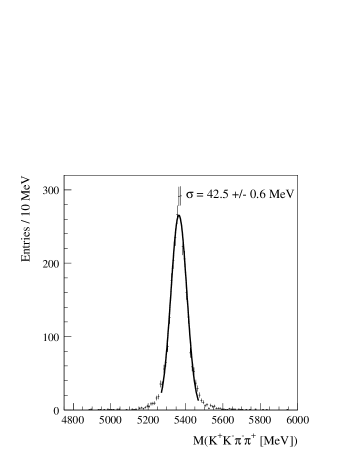
momentum of the vertex points to the vertex. To improve the purity of the sample cuts on properties of the candidates like proper time, impact parameter, transverse momentum and mass cuts are imposed. For the channel Figure 1 shows the fitted invariant mass distribution with a mass resolution of = 42.5 MeV (single Gauss fit).
Figure 1: Reconstructed invariant mass distribution
normalized to . The core of the distribution is fitted with a single Gauss function.
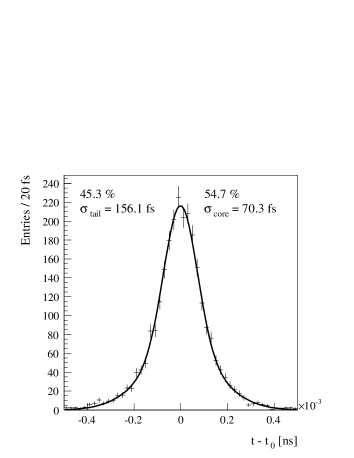
The proper time of the reconstructed candidates is computed from the reconstructed transverse decay length , the mass and the transverse momentum . Parameterized with the sum of two Gauss functions around the same mean value the widths of the two Gaussians resulting from the fit are
= (70.33.9) fs for the core fraction of 54.7% and
= (156.16.8) fs for the rest of the tail part of the
distribution.
Figure 2: Proper-time resolution normalized to for from
decays and fitted with the sum of two Gauss functions around a common mean value.
The estimation of the maximum value of measurable with ATLAS is
considering candidates
from the and channels.
The detailed analysis is done for the channel, whereas numbers for the signal and exclusive background channels are estimated extrapolations.
More details on the event selection including cut values, kinematical resolutions, expected number of events for signal and background channels can be found in BsMixRome .
IV Building of the likelihood function
The probability density to observe an initial meson () decaying at time after its creation as a
meson is given by
(2)
where , and .
For the unmixed case (an initial meson decaying as a meson at time ), the probability density is obtained by setting in Eq. 2.
Experimental effects like the wrong tag fraction and the resolution of the reconstructed proper time of the modify the probability function. Exclusive oscillating background channels and non-oscillating combinatorial background are taken into account as fractions of the probability density called pdfk.
The likelihood of the total sample is written as
(3)
The index denotes the channel and the
channel,
is the total number of events of type ,
and . See BsMixRome for detailed information on the building of the probability density functions.
V Creation of the ‘data sample’
A simplified Monte Carlo method is applied to generate a sample using
the numbers of reconstructed events and kinematic distributions obtained from the simulation studies in Ref. BsMixRome as input parameters.
signal events
oscillating with a given frequency (e.g. , which is far off the expected value for ),
together with
background events oscillating with
frequency and
combinatorial events (no oscillations) are generated according to
Eq. 2.
VI Results on measurement limits
The measurement limits are obtained applying the amplitude fit
method AFit to the ‘data sample’ generated as described in the
previous section. According to this method a new parameter, the
oscillation amplitude , is introduced in the
likelihood function by replacing the term ‘’ with ‘’ in the
probability density function given in Eq. 2. For each
value of , the new likelihood function is minimized with respect
to , keeping all other parameters fixed, and a value is obtained. One expects,
within the estimated uncertainty, for close to
its true value, and for far from the true value.
A measurement limit is defined as the value of for
which , and a sensitivity at 95% confidence
level as the value of for which .
Limits are computed with the statistical uncertainty . A detailed investigation on the systematic
uncertainties , which affects the
measurement of the oscillation, is presented in
BsMix .
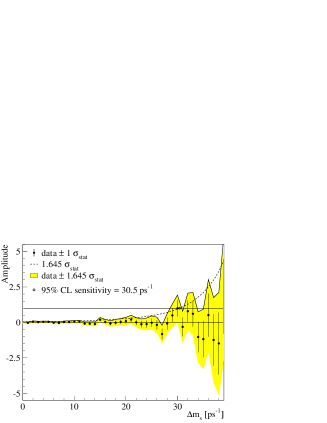
For the nominal set of parameters (as defined in the previous
sections), and an integrated luminosity of 30 the
amplitude is plotted as a
function of in Fig. 3. The 95% CL sensitivity to
measure is found to be 30.5 . This value is given by the
intersection of the dashed line, corresponding to with the horizontal line.
Figure 3: The oscillation amplitude as a function of
for an integrated luminosity of 30 for a specific
Monte Carlo experiment.
From Fig. 4, which shows the significance of the
measurement as a function of , the
measurement limit is found to be
22 .
Figure 4: The measurement significance as a function of
for an integrated luminosity of .
Lumi
limit
% CL sensitiv.
()
()
()
15
13.2
23.8
10
16.5
26.5
20
20.0
29.0
30
21.9
30.5
Table 1: The dependence of measurement limits on the
integrated luminosity.
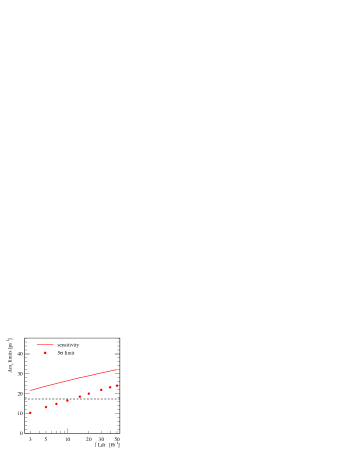
The dependence of the measurement limits on the integrated
luminosity is shown in Fig. 5, with the numerical values
given in Table 1.
Figure 5: The dependence of measurement limits on
the integrated luminosity. The dotted horizontal line gives the
CDF measurement CDF .
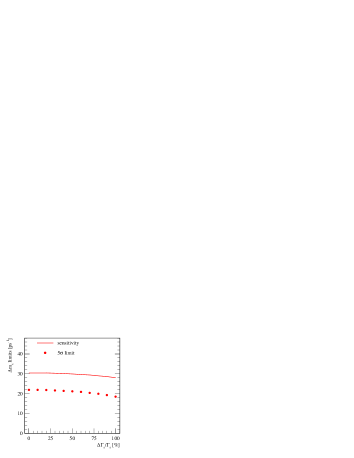
The dependence of the measurement limits on is determined
for an integrated luminosity of 30 , other parameters having their
nominal value. The is used as a fixed parameter in the
amplitude fit method. As shown in Fig. 6 no sizeable effect
is seen up to a of 50%.
Figure 6: The dependence of measurement limits on
.
VII Conclusions
In this summary the performance of the channel and extrapolated numbers for channel are used to calculate the 95% CL
exclusion and measurement limits of the oscillation
frequency as a function of the integrated luminosity collected with
the ATLAS detector. The limits are updated for the detector geometry
of “initial layout” using full Rome statistics, but only statistical
errors are taken into account. With an integrated luminosity from
10 to 20 a measurement for a range of is possible, covering
the recent results from the Tevatron collider.
The values obtained in this note for the measurement limits should be
re-evaluated, taking into account changes in the detector geometry,
especially “complete detector layout”, and the evolving simulation
and reconstruction software. and exclusive background channels will be analyzed independently and investigations
looking at the performance of other interesting - mixing
channels, which might be included in the analysis, will be carried
out.
Acknowledgements.
Work supported by Bundesministerium fuer Bildung, Wissenschaft und Kultur, Austria.
References
(1)
S. Eidelman et al. [Particle Data Group], “Review of particle physics”, Phys. Lett. B592, 1, 2004.
(2)
D0 Collaboration,
“First Direct Two-Sided Bound on the Oscillation Frequency”, Physical Review Letters 97, 021802, 2006.
(3)
CDF Collaboration,
“Measurement of the - Oscillation Frequency”, Physical Review Letters 97, 062003, 2006.
(4)
M. Battaglia, A. Buras, P. Gambino and A. Stocchi,
“Workshop on the CKM Matrix and the Unitarity Triangle”,
hep-ph/0304132 and CERN-2003-002, 2003.
(5)
B. Epp, E. Kneringer, H. Duer, P. Jussel, “Performance of the channel with the ATLAS detector and prospects for the measurement of oscillations using Rome MC simulation”, ATL-PHYS-PUB-2006-020, 2006.
(6)
J. Kirk, J. M. Baines, A. T. Watson, “ATLAS B-physics Trigger Studies using EM and Jet RoIs”, ATL-DAQ-PUB-2006-004, 2006.
(7)
B. Epp, V.M. Ghete, A. Nairz,
“Prospects for the measurement of oscillations with the ATLAS
detector at LHC”, SN-ATLAS-2002-015 2002.
(8)
H.G. Moser and A. Roussarie,
“Mathematical Methods for Oscillation Analyses”,
Nucl. Instr. Meth. A384, (491), 1997.