A study of production at energies from 2.4 to 4.0 GeV at Belle
W. T. Chen
K. Abe
K. Abe
I. Adachi
H. Aihara
D. Anipko
V. Aulchenko
A. M. Bakich
E. Barberio
A. Bay
I. Bedny
U. Bitenc
I. Bizjak
S. Blyth
A. Bondar
A. Bozek
M. Bračko
T. E. Browder
M.-C. Chang
P. Chang
Y. Chao
A. Chen
B. G. Cheon
R. Chistov
Y. Choi
Y. K. Choi
J. Dalseno
M. Dash
A. Drutskoy
S. Eidelman
D. Epifanov
A. Go
H. Ha
M. Hazumi
D. Heffernan
T. Higuchi
T. Hokuue
Y. Hoshi
W.-S. Hou
T. Iijima
A. Imoto
K. Inami
A. Ishikawa
R. Itoh
M. Iwasaki
H. Kaji
J. H. Kang
P. Kapusta
N. Katayama
H. Kawai
T. Kawasaki
H. Kichimi
H. O. Kim
Y. J. Kim
S. Korpar
P. Križan
P. Krokovny
R. Kulasiri
R. Kumar
C. C. Kuo
A. Kuzmin
Y.-J. Kwon
S. E. Lee
T. Lesiak
S.-W. Lin
D. Liventsev
G. Majumder
F. Mandl
T. Matsumoto
A. Matyja
S. McOnie
T. Medvedeva
H. Miyata
Y. Miyazaki
R. Mizuk
G. R. Moloney
T. Mori
E. Nakano
M. Nakao
H. Nakazawa
Z. Natkaniec
S. Nishida
O. Nitoh
T. Nozaki
S. Ogawa
T. Ohshima
S. Okuno
S. L. Olsen
Y. Onuki
H. Ozaki
P. Pakhlov
G. Pakhlova
H. Palka
C. W. Park
R. Pestotnik
L. E. Piilonen
H. Sahoo
Y. Sakai
N. Satoyama
T. Schietinger
O. Schneider
J. Schümann
K. Senyo
M. E. Sevior
M. Shapkin
H. Shibuya
B. Shwartz
J. B. Singh
A. Sokolov
A. Somov
N. Soni
S. Stanič
M. Starič
H. Stoeck
S. Y. Suzuki
F. Takasaki
K. Tamai
M. Tanaka
G. N. Taylor
Y. Teramoto
X. C. Tian
I. Tikhomirov
T. Tsukamoto
S. Uehara
K. Ueno
T. Uglov
Y. Unno
S. Uno
Y. Usov
G. Varner
K. Vervink
S. Villa
C. C. Wang
C. H. Wang
M.-Z. Wang
Y. Watanabe
E. Won
B. D. Yabsley
A. Yamaguchi
Y. Yamashita
M. Yamauchi
C. C. Zhang
Z. P. Zhang
V. Zhilich
A. Zupanc
Budker Institute of Nuclear Physics, Novosibirsk, Russia
Chiba University, Chiba, Japan
Hanyang University, Seoul
University of Cincinnati, Cincinnati, OH, USA
Department of Physics, Fu Jen Catholic University, Taipei, Taiwan
The Graduate University for Advanced Studies, Hayama, Japan
University of Hawaii, Honolulu, HI, USA
High Energy Accelerator Research Organization (KEK), Tsukuba, Japan
Institute of High Energy Physics, Chinese Academy of Sciences, Beijing, PR China
Institute for High Energy Physics, Protvino, Russia
Institute of High Energy Physics, Vienna, Austria
Institute for Theoretical and Experimental Physics, Moscow, Russia
J. Stefan Institute, Ljubljana, Slovenia
Kanagawa University, Yokohama, Japan
Korea University, Seoul, South Korea
Swiss Federal Institute of Technology of Lausanne, EPFL, Lausanne, Switzerland
University of Ljubljana, Ljubljana, Slovenia
University of Maribor, Maribor, Slovenia
University of Melbourne, Victoria, Australia
Nagoya University, Nagoya, Japan
Nara Women’s University, Nara, Japan
National Central University, Chung-li, Taiwan
National United University, Miao Li, Taiwan
Department of Physics, National Taiwan University, Taipei, Taiwan
H. Niewodniczanski Institute of Nuclear Physics, Krakow, Poland
Nippon Dental University, Niigata, Japan
Niigata University, Niigata, Japan
University of Nova Gorica, Nova Gorica, Slovenia
Osaka City University, Osaka, Japan
Osaka University, Osaka, Japan
Panjab University, Chandigarh, India
Peking University, Beijing, PR China
RIKEN BNL Research Center, Brookhaven, NY, USA
University of Science and Technology of China, Hefei, PR China
Seoul National University, Seoul, South Korea
Shinshu University, Nagano, Japan
Sungkyunkwan University, Suwon, South Korea
University of Sydney, Sydney, NSW, Australia
Tata Institute of Fundamental Research, Bombay, India
Toho University, Funabashi, Japan
Tohoku Gakuin University, Tagajo, Japan
Tohoku University, Sendai, Japan
Department of Physics, University of Tokyo, Tokyo, Japan
Tokyo Institute of Technology, Tokyo, Japan
Tokyo Metropolitan University, Tokyo, Japan
Tokyo University of Agriculture and Technology, Tokyo, Japan
Virginia Polytechnic Institute and State University, Blacksburg, VA, USA
Yonsei University, Seoul, South Korea
Abstract
production in two-photon collisions has been studied
using a 397.6 fb-1 data sample
collected with the Belle detector at the KEKB collider.
For the first time the cross sections are measured in the two-photon
center-of-mass energy range between 2.4 and GeV and
angular range .
Combining the results with measurements of from Belle,
we observe that the cross section ratio
decreases from 0.13 to 0.01 with increasing energy.
Signals for the and charmonium states are also
observed.
Exclusive processes with hadronic final states in two-photon collision are an excellent probe
to test various model calculations
motivated by perturbative and non-perturbative QCD.
As shown by Brodsky and Lepage (BL) [1], at sufficiently
large two-photon center-of-mass energy and momentum transfer from the initial photon to the produced meson ,
the leading term of the amplitude for the process , where denotes a meson,
can be expressed as a hard scattering amplitude for
times the leading term meson electromagnetic
form factor.
For mesons with zero helicity their calculation
gives the following dependence on
and scattering angle :
(1)
where and are the quark charges
(i.e., mesons have charges ), and explicit forms
of the leading term meson form factor
and the function can be found in Refs. [1, 2].
Eq. (1) implies that the angular distribution of neutral meson pairs,
unlike that for charged meson pairs which is dominated by terms,
is directly determined by the shape of and the value of .
Later, Benayoun and Chernyak (BC) [2] used a factorization hypothesis
similar to the BL calculation
but further improved the treatment of the effects of SU(3) symmetry breaking;
their predictions appeared to be in good agreement with the subsequent
measurements of
and [3, 4].
Recently, Diehl, Kroll and Vogt (DKV) [5] considered the
consequences of the assumption that at intermediate energies the
amplitudes for the process are dominated by so-called
handbag contributions. The handbag amplitude is expressed as the product of
an amplitude for the hard
subprocess times an unknown form factor describing
the soft transition from the to the meson pair.
In [5] the differential cross section is given by
(2)
where the meson annihilation form factor is
not calculated in Ref. [5] but is instead obtained by fitting the data;
the magnitude of for different mesons can be linked by using SU(3) and isospin symmetry.
The validity of this approach has recently been criticized in
Ref. [6].
Earlier, the Belle Collaboration performed a high-statistics measurement
of the cross sections for the processes
and [4] in the (=) range 2.4 GeV 4.1 GeV.
Analysis of the data showed that in this range
the dependence of the cross section
is consistent with that predicted by the leading term
QCD calculations [1, 2].
Here we report a measurement of the cross section for at
and with a data sample
of 397.6 fb-1 collected at or near the resonance,
accumulated with the Belle detector [7]
at the KEKB asymmetric-energy collider [8].
This measurement can provide important information
that complements previous studies and sheds light on
how the two-photon mass and angular
distributions of such cross sections depend on the flavor of the produced mesons.
The Belle detector is a large-solid-angle magnetic spectrometer.
Momenta of charged tracks are measured with a central drift
chamber (CDC), located in a uniform 1.5 T magnetic field
which surrounds the interaction point (IP) and subtends the polar
angle range ,
where is a scattering angle in the laboratory frame.
The trajectories of the charged tracks near the interaction point
are provided by the CDC and the silicon vertex detector (SVD).
Energy measurement of electromagnetically interacting
particles is performed in an electromagnetic calorimeter (ECL)
made up of CsI(Tl) crystals. The detector is described in detail
elsewhere [7].
2 Event Selection
Exclusive pairs
are produced in quasi-real two-photon collisions
through the process ,
where the scattered and are lost down the beampipe,
and only the two mesons are detected.
We select candidate events in two stages. At stage I the
following requirements are applied:
•
exactly four charged tracks with zero net charge of which at least two
have GeV/, cm, cm, where is the
transverse momentum in the laboratory frame and and are the
radial and axial coordinates of the point of closest approach of the track to the nominal IP,
respectively, and the -axis is the direction opposite
to the positron beam axis;
•
the sum of the magnitudes of the momenta of all tracks, ,
and the total energy deposit in the ECL are less than 6 and
6 , respectively;
•
the invariant mass of these four tracks is less than 4.5 ,
and the missing mass squared of the event is greater than 2 ;
At stage II pairs of oppositely charged tracks without particle
identification
are used to reconstruct decays.
To distinguish events from other four-track background sources
such as , , and
that have no candidates,
two different sets of selections are applied to the
candidates with high (low) momentum, i.e. with momentum 1.5 (0.5-1.5 ):
is required to be larger than 0.02 (0.03) cm for both charged tracks;
the vertex is required to be displaced from the IP by a
minimum transverse distance of 0.22 (0.08) cm.
The mismatch in the direction at the vertex point for the
tracks must be less than 2.4 (1.8) cm;
the direction of the pion-pair momentum must also agree with the
direction from the IP to the vertex to within 0.03 (0.1) rad.
To evaluate the background and calculate efficiencies, we use
a Monte Carlo simulation (MC) of the detector response based on
GEANT3 [9]. The TREPS code [10] is used for
event generation and the background , event generation.
From MC simulation,
with the described selection above the signal efficiency can
reach 80% while the background is reduced by a factor of .
Thus the four-track backgrounds can be eliminated efficiently after
our event selection.
The resolution in the reconstructed mass is 4 MeV/c2,
and only candidates for which MeV/c2
are selected.
Finally, we require that the sum of the transverse momentum vectors of all tracks
in the c.m. frame of the beams,
, be smaller than 0.1 (momentum balance).
is calculated from the invariant mass of the pair,
and is obtained from the scattering angle with respect to
the incident axis of the electron in the c.m. frame,
which approximates the direction of the incoming photon.
Figure 1 shows the
invariant mass spectra after stage I
and stage II selection.
After applying the above selections,
we find 981 candidates in the range 2.4 4.0
and .
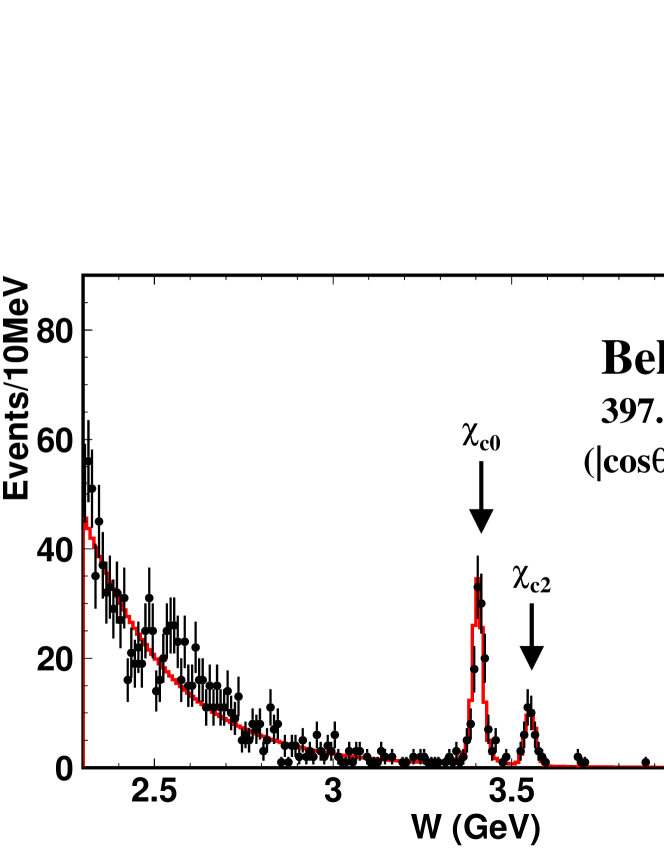
The distribution is shown in Fig. 2.
Clear signals for the and resonances are observed.
Figure 1: The invariant mass spectrum for candidates
after stage I (dotted histogram) and stage II (points with error bars) selection.
Here events are selected in the range =2.3-4.5 GeV and GeV/,
where and are calculated by assuming all tracks are charged pions. Figure 2: mass spectrum before background subtraction.
The curves show the fit result described later in the section on
resonances.
3 Background subtraction
The background contamination from events where additional particles
accompany the two detected mesons
– so-called non-exclusive backgrounds – should be also estimated.
Because of the available phase space, such events are expected to have
a distribution that is close to zero at
=0 and increases with .
This feature is verified in the (which is the dominant background) MC and data sample,
where the MC sample is generated by using GGLU code [11].
We assume that the distribution of the
non-exclusive background can be parameterized by
constrained by .
We fit the function to the difference between data and
signal MC distributions which is normalized to the data below 0.03 GeV/
where the background contribution
is negligibly small (Fig. 3).
Using the data sample with 0.5-1.0 GeV/
we verify that there is no dependence of the shape.
Using the fit results,
the estimated background, which is
, , and for
=2.4-2.6 GeV, 2.6-2.8 GeV, 2.8-3.3 GeV, respectively,
is subtracted in each bin (the errors are statistical only).
For W=3.6-4.0 GeV, the background is set to zero since
the data sample is too small to apply the procedures described above.
Finally, 952 signal events remain in the signal region
GeV/ after background subtraction.
Figure 3: distribution for candidates.
The dotted histogram and points with error bars indicate the
distribution of events
before and after background subtraction, respectively.
The dot-dashed line is the background distribution, which is
obtained from the fit to the difference between MC and data.
The solid curve shows the signal MC
distribution, which is normalized to the number of signal candidates in the three
leftmost bins.
The arrow indicates the upper boundary of the requirement
for the signal.
4 Cross sections of the process
for 2.4 4.0
The differential cross section for two-photon production of the final state
in electron-positron collisions is given by
(3)
where and denote the number of signal events
after background subtraction and
the product of detection and trigger efficiencies, respectively.
The integrated luminosity of this experiment, ,
is 397.6 fb-1 and is determined with a systematic
uncertainty of 1.4%.
The luminosity function , as a function of
, is defined by
(4)
The efficiencies are obtained from MC using
the TREPS code [10] for event generation. The TREPS
code is also used for the luminosity function determination.
Trigger efficiencies are determined from the trigger simulator.
The typical values of the detection and trigger efficiency
are 5-19% and 90-95%, respectively,
and grow with increasing and decreasing .
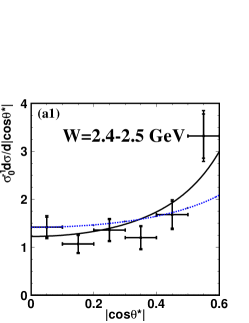
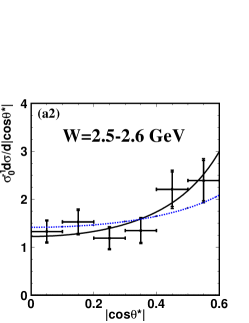
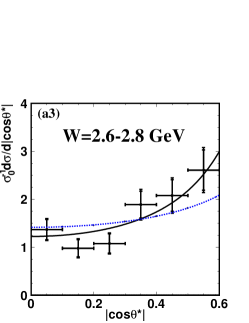
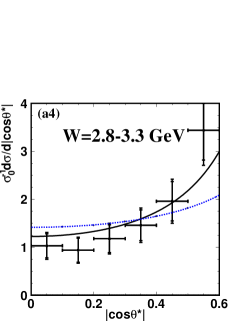
Differential cross sections normalized to the cross section
integrated over the range
() in different bins are shown
in Fig. 4(a).
The angular distributions are consistent
with both BC and DKV predictions up to .
The angular distributions, ,
in the and regions
( MeV/, MeV/) shown in
Figs. 4(b,c) are in good agreement with those expected for
the decays of the spin zero and two particles.
The total cross section as a function of is shown
in Fig. 5(a) and listed in Table 4.
The values of the total cross section for the range, =3.3-3.6 ,
where the contribution from charmonium states is large, are omitted.
Figure 4: (a1-a4) The angular distribution of the cross section,
, in different ranges.
The solid curves are , which is the prediction
of DKV. The dotted curves are the prediction of BC.
(b) The angular distribution in the region;
the dotted curve shows a flat distribution (=0);
(c) The angular distribution in the region;
the dotted curve shows the helicity 2 distribution
().
The errors indicated by short ticks are statistical only.
()
, nb
2.4-2.5
2.5-2.6
2.6-2.7
2.7-2.8
2.8-2.9
2.9-3.0
3.0-3.1
3.1-3.2
3.2-3.3
3.6-4.0
( at 90% CL)
Signal yields () and total cross
sections () for the process
in the angular range . The first
and second errors are statistical and systematic, respectively.
5 Systematic errors
The dominant systematic errors are summarized in Table 5.
We assign 4% to the uncertainty from trigger,
which is determined by comparing the trigger efficiencies in the data sample and trigger simulation.
The uncertainty of reconstruction efficiency is estimated by
comparing the ratio of the number of events with both mesons
satisfying the selection requirements and that with only one
satisfying the requirements in data and MC samples.
We take the efficiency difference between the data and MC sample, which is 4.4% for one .
The uncertainties in the background subtraction are estimated by
fitting the background shape in the distributions using second-order
polynomial functions and comparing the background fractions obtained
to those described above.
The differences between the two calculations are taken as the corresponding
systematic error in each energy range and are
2.0%, 2.0%, and % for =2.4-2.6 GeV, 2.6-2.8 GeV,
2.8-3.3 GeV, respectively.
For =3.6-4.0 GeV, we conservatively assign the number of observed events as the systematic
error in the background.
The 3.4-5.0% systematic error for the luminosity function in
the range =2.4-4.0 GeV in Ref. [10] is determined
from comparison of the kinematic distributions for the
two-photon system in events generated with
TREPS to those from a QED calculation that includes
all order diagrams [12].
The total -dependent systematic error is (8.5-12.1).
Source
Error,
Trigger efficiency
4
Luminosity function
3.4-5.0
Background (for non-resonant analysis)
2.0-8.4
reconstruction (per )
4.4
Integrated luminosity
1.4
Total
8.5-12.1
Summary of systematic errors
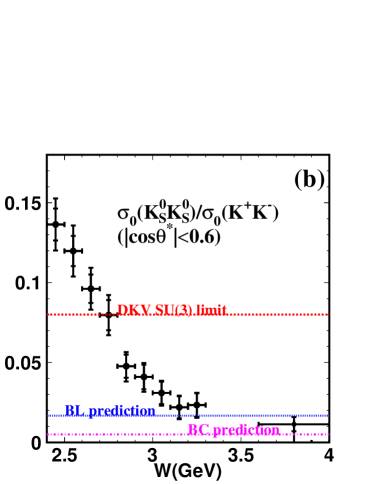
Figure 5: (a) Total cross sections for in the c.m.
angular region .
Here is the -dependence ().
(b) The ratio versus
in ,
where the data are taken from the Belle measurement [4].
The dotted line is the DKV prediction with the flavor symmetry assumption;
the dashed and dashed-dotted lines are the BL and BC predictions,
respectively.
The two sets of error bars show the
statistical and combined statistical+systematic errors, respectively.
6 Discussion
The leading term in QCD calculations [1, 2] predicts a
dependence of the cross sections .
However, the fit to the data in the range =2.4-4.0 GeV gives
a -dependence () of ,
where the first error is statistical and the second is systematic.
We conservatively estimate the systematic error on by artificially
deforming the measured cross section values
assuming that the systematic errors are strongly correlated
point-to-point, as in Ref. [4]:
we shift the values at the two end bins by
and times the systematic error, respectively,
whereas each intermediate point is moved so that its shift follows a
linear function of times its systematic error.
The average of the observed deviations in from its original value is
taken as a final systematic error.
The value of indicates that, unlike and
[4],
the current values of are not yet large enough to neglect power
corrections in ,
which are not taken into account in the BL and BC predictions.
The ratio
shown in Fig. 5(b)
decreases from 0.13 to 0.01 with increasing .
This energy dependence is inconsistent with the DKV prediction
that the ratio should be in the SU(3) symmetry limit.
Furthermore, it is difficult to explain the experimental result with
the handbag model even if the effect of SU(3)-symmetry
breaking is taken into account [6, 13].
This indicates that the handbag model needs significant corrections.
Since the experimental values of the ratio
approach the BL and BC
predictions at the highest measured energies GeV,
the leading term QCD calculations [1, 2] may become
applicable for at not much larger values of .
7 The two-photon decay width of resonances
Measurements of can also provide more precise results [14]
for the two-photon decay widths and branching fractions of
the charmonium states since the continuum background is strongly suppressed.
By fitting the continuum distribution to an exponential distribution and
parameterizing the charmonium peaks with a Breit-Wigner function for the
and Gaussian function for the narrow
with the masses and widths floating,
and events are observed.
The masses and widths obtained from the fit taking into account
the detector resolution
are consistent with the PDG values.
The () statistical significance is
(), where is a standard deviation.
The statistical significance of the signals is obtained from the
values,
where is the likelihood without (with) the signal contribution,
with the joint estimation of the three parameters (mass, width, and yield are determined simultaneously).
The two-photon decay width of the or
can be obtained using the formula
(5)
where and are the yield and mass of the charmonium
state, respectively.
The quantity denotes the product of the detector efficiency,
trigger efficiency, and
angular acceptance for the resonant decays.
In addition to the sources of systematic errors listed in
Table 5,
the errors in the yield are 2.3 and 2.4 for the and
, respectively.
For events we assume a pure helicity 2 state in MC
generation following the previous measurement [15] and
theoretical expectations [16, 17].
The directly measured values of the product
are eV for the and
eV for the .
Using the results of our previous measurement of and
production in collisions [4],
we determine the ratios
and
for the and , in which some common systematic
errors cancel. Here ,
and are the branching fractions for the
decay to the corresponding final state.
Using the world-average values of the branching fractions
and [14],
from the products of the widths and branching fractions given above
we can extract the values of the two-photon
width that are shown in Table 7.
The notation indicates the systematic uncertainty from the
branching fraction of .
It can be seen that for both the and the value
of is compatible with 0.5
as expected from isospin symmetry.
The values of the two-photon widths of the charmonia
are consistent with those obtained from their total width and the
branching fractions for decay to two photons in Ref. [14].
Resonance
, eV
, keV
The products of the two-photon width and the branching fraction,
ratios of the branching fractions,
and two-photon widths for the and .
The notation indicates the systematic uncertainty from the branching
fraction of
8 Conclusion
Using a 397.6 fb-1 data sample
accumulated with the Belle detector at KEKB,
the cross sections of the process have been
measured for the first time in the range from 2.4 GeV to 4.0 GeV
with .
The overall -dependent systematic uncertainty is 8.5-12.1.
The measured -dependence () of is
from a fit to the data with =2.4-4.0 ,
indicating that, unlike and ,
the values up to 3.3 GeV are not sufficiently
large to apply the leading term BL and BC predictions to .
The angular distribution in the range is consistent with both BC and DKV.
The ratio
decreases rapidly from 0.13 to 0.01 with increasing in contrast to the expectation from the DKV model.
Since the measured values of the cross section ratio approach the BL
and BC predictions in the highest energy bin, 3.6-4.0 GeV,
this may indicate that the leading term QCD calculations for are already
applicable at values larger than GeV.
In addition, the products of the two-photon decay width and branching ratio
to for the and
are found to be eV and eV.
9 Acknowledgments
We are grateful to S. J. Brodsky, V.L. Chernyak, M. Diehl,
G. Duplančić, P. Kroll, H.-N. Li, K. Odagiri, and R.-C. Verma
for fruitful discussions.
We thank the KEKB group for the excellent operation of the
accelerator, the KEK cryogenics group for the efficient
operation of the solenoid, and the KEK computer group and
the National Institute of Informatics for valuable computing
and Super-SINET network support. We acknowledge support from
the Ministry of Education, Culture, Sports, Science, and
Technology of Japan and the Japan Society for the Promotion
of Science; the Australian Research Council and the
Australian Department of Education, Science and Training;
the National Science Foundation of China and the Knowledge
Innovation Program of the Chinese Academy of Sciences under
contract No. 10575109 and IHEP-U-503; the Department of
Science and Technology of India;
the BK21 program of the Ministry of Education of Korea,
the CHEP SRC program and Basic Research program
(grant No. R01-2005-000-10089-0) of the Korea Science and
Engineering Foundation, and the Pure Basic Research Group
program of the Korea Research Foundation;
the Polish State Committee for Scientific Research;
the Ministry of Education and Science of the Russian
Federation and the Russian Federal Agency for Atomic Energy;
the Slovenian Research Agency; the Swiss
National Science Foundation; the National Science Council
(under Grant No. NSC 94-2112-M-008-027)
and the Ministry of Education of Taiwan; and the U.S. Department of Energy.
References
[1]
S.J. Brodsky and G.P. Lepage, Phys. Rev. D 24 (1981) 1808.
[2]
M. Benayoun and V.L. Chernyak, Nucl. Phys. B 329 (1990) 209.
[3]
A. Heister et al. (ALEPH Collab.), Phys. Lett. B 569 (2003) 140.
[4]
H. Nakazawa et al. (Belle Collab.), Phys. Lett. B 615 (2005) 39.
[5]
M. Diehl, P. Kroll, and C. Vogt, Phys. Lett. B 532 (2002) 99.
[6]
V.L. Chernyak, Phys. Lett. B 640 (2006) 246.
[7]
A. Abashian et al. (Belle Collab.), Nucl. Instr. and Meth.
A 479 (2002) 117.
[8]
S. Kurokawa and E. Kikutani, Nucl. Instr. and. Meth. A 499 (2003) 1,
and other papers included in this volume.
[9]
The detector response is simulated with GEANT, R. Brun et al.,
GEANT 3.21, CERN Report DD/EE/84-1, 1984.
[10]
S. Uehara, KEK Report 96-11 (July 1996).
[11]
egpc v207, L3 program library, 1999, converted to the Belle configuration by S. Hou, 2000.
[12]
F.A. Berends, P.H. Daverveldt, R. Kleiss,
Nucl. Phys. B 253 (1985) 441.
[13]
M. Diehl, ”Wide-angle processes”, talk at Int. Workshop ”GPD2006”,
June 6, 2006, Trento, Italy.
[14]
W.-M. Yao et al. (Particle Data Group),
J. Phys. G 33 (2006) 1.
[15] K. Abe et al. (Belle Collab.), Phys. Lett. B
540 (2002) 33.
[16] M. Poppe, Int. J. Mod. Phys. A 1 (1986) 545.
[17] H. Krasemann and J.A.M. Vermaseren, Nucl. Phys. B
184 (1981) 269.
![[Uncaptioned image]](/html/hep-ex/0609042/assets/x1.png)