PHENIX Collaboration
Measurement of Single Muons at Forward Rapidity in Collisions at GeV and Implications for Charm Production
Abstract
Muon production at forward rapidity () has been measured by the PHENIX experiment over the transverse momentum range GeV/c in GeV collisions at the Relativistic Heavy Ion Collider. After statistically subtracting contributions from light hadron decays an excess remains which is attributed to the semileptonic decays of hadrons carrying heavy flavor, i.e. charm quarks or, at high , bottom quarks. The resulting muon spectrum from heavy flavor decays is compared to PYTHIA and a next-to-leading order perturbative QCD calculation. PYTHIA is used to determine the charm quark spectrum that would produce the observed muon excess. The corresponding differential cross section for charm quark production at forward rapidity is determined to be mb.
pacs:
13.85.Qk, 13.20.Fc, 13.20.He, 25.75.DwI Introduction
Measurements of heavy quark production in proton-proton () interactions at collider energies serve as important tests for perturbative Quantum ChromoDynamics (pQCD). Bottom production at the Tevatron collider ( and 1.96 TeV/c) Abbott et al. (2000); D. Acosta et al. (2005) is reasonably well described by a recent Fixed Order Next-to-Leading Logarithm (FONLL) calculation M. Cacciari (2004); M. Cacciari and M. Greco and P. Nason (1998); M.L. Mangano (2004). Charm production at FNAL, which has only been measured at relatively high ( GeV/c), is 50% higher than the FONLL prediction D. Acosta et al. (2003). However, theoretical and experimental uncertainties are large, such that significant disagreement between theory and data cannot be claimed.
Measurements at Brookhaven National Laboratory’s Relativistic Heavy Ion Collider (RHIC), by both the PHENIX and STAR experiments, have provided a wealth of information on mid-rapidity open charm production in collisions at GeV () and GeV (, , and ) down to GeV/c. Semileptonic decay of produced charm quarks is the primary source of high leptons after contributions from known (light hadron) sources are subtracted. Both PHENIX Adcox et al. (2002); S.S. Adler et al. (2005a, 2006a); S. Kelly, for the PHENIX Collaboration (2004); S.S. Adler et al. (2006b); S. Butsyk, for the PHENIX Collaboration (2005); A. Adare et al. (2006); S.S. Adler et al. (2005b); S. Sakai, for the PHENIX Collaboration (2005); Adare et al. (2006) and STAR Adams et al. (2005); B.I. Abelev et al. (2006) have made statistical measurements of charm production via single-electron spectra. STAR has also made a direct measurement of charm production through reconstruction of hadronic decay modes of mesons Adams et al. (2005). In collisions at GeV PHENIX finds mb A. Adare et al. (2006). STAR finds a somewhat higher central value, mb Adams et al. (2005), but the two measurements are consistent within the stated errors. Both measurements are noticeably (2-4) higher than PYTHIA (a leading order pQCD event generator) (T. Sjöstrand et al., 2001a, see experimental references for specific parameter sets) and FONLL Cacciari et al. (2005). Again, quantitative disagreement cannot be established with current experimental and theoretical errors. However, we note that there is some debate about whether charm quarks are heavy enough to be reliably treated by pQCD M.L. Mangano (1993).
Such measurements also serve as an important baseline for charm production in proton-nucleus or deuteron-nucleus ( or ), and nucleus-nucleus () collisions Vogt (2002, 2003); Cassing et al. (2001); E.L. Bratkovskaya et al. (2003). In the absence of any nuclear effects, charm production (since it is a point-like process) is expected to scale with the number of binary nucleon-nucleon collisions (), which depends on the impact parameter of the nuclear collision and can be obtained from a Glauber calculation Wong (1994). The degree of scaling for any given centrality bin is quantified by the nuclear modification factor:
| (1) |
Deviations from this scaling () in or collisions quantify cold nuclear matter effects (such as initial state energy loss M.B. Johnson et al. (2001); G.T. Bodwin et al. (1981); G.T. Bodwin (1985); G.T. Bodwin et al. (1989); B.Z. Kopeliovich and Niedermayer (1984); Gavin and Milana (1992), and shadowing Guzey et al. (2004); Y.L. Dokshitzer and D.E. Kharzeev (2001); McLerran and Venugopalan (1994a, b); Ashman et al. (1988)). Any such deviation must be understood so that in collisions contributions to from hot nuclear matter effects (such as in-medium energy loss (Baier et al., 2000, and references therein)) and cold nuclear matter effects can be disentangled. In collisions both PHENIX and STAR find little or no effect of cold nuclear matter on charm production ( over the measured lepton S. Kelly, for the PHENIX Collaboration (2004); Adams et al. (2005)). This contrasts with measurements of open charm in collisions: although the total charm production appears to scale with S.S. Adler et al. (2005a), there is a strong suppression of lepton spectra for GeV/c that increases with centrality S.S. Adler et al. (2006b); S. Butsyk, for the PHENIX Collaboration (2005); B.I. Abelev et al. (2006). Furthermore the elliptical flow of non-photonic single electrons, as measured by PHENIX in collisions S.S. Adler et al. (2005b); S. Sakai, for the PHENIX Collaboration (2005); Adare et al. (2006), implies that the charm quarks interact strongly with the created medium.
Finally, since the initial formation of open and closed charm are both sensitive to initial gluon densities J.A. Appel (1992); B. Müller and X.N. Wang (1992), open charm production serves as an appropriate normalization for production. The production of mesons is expected to be sensitive to the production of a quark gluon plasma (QGP), should one be formed in collisions Matsui and Satz (1986); H. Satz (2006); R.L. Thews and M.L. Mangano (2006); L. Grandchamp, R. Rapp and G.E. Brown (2004); A. Andronic et al. (2003); A.P. Kostyuk et al. (2003). In order to understand production differences in collisions compared to and collisions it is important to take into account any differences in the charm quark production in each of the different systems.
Until now, open charm measurements at RHIC have been limited to mid-rapidity. Measurements at forward rapidity are interesting for a variety of reasons. First is the need to constrain theoretical calculations over a wide kinematic range. The importance of this is demonstrated by the D0 measurement of bottom production at large rapidity ( TeV, GeV/c, ), as deduced from the production of high muons Abbott et al. (2000). Significant theoretical improvements resulted from the effort to reduce what was, initially, a discrepancy between theory and experiment that increased with increasing rapidity M.L. Mangano (2004). Second, significant cold nuclear effects have been seen in RHIC collisions at forward rapidity. PHENIX S.S. Adler et al. (2005c), BRAHMS Arsene et al. (2005, 2004), and STAR Adams et al. (2006) have all measured light hadron production in collisions at forward rapidity and have found significant deviations from . It will be interesting to see whether charm production follows a similar pattern. Finally, open charm production at forward rapidity needs to be understood to fully interpret PHENIX measurements at forward rapidity S.S. Adler et al. (2004, 2006c); H. Pereira Da Costa, for the PHENIX Collaboration (2005); Cassing et al. (2001); E.L. Bratkovskaya et al. (2003).
In this paper we report on the measurement of muon production at forward rapidity (), in the range GeV/c, in GeV collisions by the PHENIX experiment. The upper limit of the range is determined by available statistics. The vertex-independent muon yield is statistically extracted by calculating and subtracting contributions from light mesons (’s and ’s) which decay into a muon, and hadrons which penetrate through the muon arm absorber material. In the absence of new physics, and in the range measured in this analysis, such muons come dominantly from the decay of hadrons containing a charm quark (with small contributions from decays of hadrons containing a bottom quark and decays of light-vector mesons). PYTHIA is used to determine the charm quark spectrum that would produce the observed vertex-independent muon spectrum, and from this we obtain the differential cross section of charm quark production at forward rapidity.
The remainder of this paper is organized as follows: In Section II we describe the PHENIX experimental apparatus, with special emphasis on the muon arm detectors. In Section III we describe the methodology used to extract the vertex-independent muon signal. This section includes details on the run, event and track selection criteria; values obtained for contributions to the muon yield from abundant light hadrons, which are subtracted to obtain the vertex-independent muon yield; and details on the systematic error analysis. In Section IV we extract the differential cross section for charm production at , integrated over . Finally, in Section V we compare to other measurements, draw conclusions, and discuss the prospects for such measurements with improved data sets currently under analysis.
II The PHENIX Experiment
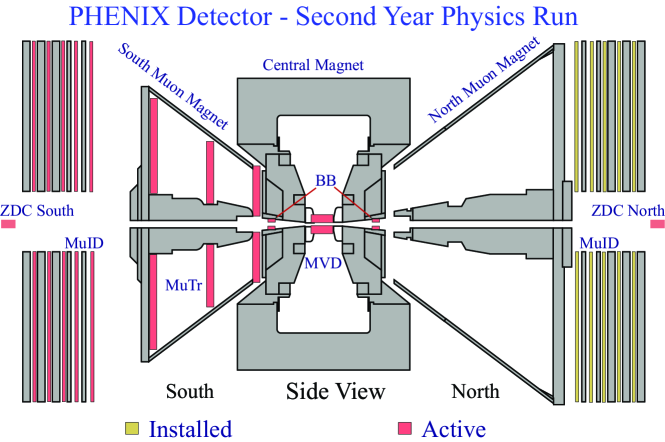
The PHENIX experiment Adcox et al. (2003), shown in Figure 1, is a large multipurpose set of detectors optimized for measuring relatively rare electromagnetic probes (photons, muons, and electrons) of the spin structure of the proton and of the hot dense matter created in ultrarelativistic heavy ion collisions. The data acquisition system and multilevel triggers are designed to handle the very different challenges presented by collisions (relatively small events at very high rates) and collisions (very large events at relatively low rates) with little or no deadtime S.S. Adler et al. (2003a); S.S. Adler et al. (2003b). Event characterization devices, such as the Beam-Beam Counters M. Allen et al. (2003) used in this analysis, provide information on the vertex position, start time, and centrality of the collision. The two muon arms cover in pseudorapidity and in azimuth. The two central arms, which each cover and , are not used in this analysis.
The Beam-Beam Counters (BBCs) M. Allen et al. (2003) each consist of 64 quartz radiators instrumented with mesh dynode PMTs and arranged in a cylinder coaxial with the beam. The BBCs are placed on either side of the collision vertex and cover . Each channel has a dynamic range extending to 30 MIPs. The BBCs measure the arrival times of particles on both sides of the collision vertex, and . From the average of these times we determine the event start time. From their difference we obtain the position of the vertex along the beam direction, . The BBCs also provide the minimum bias interaction trigger, which requires that there be at least one hit in each BBC and that cm.
The muon arms Akikawa et al. (2003) are coaxial with the beam on opposite sides of the collision vertex. By convention the arm on the South (North) end of the interaction region is assigned negative (positive) coordinates and rapidity. For the 2001/2 run period, in which the data for this paper were collected, only the South muon arm was operational. Each muon arm is comprised of a Muon Tracker (MuTR) and a Muon Identifier (MuID). The MuTR makes an accurate measurement of particle momenta. The MuID allows coarse resolution track reconstruction through a significant amount of steel absorber. Together the muon arm detectors provide significant pion rejection (, increasing with decreasing momentum) through a momentum/penetration-depth match.
Before ever reaching the MuTR detectors a particle must pass through the pre-MuTR absorber: 20 cm of copper (the nosecone) plus 60 cm of iron (part of the MuTR magnet). The nominal nuclear interaction lengths of iron and copper are cm and cm (although this varies with particle species and energy, see Section III.6). Therefore the pre-MuTR absorber presents a total thickness of , where is the polar angle of a particle’s trajectory. This absorber greatly reduces the MuTR occupancy and provides the first level of pion rejection.
Each MuTR arm consists of three stations of cathode strip chambers installed in an eight-sided conical magnet S.H. Aronson et al. (2003). The radial magnetic field ( Tm at 15 degrees, ) bends particles in the azimuthal direction. Each station occupies a plane perpendicular to the beam axis and consists of multiple ionization gaps (3 gaps for the two stations closest to the collision vertex, 2 gaps for the last station) which have their charge imaged on two cathode strip planes oriented with a small stereo angle to provide two-dimensional information. An ionizing particle typically fires three adjacent strips in each orientation. A fit to the charge distribution on adjacent strips provides a position measurement with a resolution of m in the bend direction. The MuTR achieves a momentum resolution of over the analyzed kinematic range. The resolution is approximately independent of momentum due to the significant contribution from energy loss fluctuations in the pre-MuTR absorber, which falls as , and which counters the more familiar linear momentum dependence seen for particles tracked through a “thin” detector.
Each MuID arm consists of five steel absorber plates interleaved with Iarocci tubes (operated in proportional mode) and specialized shielding to reduce backgrounds not originating from the collision vertex. Gaps are labeled 0–4 proceeding downstream from the collision point.
The Iarocci tubes, which are between 2.5 and 5 m in length, have eight 1 cm2 square cells, each consisting of a three-sided ground electrode and an anode wire, mounted inside a PVC gas enclosure. A readout channel (“two-pack”) is formed by wire-ORing the 16 anode wires of two tubes which are mounted in planes perpendicular to the beam axis and staggered by half of a cell width (0.5 cm). This provides redundancy, eliminates geometric inefficiency due to the cell walls, and reduces the maximum drift time for charge collection. Digital readout of the two-pack signals provides a coarse one-dimensional hit position (). The tubes in each gap are mounted in six individual panels, each of which contains two layers of two-packs (horizontally and vertically oriented), thus providing two-dimensional information.
The first MuID absorber plate (thickness = 20 cm - South; 30 cm - North) also serves as the return yoke of the MuTR magnet. Successive plates (identical for the two arms) are 10, 10, 20 and 20 cm thick, thus totaling () for the South (North) arm. Due to ionization energy loss a particle must have a momentum at the vertex which exceeds GeV/c ( GeV/c) to penetrate to the most downstream MuID gap of the South (North) arm.
Steel plates surrounding the beam pipe guard against backgrounds caused by low-angle beam-beam collision products which scrape the beam pipe near the MuID -location (7-9 m) or shine off the RHIC DX magnets immediately downstream of each MuID arm. Steel blocks in the RHIC tunnels guard against penetrating radiation generated by the incoming beams scraping against beamline components (primarily the final focusing quadrupoles).
The MuID also contributes information to the first-level trigger decision. For the 2001/2 run, during which the data for this analysis were collected, a relatively coarse trigger was implemented using LeCroy 2372 Memory Lookup Units (MLUs). Each gap was divided into quadrants with a horizontal and vertical split going through the beam axis. Signals from tubes in an individual gap/orientation (layer) and quadrant were logically combined. Only gaps 0,2,3 and 4 were used in the trigger due to the 16-bit input limitation of the MLUs. The penetration depth required for the trigger to fire was programmable. The MuID-1Deep trigger fired if more than 6 out of 8 layers in a particular quadrant were hit (indicating the possibility that the event contained a particle penetrating to MuID gap 4). The MuID-1Shallow trigger fired if 3 of the 4 most shallow layers (horizontal and vertical layers in gaps 0 and 2) were hit for a particular quadrant.
III Method for Extraction of Muons from Charm Decay
Inclusive muon candidates, , are those particles which are successfully reconstructed to the last MuID gap (gap 4). These consist of four components: 1) “free-decay muons”, , which result from the decay of light hadrons ( and mesons) before reaching the pre-MuTR absorber, 2) “punchthrough hadrons”, , which penetrate the entire detector and are thus misidentified as muons 3) “background tracks”, , which in collisions are dominated by hadrons which decay into a muon after reaching the MuTR, and 4) “vertex-independent muons”, , which are primarily due to the decay of heavy flavor mesons.
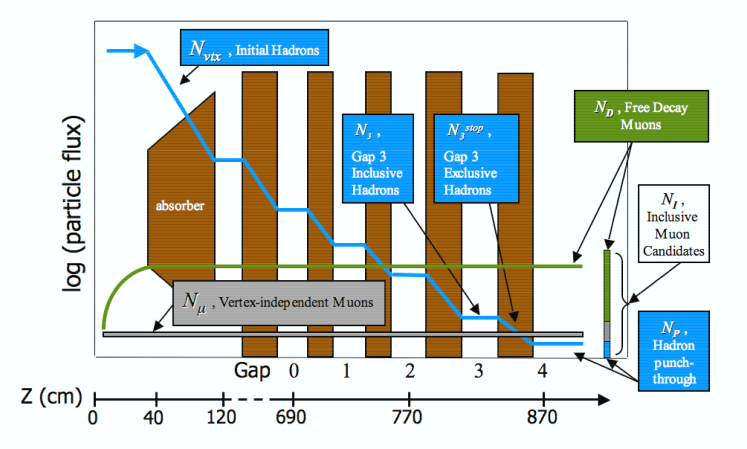
Figure 2 shows a schematic depiction of the relative yield per event of these different contributions as a function of flightpath into the muon arms, as described below.
The number of hadrons is large and essentially independent of flightpath until the first absorber layer is reached. In each absorber layer these hadrons undergo strong interactions with a probability , where is the length of absorber material traversed, and is the species and -dependent nuclear interaction length determined in Section III.6. Most of these interacting hadrons are effectively eliminated as possible muon candidates. However, a small fraction of hadrons penetrate the entire absorber thickness. These punchthrough hadrons are indistinguishable from muons.
The decay lengths for ’s (c cm) and ’s (c cm) are long compared to the flightpath from the vertex to the absorber. Therefore, the fraction of decay muons from these sources is relatively small, but increases linearly with the flightpath until the first absorber layer is reached. A hadron which decays prior to the pre-MuTR absorber into a muon that is inside the detector acceptance is indistinguishable from a muon originating at the vertex. After the first absorber layer the number of free-decay muons remains constant by definition.
Hadrons which decay in the MuTR volume are a relatively small contribution since most are absorbed prior to reaching the MuTR, the Lorentz-dilated decay lengths are long compared to the length of the MuTR volume (South cm, North cm), and a particle which decays in the MuTR is less likely to be reconstructed. Such tracks are partially accounted for in the calculation of punchthrough hadrons (see Section III.6) and the remaining fraction falls under the category of background tracks (Section III.7). This small contribution is not shown.
Without a high-resolution vertex detector muons from various sources (the decay of open heavy flavor hadrons, the decay of quarkonia, the decay of light vector mesons, and Drell-Yan production) originate indistinguishably close to the collision vertex. Thus their yield is independent of the flightpath and independent of the vertex position. Since inclusive muon candidates, by definition, penetrate to MuID gap 4, we measure the combined yield at cm.
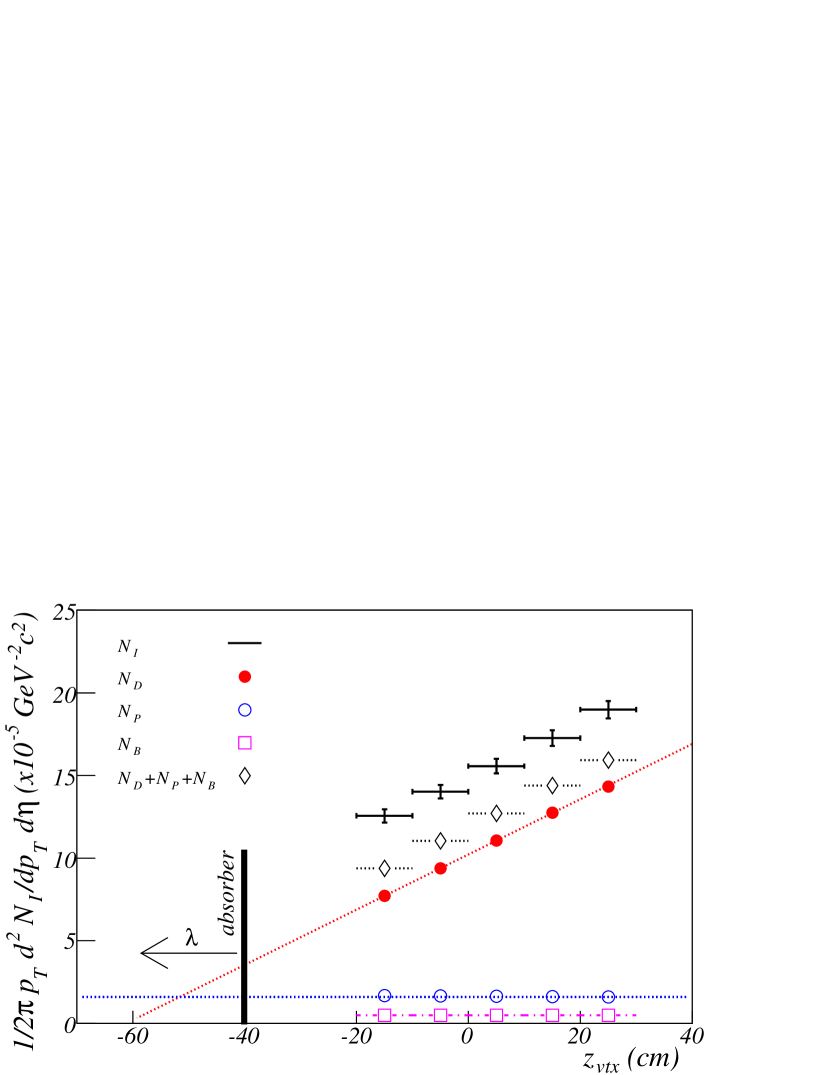
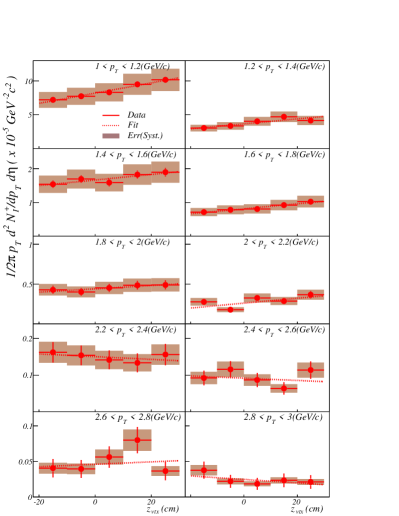
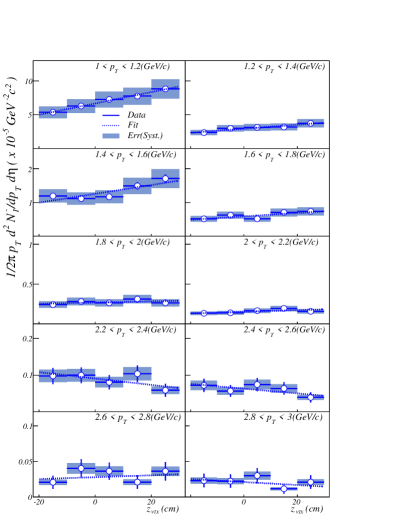
Figure 3 shows a sample distribution of the inclusive muon candidate yield as a function of collision vertex (), and its decomposition into the four different contributions. The yield of free-decay muons is seen to have a linear dependence that is set to 0 at . Here cm is the upstream face of the pre-MuTR absorber (indicated by the thick solid line), and is the effective absorption length, beyond which there are no free-decay muons. was found to be nearly identical to the species and -dependent nuclear interaction lengths determined in Section III.6. Muons originating from meson decays downstream of this location have no dependence. The fraction not accounted for in the calculation of the punchthrough hadron yield forms the small contribution from background tracks. The yield of punchthrough hadrons and vertex-independent muons also have no dependence. Note that the ratio of different contributions to the inclusive muon candidate spectrum is dependent.
In order to extract the cross section for charm production we first need to determine the yield of vertex-independent muons, , the amount beyond that due to light hadrons and fake backgrounds. As described in Section III.1, we select good runs, events, and tracks, and restrict our acceptance to regions where the detector performance was optimal, and the acceptance vs. was nearly constant. Next, as described in Sections III.2 and III.3, we obtain the yield of inclusive muon candidates vs. and , corrected for acceptance and efficiency: . In Section III.4 we describe a data-driven hadron generator. This generator is used in Section III.5, in which we describe how the vertex dependence of the inclusive muon candidate yield allows us to obtain the yield of muons from light-meson decay before the pre-MuTR absorber, similarly corrected and binned: . This generator is also used in Section III.6, in which we describe how we use hadrons which stop in MuID gap 3 (the penultimate gap), together with simulations of hadron penetration in the MuID absorber, to obtain the yield of punchthrough hadrons in MuID gap 4: . The yield of fake tracks, , determined from simulations described in Section III.7, is found to be small.
The yield of vertex-independent muons is determined by subtracting the contributions from light hadrons and fake backgrounds and averaging over bins:
| (2) |
where is implicit in all terms of the equation.
We convert this into a cross section via
| (3) |
Here is the cross section of the BBC trigger for interactions and is the efficiency of the BBC trigger for events in which a charm quark is created and decays into a muon. Substituting introduces negligible error due to the small mass of the muon, the only component left after the subtraction. As described in Section III.9, systematic errors are determined for each component and combined into a term that applies to the overall normalization and a term that applies to the dependence of the spectrum.
We use PYTHIA to derive the -dependent differential cross section for the production of charm quarks responsible for the vertex-independent muon yield. This procedure is very similar to that in references Adcox et al. (2002); S.S. Adler et al. (2005a, 2006a); S. Kelly, for the PHENIX Collaboration (2004); S.S. Adler et al. (2006b); S. Butsyk, for the PHENIX Collaboration (2005); A. Adare et al. (2006), and is described in detail, along with the associated systematic error analysis, in Section IV.
III.1 Data Reduction
III.1.1 Data Sets and Triggering
Runs were selected for this analysis based on stable detector operation using the same criteria as an earlier analysis of production S.S. Adler et al. (2004). Further runs were eliminated due to the presence of large beam-related backgrounds entering the back of the detector.
We select only those events in the vertex range cm. This minimizes the dependence of the detector acceptance and allows us to treat the amount of absorber material as a simple function of polar angle, ignoring complications in the pre-MuTR absorber near the beampipe.
The decision to collect an event was made by the Local Level-1 Trigger S.S. Adler et al. (2003a) within 4 s of the collision. Input to the trigger decision was given by the BBC (collision with a valid event vertex) and the MuID (reconstructed penetrating track). Each trigger could be independently scaled down, so that it occupied a predetermined fraction of the available bandwidth, by selecting every instance, where is the scaledown factor for the trigger. Three different data sets were selected from the good runs for different aspects of the data analysis:
-
•
BBC: To extract we need to measure the dependence of . For this we need the unbiased collision vertex distribution, which we obtain from a set of events collected with the BBC trigger: cm, where and are the number of hits in the North and South BBC respectively. was found to be mb using a van der Meer scan S.S. Adler et al. (2003c). There were BBC triggered events passing our vertex selection criteria in this data set, corresponding to a sampled luminosity of nb-1.
-
•
MuID-1Deep BBC (M1D): In order to extract , and we used events selected with the M1D trigger, which enriched the sample of events with tracks penetrating to MuID gap 4. For the M1D and BBC data sets we used identical run selection criteria. The total number of sampled BBC triggers for this data set was , corresponding to a sampled luminosity of nb-1.
-
•
MuID-1Shallow BBC (M1S): In order to extract we need a data set which provides an unbiased measurement of the number of particles which penetrate to MuID gap 3. Since the M1D trigger required tracks to penetrate to MuID gap 4 it could not be used. Instead we used the M1S trigger, which only used information from MuID gaps 0-2. We used a subset of runs for which the scaledown factor for this trigger was only 10, corresponding to a sampled luminosity of nb-1.
III.1.2 Track Selection
| # Associated MuID hits, | |
| (out of a possible ) | |
| Road cuts | Vertex cut, cm @ |
| Slope cut, | |
| associated hit in MuID gap 4 | |
| Track cuts | Track fit quality, |
| # Associated MuTR hits, | |
| (out of a possible 16) |
The Muon arm reconstruction algorithm starts by finding “roads” (collections of hits in the MuID which form straight, two-dimensional lines) and then combining them with hits in the MuTR to form “tracks”. We apply strict cuts on both road and track parameters in order to reduce backgrounds, see Table 1.
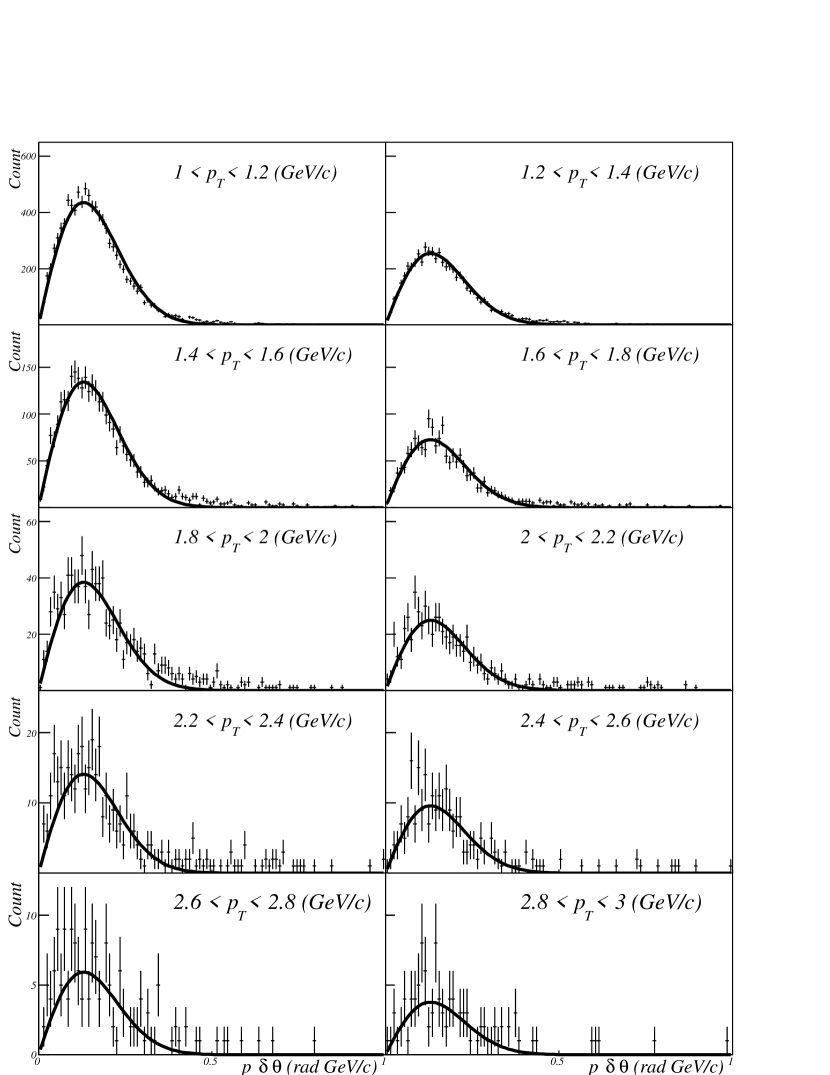
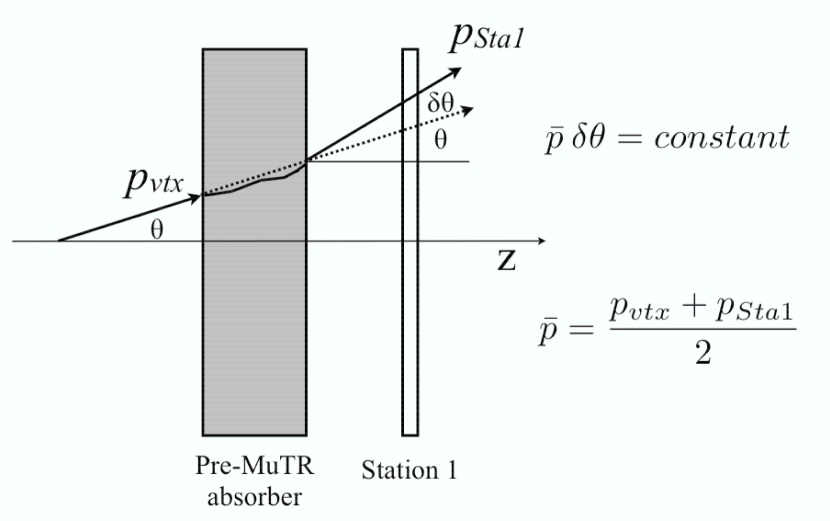
The resulting purity of the selected tracks is demonstrated in Figure 4. This figure shows , the angular deviation through the pre-MuTR absorber, scaled by the particle momentum to give a quantity which should be momentum independent, for different bins. As shown in Figure 5, is the angular difference between the reconstructed particle trajectory at the collision vertex () and at MuTR station 1. A GEANT GEA (1994) simulation of the PHENIX detector showed that tracks which do not suffer a strong interaction in the pre-MuTR absorber undergo angular deviations consistent with expectations based on standard multiple scattering: . The curves in each panel are fits to , in which the normalization constant () is allowed to float, and radMeV/c is given by GEANT and is consistent with a simple estimate based on the radiation length of the pre-MuTR absorber and the standard multiple scattering formula V.L. Highland (1975, 1979); G.R. Lynch and O.I. Dahl (1991) ( radMeV/c). The integral beyond is and is largely due to hadrons which have a strong interaction in the pre-MuTR absorber and are still reconstructed as a muon candidate. Such tracks are accounted for in the calculation of the punchthrough hadron yield, as described below.
III.1.3 Acceptance Restriction
We further restricted the acceptance of muon candidates for this analysis in two ways:
-
1.
We required tracks to pass through regions in which the Monte Carlo detector response strictly agreed with the measured response. This was established by agreement between the number of data hits and Monte Carlo hits assigned to tracks in each region of the detector.
-
2.
We required tracks to lie within a pseudorapidity range, , a region over which the acceptance depends only weakly on the collision location.
III.2 Acceptance and Efficiency
We factorized the acceptance and efficiency for tracks penetrating to a particular MuID gap, , into four components:
-
1.
: the acceptance of a perfectly working detector with the acceptance restrictions described above. This quantity () is normalized to () and accounts for non-sensitive structural members in between the cathode strip chambers and chamber regions removed from consideration for the entirety of this analysis.
-
2.
: the efficiency of reconstructing a track that fell within the accepted region. This quantity is somewhat low () due to detector problems in this first physics run that have been subsequently resolved.
-
3.
: the efficiency for reconstructed tracks to pass the cuts listed in Table 1.
-
4.
: the efficiency of the MuID trigger to fire in events with selected tracks.
, , and were evaluated with a GEANT simulation using single muons thrown with a realistic spectrum into the muon arms. The applied detector response incorporated measured detector performance. Reductions in efficiency due to occupancy are negligible in collisions. Run-to-run variations were ignored since we selected runs in which the detector performance was similar and stable. Efficiency values for tracks penetrating to MuID gap 4 were parameterized in terms of and and are listed in Table 2. There are minor differences in these parameterizations for particles with different charge sign.
| Quantity | Value |
|---|---|
| 0.64 | |
| 0.66 | |
| 0.86 | |
| 0.97 | |
| 0.75 |
We also determined the efficiencies for tracks which only penetrate to MuID gap 3, since these are needed to obtain the yield of punchthrough hadrons. These were found to scale from the efficiencies for tracks penetrating to MuID gap 4: , where . is less than one because the MuID and the road reconstruction algorithm are optimized for deeply penetrating particles. Particles which do not penetrate to the last gap have poorer resolution matching to MuTR tracks (due to reduced lever arm and smaller number of hits) and are also more susceptible to MuID inefficiencies.
Trigger efficiencies, and , are also listed in Table 2. These were evaluated using the BBC data set, which did not require the MuID trigger to fire.
| (4) |
where is the number of selected tracks penetrating to MuID gap 4 for events in which the M1D trigger fired, is the scaledown factor applied to the M1D trigger, and similarly for . was also evaluated according to Equation 4, but with , and .
Since both the M1D and M1S triggers required the BBC trigger in coincidence with the MuID trigger we must also account for the BBC trigger efficiency for events in which a reconstructed muon is created via charm quark decay: . The BBC efficiency was evaluated for events in which a was produced in the muon arm acceptance using PYTHIA+GEANT simulations S.S. Adler et al. (2004). The BBC efficiency was also evaluated for events in which ’s were produced in the central arm acceptance S.S. Adler et al. (2003c) using data triggered without a BBC requirement. The BBC efficiency under both conditions was found to have a similar value that we therefore adopt: .
III.3 Inclusive Muon Candidates
We first form two sets of collision vertex () histograms with 10 cm bins: one histogram for all interactions selected with the BBC trigger, and a series of histograms for interactions selected with the M1D trigger and having a good muon candidate within a bin ( GeV/c, 200 MeV/c bins). The muon candidate histograms are formed separately for each charge sign. Entries into each histogram are scaled by the appropriate trigger scaledown factor. The muon candidate histograms are divided by the minimum bias histogram to give , as shown in Figure 6. Systematic errors shown in this figure are discussed in Section III.9 and listed in Table 7.
III.4 Hadron Generator
In order to determine the contributions to the inclusive muon yield from free-decay muons (Section III.5), and punchthrough hadrons (Section III.6) we make use of a data-driven hadron generator. The input for this generator is obtained from PHENIX measurements in GeV collisions at S.S. Adler et al. ; V. Ryabov, for the PHENIX Collaboration (2005) using the following procedure:
-
1.
and spectra at ( GeV/c) are fit to a power law. We assume factorization in and and scale the spectra fit at according to:
,
with . This factorization is observed both in PYTHIA and in BRAHMS Arsene et al. (2004) data measured at and .
-
2.
We use a similar procedure to obtain the charged kaon yield at , but we need to first extrapolate the yield at beyond the current measurement limit ( GeV/c).
We start by forming the isospin averaged ratio vs. at . For GeV/c we use charged particles, S.S. Adler et al. . We use neutral particles, , for GeV/c V. Ryabov, for the PHENIX Collaboration (2005). We then fit this combined ratio to the form . Next, we normalize this function separately to the and ratios for GeV/c. Finally, we multiply by the corresponding charged pion spectrum to obtain , our parameterization of the mid-rapidity charged kaon spectra extending out to 3.5 GeV/c.
As with pions, we need to extrapolate this parameterization of the yield at to obtain the yield at . One possibility is to assume boost invariance of the ratio. However, PYTHIA gives a slightly narrower rapidity distribution for kaons than for pions, resulting in a kaon yield at that is only 85% of that predicted with the boost invariance assumption. We split the difference between these two assumptions:
,
where, again, .
-
3.
The and spectra are assumed to have the same shape as the pion spectra with normalization factors set to the measured values at , GeV/c (0.4 for , 0.24 for ) S.S. Adler et al. . The exact form used for the spectra is unimportant. They obviously do not contribute to the yield of decay muons and their contribution to the yield of punchthrough hadrons is greatly suppressed due to their relatively short nuclear interaction length.
III.5 Free-Decay Muons
In Figure 6 one can clearly see the linear dependence in the yield of inclusive muon candidates vs. at low transverse momentum ( GeV/c). This dependence is due to muons from the decay of abundant light hadrons (’s and ’s) prior to the first absorber material at cm. We fit these histograms with the function . After multiplying by the slope, , and its fit error give, respectively, the yield per unit length of decay flightpath of muons from hadron decay, , and the statistical error on this quantity. Results are shown in Figure 7. Systematic errors shown in this figure are discussed in Section III.9 and listed in Table 7.
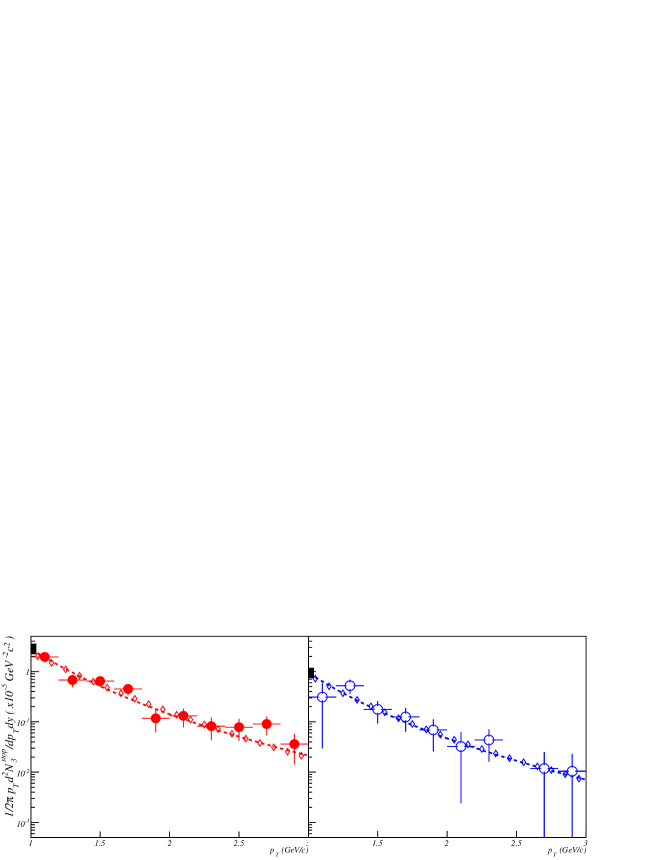
This procedure does not provide a quantitative measure of the decay muon spectrum above GeV/c, even though a substantial fraction of the inclusive muons are decay muons up to significantly higher . This is due to the fact that at high the decay slopes decrease (Lorentz time dilation) as do the statistics, both of which make it more difficult to quantify the decay component directly. In order to extend our estimate of decay muons to higher we use our hadron generator, described in Section III.4. We simulate the decay of hadrons into the muon arms and obtain predicted spectra (per unit length) of muons from hadron decay separately for each charge sign. We then normalize these predicted spectra to the measured spectra. The normalized predicted spectra are shown as the dashed lines in Figure 7. The predicted spectral shape agrees with the data where we have a statistically significant measurement. The absolute normalization of the prediction is within 7% of the measured value, easily consistent within errors.
We obtain from the product of and the average value of the decay flightpath, , for each bin.
III.6 Punchthrough Hadrons
A hadron penetrating to MuID gap 4 is impossible to distinguish from a muon. However, we can cleanly identify hadrons in shallower gaps and then extrapolate their yield to obtain the yield of punchthrough hadrons in MuID gap 4.
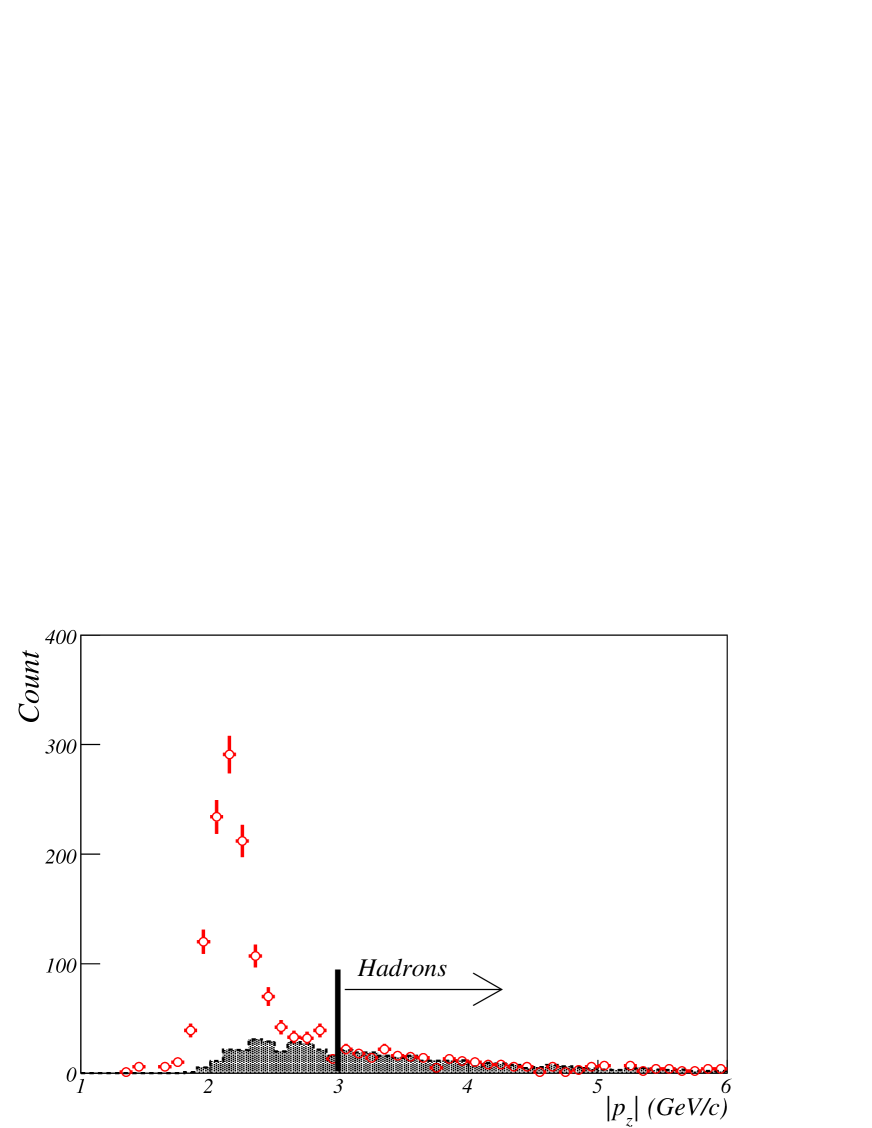
Figure 8 shows the longitudinal momentum (, the momentum projected onto the beam axis) distribution of particles that stop in MuID gap 3. The sharp peak at GeV/c corresponds to charged particles which stopped because they ranged out in the absorber plate between gaps 3 and 4 (this includes both muons and also hadrons which only suffered ionization energy loss.) The width of this peak is due to the 20 cm (11.4 ) absorber thickness between MuID gaps 3 and 4, and energy-loss fluctuations in all the preceding absorber layers. Particles at momenta beyond the peak ( GeV/c) form a relatively pure sample of hadrons, with only a small contamination due to inefficiencies in MuID gap 4 and particles with mis-reconstructed momentum values. After correcting for acceptance and efficiency we use these particles to obtain the spectrum for the “gap 3 exclusive yield,” as shown in Figure 9. Note: we use data from the M1S trigger sample since the M1D sample required a hit in MuID gap 4, which would bias this measurement.
In order to extrapolate this measured spectrum for hadrons stopping in MuID gap 3 to the spectrum of punchthrough hadrons which penetrate to MuID gap 4 we start by assuming exponential absorption of hadrons entering the muon arm absorber material. With this assumption we obtain an expression for the “gap 3 inclusive yield”, those hadrons that reach at least MuID gap 3:
| (5) |
where indicates the contributing hadron species (), is the yield at the vertex of the species, is the amount of absorber material traversed to reach MuID gap 3, and is the -dependent nuclear interaction length of the species. We can write a similar expression for the punchthrough hadron yield:
| (6) |
where is the amount of absorber material traversed to reach MuID gap 4.
By taking the difference between these two equations we obtain an expression for the gap 3 exclusive yield:
| (7) |
In our measurement we cannot identify the species comprising the gap 3 exclusive yield, but we do know their charge sign. As a result, Equation III.6 can be rewritten as two equations with six unknowns for each bin:
| (8) |
| (9) |
Based on measured cross sections for various species Eidelman et al. (2004), we chose to reduce the number of unknowns with the following assumption:
We further assume that and have the form .
We effectively smoothed the gap 3 exclusive yield for each sign by fitting the measured values to a power law. Using from the hadron generator (normalized to the free-decay muon spectrum, as described in Section III.5) and known values for , we fit Equations III.6 and III.6 to the smoothed gap 3 exclusive yield for each sign to obtain:
Results of these fits are shown in Figure 9.
With these values for and the hadron generator input spectra, we could directly apply Equation 6 to obtain the final punchtrough spectra. However, we made one further correction, described below, after finding that our assumption of exponential absorption does not hold when applied to GEANT simulations of the punchthrough process.
Using our GEANT-based PHENIX simulation program, we generated data sets with both the FLUKA A. Fassò et al. (2001) and GHEISHA H.S. Fesefeldt (1985) hadronic interaction packages. Input spectra for these data sets were given by our decay hadron generator. We selected all particles which did not decay before the pre-MuTR absorber. “Truth” values for the punchthrough and gap 3 exclusive yields were obtained by splitting those particles based on the absence (gap 3 exclusive) or presence (punchthrough) of associated charged particles with MeV in MuID gap 4. We varied from MeV and saw no significant change in the results.
Using the known input spectra, known values for , and truth values for gap 3 exclusive yield, we applied Equation III.6 to the Monte Carlo data sets to obtain . Due to statistical limitations we integrated our results over and into two bins: GeV/c and GeV/c. Values extracted for for the different hadronic interaction packages are listed in Table 3. These values are consistent with those found for our measured data, listed above.
| FLUKA | GHEISHA | |||
|---|---|---|---|---|
| [cm] | [cm] | |||
| Species | ||||
| 19.6 | 24.5 | 16.0 | 21.1 | |
| 19.4 | 24.8 | 15.0 | 19.3 | |
| 24.4 | 29.6 | 24.9 | 30.8 | |
| 20.5 | 24.2 | 17.2 | 21.2 | |
| Species | Description | ||
|---|---|---|---|
| 0.76 | 0.86 | ||
| 0.91 | 0.75 | ||
| 0.91 | 1.00 | ||
| 1.17 | 1.06 | ||
| 1.48 | 1.04 | ||
| 1.47 | 1.09 | ||
| 1.31 | 1.07 | ||
| 2.21 | 1.69 | ||
| 1.12 | 0.95 | ||
| 1.19 | 0.92 | ||
| 1.11 | 1.04 | ||
| 1.67 | 1.38 | ||
| 32% | 10% | ||
| 24% | 18% | ||
| 18% | 3% | ||
| 32% | 22% |
Inserting these values for into Equation 6 we obtained a prediction for . Ratios of the truth values and predicted values for the punchthrough yield () for the different hadronic interaction packages are listed in Table 4. One can see that these ratios deviate significantly from unity and that the two hadronic interaction packages disagree on the direction of the deviation: the exponential absorption model tends to overpredict the punchthrough yield for FLUKA () and underpredict it for GHEISHA ().
Relatively little data exists in the relevant momentum range that would allow us to conclude which, if either, of the hadronic interaction package is correct. Measurements by RD10 and RD45 E.W. Cornell et al. (1994) of the penetration depth of identified hadrons found that GHEISHA did well for protons and FLUKA did not. But neither did well for pions and no data exists for kaons. Furthermore, the results are sensitive to the definition of a penetrating particle: For RD10/45 an incoming particle with any associated charged particles in the cm2 detector area at a particular depth was defined to have penetrated to that depth. In our measurement we reconstruct particle trajectories and MuID hits are not associated with a road unless they are within a narrow search window surrounding the projected trajectory. Thus we are relatively insensitive to the leakage of a showering hadron.
As a result of these uncertainties on the applicability of our exponential absorption model we incorporate a species and -dependent correction factor to Equation 6:
| (10) |
The correction factors for pions and kaons are obtained from the average of the values of for the two packages, , which are listed in Table 4. The values of for a given species are not the same for the different bins, so we assume the values are valid at the average of each bin ( GeV/c and 2.31 GeV/c respectively) and use a linear extrapolation in to obtain the final correction factors:
| (11) |
We assume that ’s and ’s have the same correction factors as the corresponding sign pions. Since ’s and ’s make only small contributions to the punchthrough hadrons this simplifying assumption has little consequence. We incorporate the maximum fractional difference in the ratios for the two packages (32%) into our systematic error estimate, as listed in Table 7.
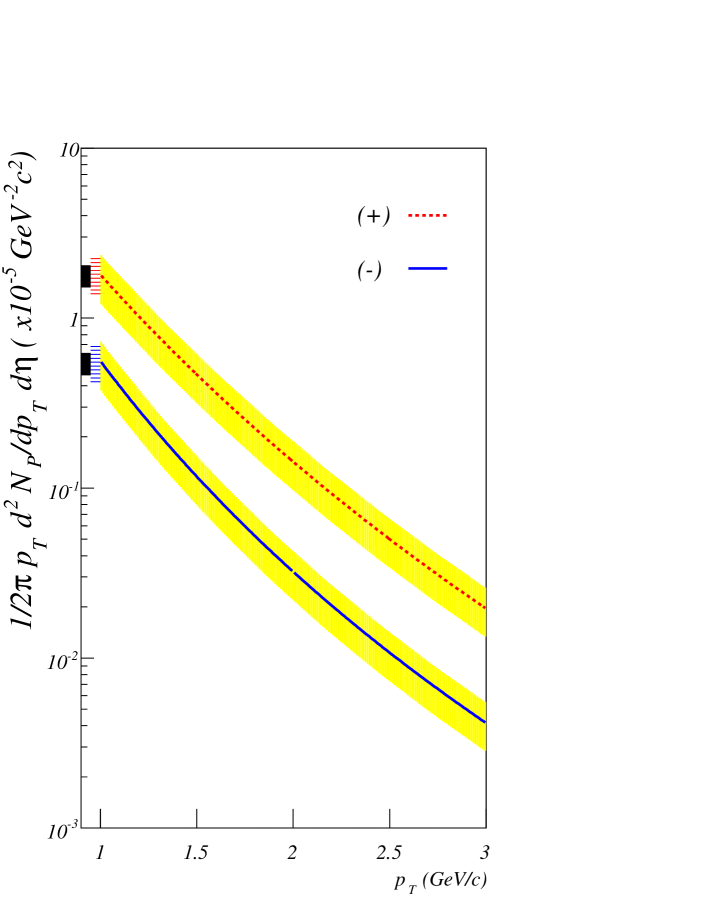
We use Equation 10, with the tabulated correction factors, particle yields at the vertex given by our normalized hadron generator, the known value of , and the values for determined from the measured gap 3 exclusive yield, to obtain the spectrum of punchthrough hadrons, , as shown in Figure 10. Systematic errors shown in this figure are discussed in Section III.9 and listed in Table 7. We multiply by the fraction of the accepted range represented by each bin to finally obtain .
III.7 Background Tracks
The main source of tracks which are not accounted for in the yield of punchthrough hadrons and free-decay muons, and which are not due to vertex-independent muons, are light hadrons which penetrate through the pre-MuTR absorber, decay into a muon, and are still reconstructed as a valid track.
A simulation of single pions thrown into the muon arm acceptance shows that the number of hadrons which decay after the pre-MuTR absorber and penetrate to MuID gap 4 is only 5-10% (increasing with increasing ) of the -averaged number of free-decay muons, . This ratio will be suppressed by the fact that tracks which decay are less likely to be reconstructed successfully. It is further suppressed by our punchthrough calculation procedure: the number of such tracks which stop in MuID gap 3 is roughly half the number that penetrate to gap 4; these will be counted in our calculation of the punchthrough hadron yield.
We express our estimate for the yield of background tracks not otherwise accounted for as . The systematic uncertainty assigned to this quantity, , covers the extreme possibilities that the is unsuppressed or fully suppressed by reconstruction and punchthrough procedures, as described above.
This estimate was verified in a simulation of ’s and ’s which were thrown into the muon arm acceptance and fully reconstructed. The reconstructed track information, together with the Monte Carlo truth information, allows us to eliminate uncertainties due to mis-reconstruction of the track and due to determination of whether a track which penetrated to the last gap did so in a reconstructible fashion. Systematic errors on this estimate are discussed in Section III.9.
III.8 Vertex-Independent Muons
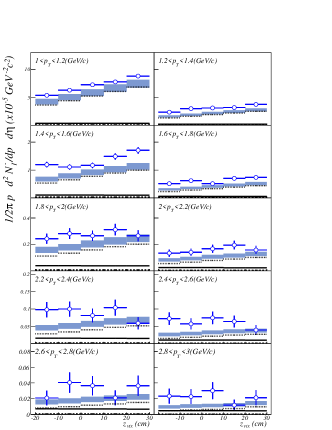
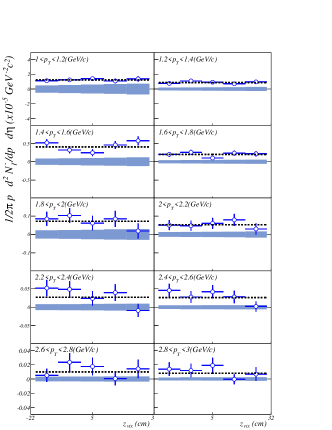
Figure 11 shows the yield of inclusive muon candidates, , with contributions from individual components (free-decay muons, punchthrough hadrons, and background tracks) shown as well as their sum. The vertex-independent muons can be seen as the clear excess above the calculated background sources. The systematic error bands shown on the component sums are discussed in Section III.9 and listed in Tables 7 and 7.
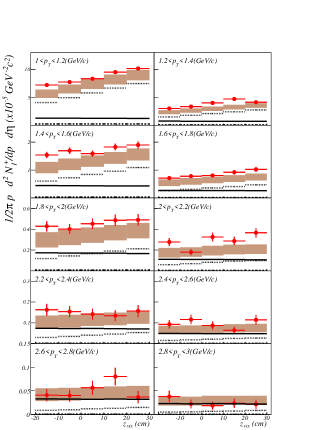
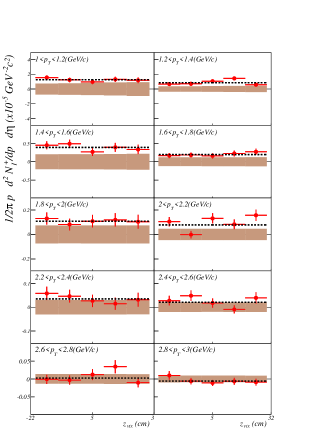
We obtain the yield of vertex-independent muons by applying Equation 2 in each bin, subtracting the hadronic contributions from the inclusive muon candidate yield, and averaging over bins. This yield is shown, before averaging over to demonstrate the expected vertex independence, in Figure 12.
We make one final correction for momentum scale. The observed mass of the , reconstructed with the same code and in the same data set, is higher than the nominal value by S.S. Adler et al. (2004). However, in a higher statistics data set the momentum scale accuracy is verified to within 1% by our observation of the accepted value for the mass of the S.S. Adler et al. (2006c). Also, the peak observed in the longitudinal momentum distribution of particles stopping in MuID gap 3 (see Fig. 8) is within of the predicted value. We therefore assume that the momentum scale is high by (splitting the difference between 0 and 3%). This results in a momentum scale correction factor to the prompt muon yield of . We assume a 100% systematic error on this correction factor, as shown in Tab. 7.
Finite momentum resolution can cause a similar effect. Contributions from energy loss fluctuations, multiple scattering and chamber resolution combine to give for the momentum range used in this analysis. Finite resolution, combined with an exponentially falling spectrum, artificially hardens the measured spectrum. For GeV/c this hardening increases the normalization of the yield by %. However, this is accounted for in our efficiency determination since we use a realistic spectrum as input. Therefore we apply no explicit correction for this effect.
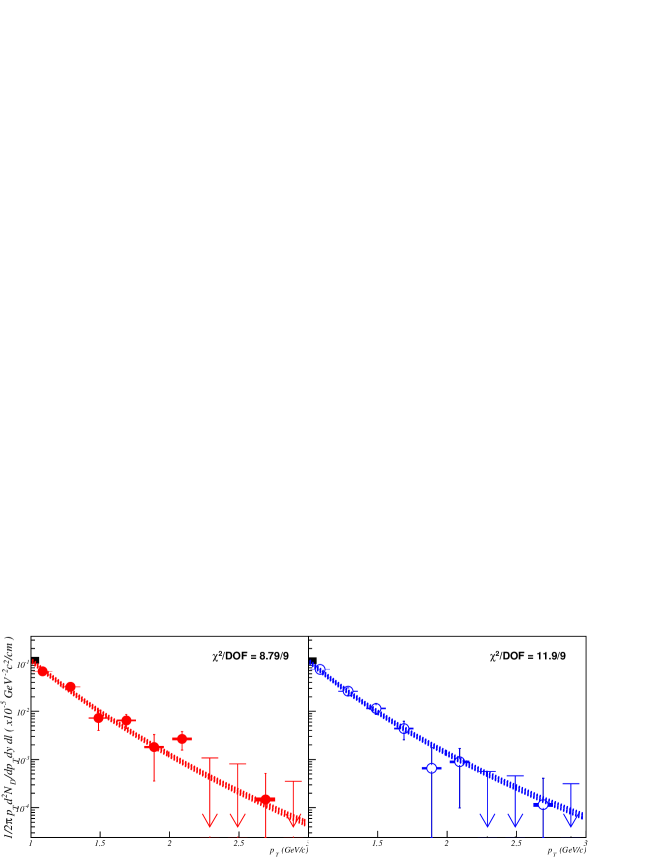
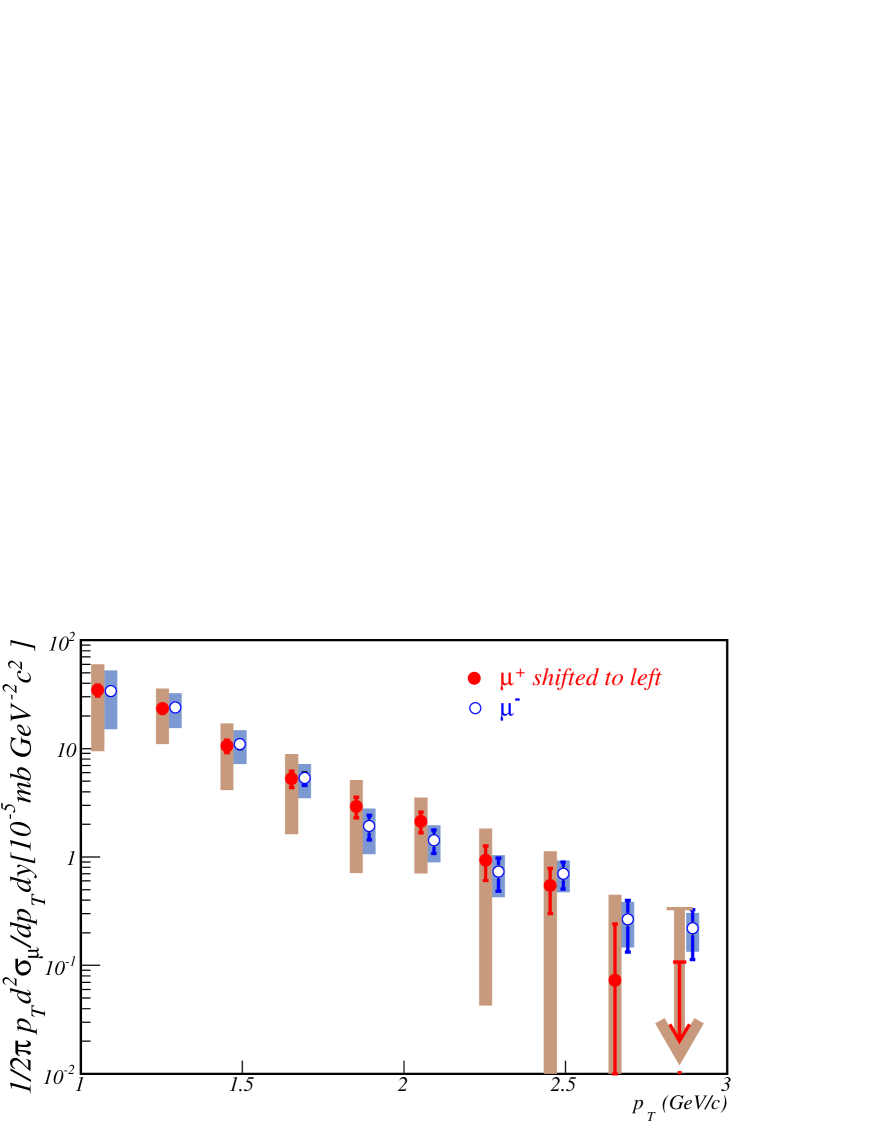
The final values for the vertex-independent muon cross section, obtained from Equation 3, are shown in Figure 13. Points in this figure have been placed at the average value of the bin contents to account for bin shifting in the steeply falling distributions. Systematic errors shown in this figure are discussed in Section III.9 and listed in Tables 7 - 7.
III.9 Systematic Errors
Many sources of systematic error on the yield of vertex-independent muons, , are common to the different components of the inclusive muon candidate yield. In order to account for this we rewrite Equation 2 (making the and dependencies implicit) as:
where is the fraction of the inclusive muon candidate yield attributed to the component. We can now write the systematic error on as:
| (13) |
, as determined below, is displayed in Figures 11 and 12. Note that the errors for positives are significantly larger than for negatives. This is due to the much larger relative contribution to positive inclusive muon candidates from punchthrough hadrons, which is due to the relatively small size of the nuclear interaction cross section.
Error sources contributing to are quantified in Table 7. Error sources contributing to and are quantified in Table 7. Error sources contributing to and are quantified in Table 7. Note that in these tables we separately list errors that affect the overall normalization () and the shape of the spectrum (). The error on is taken to be 100% of its estimated value: .
Values for are displayed in Figure 6. Values for and are displayed in Figures 10 and 7 respectively. We insert , , , and into Equation 13 as part of the final systematic error on .
To get the vertex-independent muon cross section, as defined in Equation 3 and displayed in Figures 13 and 16, we need to add in quadrature the errors on , , . The error on is obtained from the components above according to Equation 13. As mentioned
above, was determined by a van der Meer scan to be 21.8 mb, with an error of 9.6% S.S. Adler et al. (2003c). We assign an error of 5% to , which was found to be 0.75 through two different methods S.S. Adler et al. (2004, 2003c).
| Error Source | Comment | ||
|---|---|---|---|
| Momentum Scale | 6.0% | Taken to be 100% of the correction. | |
| 10% | Taken to be 20% of the correction. | ||
| 9.0% | 0 | Taken to be 25% of the correction. | |
| 5.0% | Error on taken to be 20% of the correction. | ||
| Error on taken to be maximum of observed variation. | |||
| 4.7% | 0 | Taken to be the difference in obtained with different procedures. | |
| 16.3% | Add all rows in quadrature. |
| Error Source | Comment | ||
|---|---|---|---|
| Decay flight path | 5% | 0 | Variation due to shift of by cm. |
| fit range | 3.3% | 0 | Variation seen using cm, cm. |
| Input hadron spectrum | 0 | Spectrum normalized to data, so the only | |
| uncertainty here is in the dependence. | |||
| Decay normalization | 7% | 0 | Statistical uncertainty in fit to observed free-decay muon yield. |
| 9.2% | Add all previous rows in quadrature. | ||
| 16.3% | From Table 7. | ||
| 18.7% | Add previous two rows in quadrature. |
| Error Source | Comment | ||
|---|---|---|---|
| Exponential absorption model | 0 | 32% | Maximum fractional difference between |
| for FLUKA and GHEISHA, from Table 4. | |||
| 23% | 0 | Dominated by ambiguity in the definition of which | |
| particles should be reconstructed. | |||
| and contributions | 10% | 0 | Variation with extreme assumptions on the and |
| nuclear interaction length. | |||
| normalization | 10% | 0 | Statistical uncertainty in fit to observed gap 3 exclusive yield. |
| 27% | 32% | Add all previous rows in quadrature. | |
| 16.3% | From Table 7. | ||
| 31.5% | Add previous two rows in quadrature. |
IV Charm Cross Section
The charm production cross section obtained from the yield of vertex-independent muons (or from the yield of non-photonic electrons, or mesons) is necessarily model dependent since we do not measure the charm quarks directly. We use PYTHIA to convert our measurement of the vertex-independent muon yield into an estimate of the differential charm production cross section at forward rapidity, , in a procedure very similar to that used in PHENIX measurements of charm production at Adcox et al. (2002); S.S. Adler et al. (2005a, 2006a); S. Kelly, for the PHENIX Collaboration (2004); S.S. Adler et al. (2006b); S. Butsyk, for the PHENIX Collaboration (2005); A. Adare et al. (2006). We use PYTHIA version 6.205 with parameters tuned to reproduce charm production data at SPS and FNAL G.A. Alves et al. (1996) and single electron data at the ISR F.W. Büsser et al. (1976); Perez et al. (1982); Basile et al. (1981). Tuned parameters are listed in Table 8. The meaning of each parameter is more thoroughly defined in the PYTHIA manual T. Sjöstrand et al. (2001b).
| Parameter | Value | Meaning |
|---|---|---|
| MSEL | 4 | Heavy quark production every event |
| (gluon fusion + annihilation). | ||
| MSTP(32) | 4 | Hard scattering scale, . |
| MSTP(33) | 1 | Use -factor. |
| MSTP(52) | 2 | Use PDF libraries. |
| MSTP(51) | 4046 | Select CTEQ5L PDF libraries H.L. Lai et al. (2000). |
| MSTP(91) | 1 | Use Gaussian distribution for intrinsic . |
| PARP(31) | 3.5 | -factor. |
| PARP(91) | 1.5 | (GeV/c). |
| PARP(93) | 5.0 | Maximum (GeV/c). |
| PMAS(4,1) | 1.25 | (GeV/c). |
| 0.32 | Default charm chemistry ratio. |
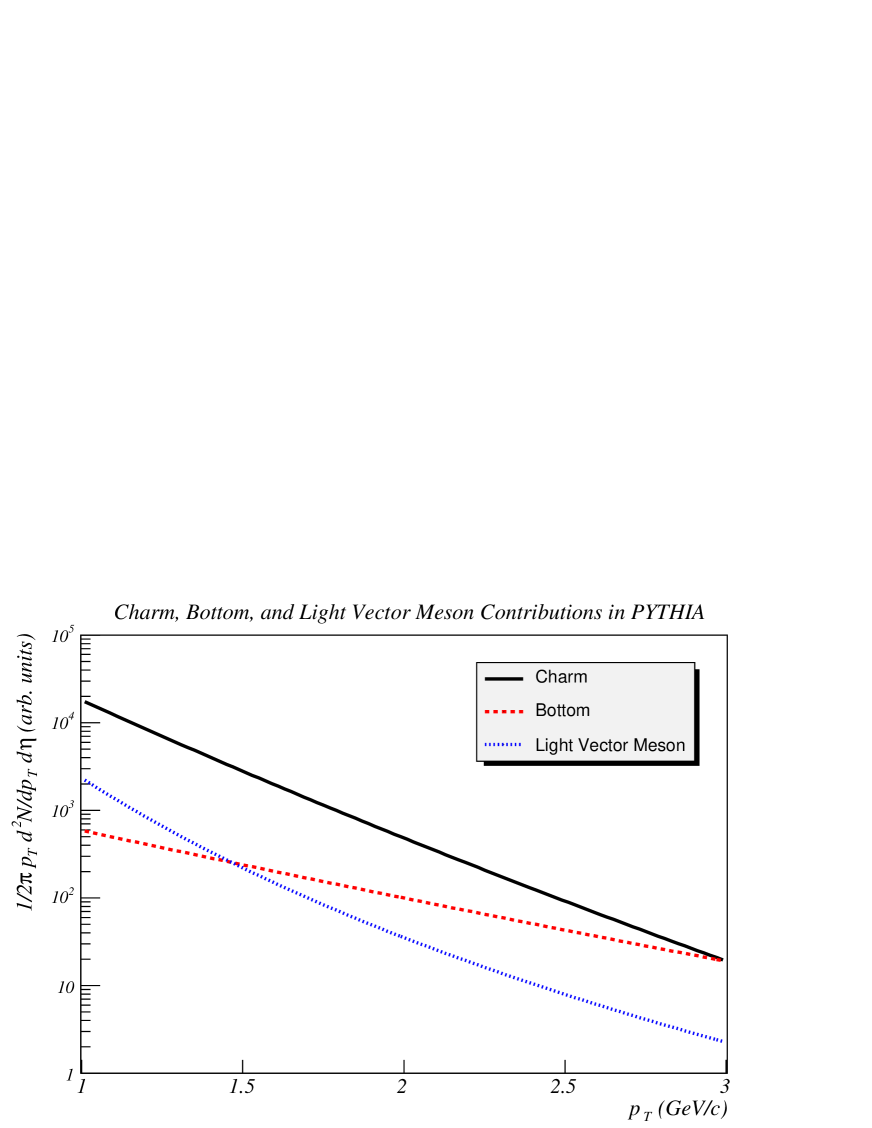
Vertex-independent muon sources, predicted by a PYTHIA simulation using the same parameters (except that MSEL is set to 2 to generate unbiased collisions), are listed in Table 9. These sources include decays of hadrons containing a heavy quark, and light vector mesons with a decay length too short to be measured with the existing experimental apparatus (). Their spectra are shown in Figure 14. Contributions from quarkonium decays, Drell-Yan and lepton decays are negligible. This shows that vertex-independent muon production in our acceptance is dominated by muons from decay of charm hadrons, although for GeV/c the contribution from decays of hadrons containing a bottom quark is starting to become important.
| Source | Contribution |
|---|---|
| Open charm | 84.6% |
| Open bottom | 6.9% |
| 8.1% | |
| Quarkonia | % |
| Drell-Yan | % |
| leptons | 0.4% |
This simulation also gives the distribution of charm quarks ( vs. ) that produce a muon in our acceptance, as shown in Figure 15. This demonstrates that the vertex-independent muons we measure sample charm quarks down to GeV/c, over a narrow rapidity slice centered at .
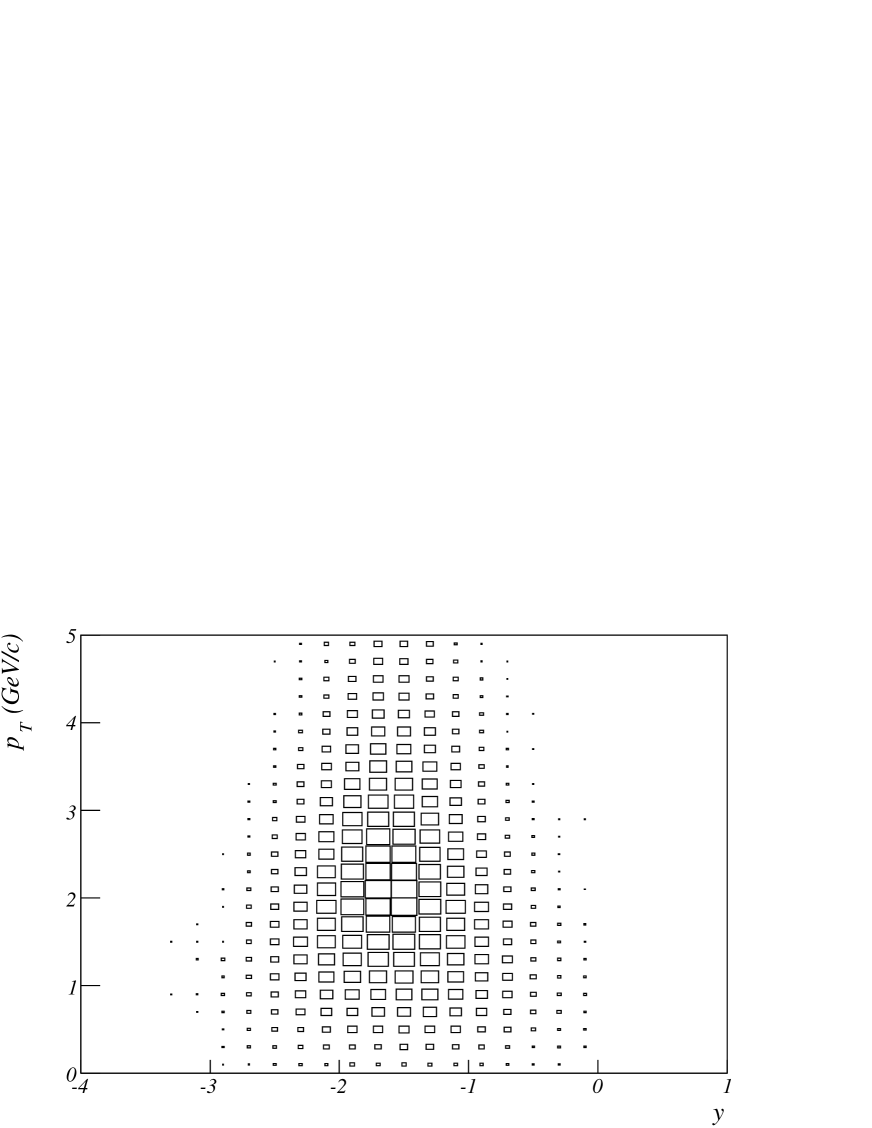
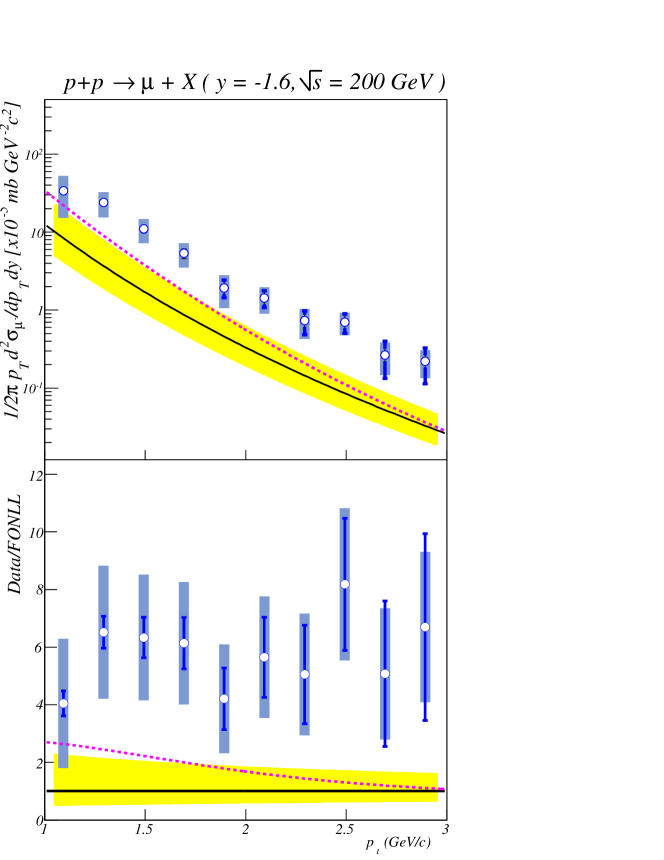
Figure 16 shows a comparison of the measured vertex-independent negative muon spectrum (from Figure 13) to the prediction of this default PYTHIA simulation and to a FONLL calculation Cacciari et al. (2005); Cacciari . One can see that the measured values significantly exceed both predictions. The spectrum also appears to be somewhat harder than the PYTHIA spectrum with the parameters listed in Table 8.
We scale the charm (only) contribution to the PYTHIA vertex-independent muon spectrum such that the total spectrum (including the small contributions from open bottom and vector mesons) matches the central values of the measured vertex-independent negative muon spectrum. Only statistical errors are used in the fit. Note, larger systematic errors for the positive muon spectrum preclude a significant measurement for that charge sign. We multiply the scale factor from the fit (2.27) by the PYTHIA value for the charm production cross section, (0.107 mb), to obtain mb.
We distinguish between two different sources of systematic uncertainty on the extraction of the charm cross section: 1) uncertainty in the PYTHIA calculation, and 2) uncertainty in the data, which is largely independent of PYTHIA.
We determined the uncertainty in the data () by refitting PYTHIA to the data at the minimum and maximum of the 1 systematic error band.
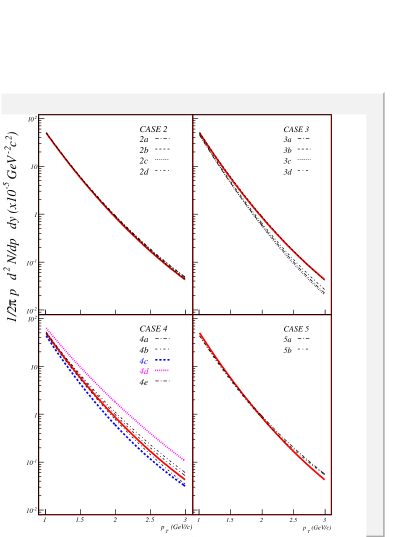
We determined the uncertainty in the PYTHIA calculation with a systematic study in which we varied simulation parameters, extracted the new simulated vertex-independent negative muon spectrum, normalized to the measured spectrum, and extracted for the modified parameter sets. We varied PDF libraries, the hard scattering scale, the charm quark mass, the intrinsic value, the ratio, charm production mechanism selections, and open bottom and vector meson scaling assumptions. The parameter sets used and the results of this study are summarized in Table 10.
| Case | PYTHIA Settings | |||||
|---|---|---|---|---|---|---|
| 1 | Default settings, see Table 8. | |||||
| 2a | , CTEQ4L PDF libraries H.L. Lai et al. (1997). | |||||
| 2b | , GRV94LO PDF libraries Gluck et al. (1995). | |||||
| 2c | , GRV98LO PDF libraries Gluck et al. (1998). | |||||
| 2d | , MRST (c-g) PDF libraries A.D. Martin et al. (2002). | |||||
| 3a | . | |||||
| 3b | . | |||||
| 3c | . | |||||
| 3d | . | |||||
| 4a | GeV/c. | |||||
| 4b | GeV/c. | |||||
| 4c | GeV/c. | |||||
| 4d | GeV/c. | |||||
| 4e | , Maximum virtuality scale and matrix element matching scheme. | |||||
| , Multiplicative factor applied to hard scattering scale. | ||||||
| 5a | -factor , | |||||
| , Hard scattering enabled. | ||||||
| 5b | -factor , | |||||
| , Hard scattering enabled, | ||||||
| All other parameters untuned. | ||||||
| 6 | A. Tai, for the STAR Collaboration (2004). | |||||
| 7 | Open bottom and vector mesons scale with charm. | |||||
| Case | Normalization | |||||
| (mb) | (mb) | to Data | (mb) | (%) | ||
| 1 | 0.658 | 0.107 | 2.27 | 0.243 | – | 0.67 |
| 2a | 0.691 | 0.111 | 2.10 | 0.232 | -4.5 | 0.69 |
| 2b | 0.698 | 0.112 | 2.09 | 0.233 | -3.9 | 0.71 |
| 2c | 0.669 | 0.109 | 2.18 | 0.238 | -1.7 | 0.73 |
| 2d | 0.551 | 0.088 | 2.67 | 0.236 | -2.9 | 0.71 |
| 3a | 1.520 | 0.243 | 1.12 | 0.271 | 11.8 | 0.84 |
| 3b | 0.863 | 0.139 | 1.63 | 0.226 | -6.7 | 0.71 |
| 3c | 1.501 | 0.242 | 1.11 | 0.267 | 10.2 | 0.84 |
| 3d | 1.104 | 0.178 | 1.45 | 0.258 | 6.4 | 0.78 |
| 4a | 0.905 | 0.145 | 1.73 | 0.252 | 3.7 | 0.67 |
| 4b | 0.487 | 0.078 | 2.91 | 0.226 | -6.7 | 0.64 |
| 4c | 0.658 | 0.104 | 2.81 | 0.292 | 20.4 | 0.66 |
| 4d | 0.658 | 0.104 | 1.50 | 0.156 | -35.8 | 0.63 |
| 4e | 0.658 | 0.106 | 2.09 | 0.220 | -9.2 | 0.63 |
| 5a | 0.435 | 0.068 | 3.91 | 0.266 | 9.4 | 0.80 |
| 5b | 0.385 | 0.058 | 4.67 | 0.271 | 11.7 | 0.79 |
| 6 | 0.658 | 0.107 | 2.38 | 0.255 | 5.0 | 0.67 |
| 7 | 0.658 | 0.107 | 2.20 | 0.236 | -2.9 | 0.67 |
The PYTHIA charm cross section varies substantially () for the chosen parameter sets. However, the extracted experimental charm cross section is relatively stable (). This is due to the fact that the parameter set changes have relatively minor effects on the shape of the predicted vertex-independent muon spectrum, and we obtain the experimental charm cross section by normalizing the PYTHIA charm cross section by the ratio of the measured and predicted muon spectra.
One way to visualize this is to plot (see Figure 17) the vertex-independent muon yield in our acceptance per event in which a pair is created for the different PYTHIA parameter sets. Due to our procedure, parameter sets which give similar vertex-independent muon yields per event in the low region (which dominates the fit) will necessarily give similar values for , whatever the PYTHIA charm cross section is.
The largest variation in the predicted muon yield at GeV/c per event is seen for simulations in which the intrinsic is varied from its default value ( GeV/c) to the value expected from arguments based on Fermi momentum (case 4c, GeV/c), or to a value which best reproduces the measured spectrum at higher (case 4d, GeV/c). These parameter sets also result in the largest variation in , as shown in Table 10. We use the cross section values obtained in this pair of simulations to define the systematic uncertainty in our measurement due to the uncertainty in our PYTHIA calculation. This gives us our final answer: mb.
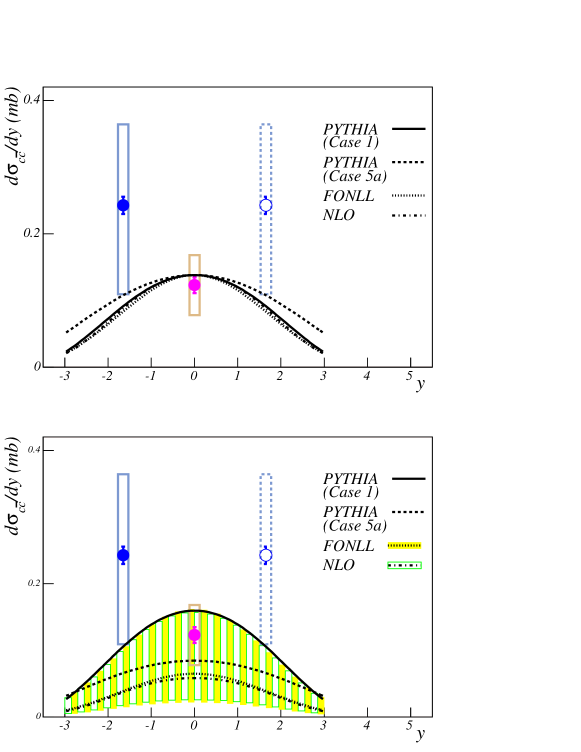
Figure 18 shows the PHENIX charm rapidity spectrum. The result of this analysis (mirrored about since this is a symmetric collision system) is plotted along with the result for A. Adare et al. (2006). In order to compare with the data at the systematic uncertainty on the data from this analysis is shown as the quadrature sum of the two sources of systematic uncertainty described above (data and PYTHIA). Theoretical curves from PYTHIA (case 1 and case 5a), FONLL Cacciari et al. (2005); Cacciari , and an NLO calculation from Vogt Vogt are also displayed.
In the top panel of the figure PYTHIA with the default parameter set (Case 1) is fit to the two PHENIX points with statistical and systematic errors added in quadrature. Other theory curves are normalized so that they are equal at in order to allow shape comparisons. As shown in Table 10, different PYTHIA parameter sets differ in the predicted ratio by . Unfortunately, current systematic error bars preclude any conclusions about the charm production rapidity shape.
In the bottom panel of the figure the theory curves are unnormalized to allow an absolute comparison. The quoted theoretical uncertainty bands for the FONLL and NLO calculations are also shown. We note that, although our data are above the FONLL prediction, the error bars touch. This is in contrast to the situation for the vertex-independent muon cross section, shown in Figure 16, where the data are significantly above the prediction. The larger disagreement in the vertex-independent muon cross section is presumably due to different treatment of the fragmentation process in PYTHIA and FONLL Cacciari et al. (2005); Vogt ; Cacciari .
V Conclusion and Outlook
We have measured muon production at forward rapidity (), in the range GeV/c, in GeV collisions at RHIC. We determined and subtracted the contribution from light hadron sources () to obtain the vertex-independent muon yield which, for the range measured in this analysis, and in the absence of new physics, arises dominantly from the decay of mesons. We normalized the PYTHIA muon spectrum resulting from the production of charm quarks to obtain the differential cross section for charm production at forward rapidity: mb. This is compatible with PHENIX charm measurement at , although even further above predictions from PYTHIA and FONLL. Large systematic uncertainties in the current measurement preclude statements about the rapidity dependence of the charm cross section.
The systematic uncertainty in the data is dominated by uncertainty on the determination of the fractional contribution of decay muons. This will be improved with higher statistics data sets (already collected) which will allow better measurements of the dependence of particle production. Final results for identified particle distributions in collisions by BRAHMS will also be invaluable for improving the input to our hadron generator. The systematic uncertainty in PYTHIA is dominated by differences observed when the intrinsic is varied. In order to reduce this uncertainty we need to reduce the allowed parameter space by improving the measurement of the high portion of the vertex-independent muon spectrum, where the error is dominated by the uncertainty in the yield of punchthrough hadrons. Data sets (already collected) with higher statistics, and with hadrons stopping in MuID gap 2, will allow a completely data-driven approach to the calculation of the punchthrough yield. This will eliminate the reliance on hadronic interaction simulation packages, differences in which are the largest source of systematic error at high . Analogous measurements are also being carried out for , , and X.R. Wang, for the PHENIX Collaboration (2006) collisions at GeV. These will allow determination of the magnitude of nuclear modification effects on charm production at forward rapidity.
VI Acknowledgements
We thank the staff of the Collider-Accelerator and Physics Departments at Brookhaven National Laboratory and the staff of the other PHENIX participating institutions for their vital contributions. We acknowledge support from the Department of Energy, Office of Science, Nuclear Physics Division, the National Science Foundation, Abilene Christian University Research Council, Research Foundation of SUNY, and Dean of the College of Arts and Sciences, Vanderbilt University (U.S.A), Ministry of Education, Culture, Sports, Science, and Technology and the Japan Society for the Promotion of Science (Japan), Conselho Nacional de Desenvolvimento Científico e Tecnológico and Fundação de Amparo à Pesquisa do Estado de São Paulo (Brazil), Natural Science Foundation of China (People’s Republic of China), Centre National de la Recherche Scientifique, Commissariat à l’Énergie Atomique, Institut National de Physique Nucléaire et de Physique des Particules, and Institut National de Physique Nucléaire et de Physique des Particules, (France), Bundesministerium für Bildung und Forschung, Deutscher Akademischer Austausch Dienst, and Alexander von Humboldt Stiftung (Germany), Hungarian National Science Fund, OTKA (Hungary), Department of Atomic Energy and Department of Science and Technology (India), Israel Science Foundation (Israel), Korea Research Foundation and Korea Science and Engineering Foundation (Korea), Russian Ministry of Industry, Science and Tekhnologies, Russian Academy of Science, Russian Ministry of Atomic Energy (Russia), VR and the Wallenberg Foundation (Sweden), the U.S. Civilian Research and Development Foundation for the Independent States of the Former Soviet Union, the US-Hungarian NSF-OTKA-MTA, the US-Israel Binational Science Foundation, and the 5th European Union TMR Marie-Curie Programme.
References
- Abbott et al. (2000) B. Abbott et al. (D0), Phys. Rev. Lett 84, 5478 (2000), eprint hep-ex/9907029.
- D. Acosta et al. (2005) D. Acosta et al. (CDF), Phys. Rev. D71, 032001 (2005), eprint hep-ex/0412071.
- M. Cacciari (2004) M. Cacciari (2004), eprint hep-ph/0407187.
- M. Cacciari and M. Greco and P. Nason (1998) M. Cacciari and M. Greco and P. Nason, JHEP 9805, 007 (1998), eprint hep-ph/9803400.
- M.L. Mangano (2004) M.L. Mangano (2004), eprint hep-ph/0411020.
- D. Acosta et al. (2003) D. Acosta et al. (CDF), Phys. Rev. Lett. 91, 241804 (2003), eprint hep-ex/0307080.
- Adcox et al. (2002) K. Adcox et al. (PHENIX), Phys. Rev. Lett. 88, 192303 (2002), eprint nucl-ex/0202002.
- S.S. Adler et al. (2005a) S.S. Adler et al. (PHENIX), Phys. Rev. Lett. 94, 082301 (2005a), eprint nucl-ex/0409028.
- S.S. Adler et al. (2006a) S.S. Adler et al. (PHENIX), Phys. Rev. Lett. 96, 032001 (2006a), eprint hep-ex/0508034.
- S. Kelly, for the PHENIX Collaboration (2004) S. Kelly, for the PHENIX Collaboration, J. Phys. G30, S1189 (2004), eprint nucl-ex/0403057.
- S.S. Adler et al. (2006b) S.S. Adler et al. (PHENIX), Phys. Rev. Lett. 96, 032301 (2006b), eprint nucl-ex/0510047.
- S. Butsyk, for the PHENIX Collaboration (2005) S. Butsyk, for the PHENIX Collaboration, Proceedings of Quark Matter 2005, to be published in Nucl. Phys. A (2005), eprint nucl-ex/0510010.
- A. Adare et al. (2006) A. Adare et al. (PHENIX) (2006), eprint hep-ex/0609010.
- S.S. Adler et al. (2005b) S.S. Adler et al. (PHENIX), Phys. Rev. C72, 024901 (2005b), eprint nucl-ex/052009.
- S. Sakai, for the PHENIX Collaboration (2005) S. Sakai, for the PHENIX Collaboration, Proceedings of Quark Matter 2005, to be published in Nucl. Phys. A (2005), eprint nucl-ex/0510027.
- Adare et al. (2006) A. Adare et al. (PHENIX), to be published (2006).
- Adams et al. (2005) J. Adams et al. (STAR), Phys. Rev. Lett 94, 062301 (2005), eprint nucl-ex/0407006.
- B.I. Abelev et al. (2006) B.I. Abelev et al. (STAR) (2006), eprint nucl-ex/0607012.
- T. Sjöstrand et al. (2001a) T. Sjöstrand et al., Comput. Phys. Commun. 135, 238 (2001a), eprint hep-ph/0010017.
- Cacciari et al. (2005) M. Cacciari, P. Nason, and R. Vogt, Phys. Rev. Lett. 95, 122001 (2005), eprint hep-ph/0502203.
- M.L. Mangano (1993) M.L. Mangano, Nucl. Phys. B405, 507 (1993).
- Vogt (2002) R. Vogt (2002), eprint hep-ph/0203151.
- Vogt (2003) R. Vogt, Int. J. Mod. Phys. E12, 211 (2003), eprint hep-ph/0111271.
- Cassing et al. (2001) W. Cassing, E. Bratkovskaya, and A. Sibirtsev, Nucl. Phys. A691, 753 (2001), eprint nucl-th/0010071.
- E.L. Bratkovskaya et al. (2003) E.L. Bratkovskaya, W. Cassing, and H. Stöcker, Phys. Rev. C67, 054905 (2003), eprint nucl-th/0301083.
- Wong (1994) C.-Y. Wong, Introduction to High-Energy Heavy-Ion Collisions (World Scientific Publishing Co. Pte. Ltd., 1994), p. 251.
- M.B. Johnson et al. (2001) M.B. Johnson et al. (E772), Phys. Rev. Lett. 86, 4483 (2001), eprint hep-ex/0010051.
- G.T. Bodwin et al. (1981) G.T. Bodwin, S.J. Brodsky, and G.P. Lepage, Phys. Rev. Lett. 47, 1799 (1981).
- G.T. Bodwin (1985) G.T. Bodwin, Phys. Rev. D31, 2616 (1985).
- G.T. Bodwin et al. (1989) G.T. Bodwin, S.J. Brodsky, and G.P. Lepage, Phys. Rev. D39, 3287 (1989).
- B.Z. Kopeliovich and Niedermayer (1984) B.Z. Kopeliovich and F. Niedermayer, Tech. Rep. E2-84-834, Dubna (1984), URL http://ccdb3fs.kek.jp/cgi-bin/img/allpdf?198504113.
- Gavin and Milana (1992) S. Gavin and J. Milana, Phys. Rev. Lett. 68, 1834 (1992).
- Guzey et al. (2004) V. Guzey, M. Strikman, and W. Vogelsang, Phys. Lett. B603, 173 (2004), eprint hep-ph/0407201.
- Y.L. Dokshitzer and D.E. Kharzeev (2001) Y.L. Dokshitzer and D.E. Kharzeev, Phys. Lett. B519, 199 (2001), eprint hep-ph/0106202.
- McLerran and Venugopalan (1994a) L. McLerran and R. Venugopalan, Phys. Rev. D49, 2233 (1994a).
- McLerran and Venugopalan (1994b) L. McLerran and R. Venugopalan, Phys. Rev. D49, 3352 (1994b).
- Ashman et al. (1988) J. Ashman et al. (EMC), Phys. Lett. B202, 603 (1988).
- Baier et al. (2000) R. Baier, D. Schiff, and B. Zakharov, Ann. Rev. Nucl. Part. Sci. 50, 37 (2000), eprint hep-ph/0002198.
- J.A. Appel (1992) J.A. Appel, Ann. Rev. Nucl. Part. Sci. 42, 367 (1992).
- B. Müller and X.N. Wang (1992) B. Müller and X.N. Wang, Phys. Rev. Lett. 68, 2437 (1992).
- Matsui and Satz (1986) T. Matsui and H. Satz, Phys. Lett. B178, 416 (1986).
- H. Satz (2006) H. Satz, J. Phys. G32, R25 (2006), eprint hep-ph/0512217.
- R.L. Thews and M.L. Mangano (2006) R.L. Thews and M.L. Mangano, Phys. Rev. C73, 014904 (2006), eprint nucl-th/0505055.
- L. Grandchamp, R. Rapp and G.E. Brown (2004) L. Grandchamp, R. Rapp and G.E. Brown, Phys. Rev. Lett. 92, 212301 (2004), eprint hep-ph/0306077.
- A. Andronic et al. (2003) A. Andronic et al., Phys. Lett. B571, 36 (2003), eprint nucl-th/0303036.
- A.P. Kostyuk et al. (2003) A.P. Kostyuk et al., Phys. Rev. C68, 041902(R) (2003), eprint hep-ph/0305277.
- S.S. Adler et al. (2005c) S.S. Adler et al. (PHENIX), Phys. Rev. Lett. 94, 082302 (2005c), eprint nucl-ex/0411054.
- Arsene et al. (2005) I. Arsene et al. (BRAHMS), Phys. Rev. Lett 94, 032301 (2005), eprint nucl-ex/0401025.
- Arsene et al. (2004) I. Arsene et al. (BRAHMS), Phys. Rev. Lett 93, 242303 (2004), eprint nucl-ex/0403005.
- Adams et al. (2006) J. Adams et al. (STAR) (2006), eprint nucl-ex/0602011.
- S.S. Adler et al. (2004) S.S. Adler et al. (PHENIX), Phys. Rev. Lett. 92, 051802 (2004), eprint hep-ex/0307019.
- S.S. Adler et al. (2006c) S.S. Adler et al. (PHENIX), Phys. Rev. Lett. 96, 012304 (2006c), eprint nucl-ex/0507032.
- H. Pereira Da Costa, for the PHENIX Collaboration (2005) H. Pereira Da Costa, for the PHENIX Collaboration, Proceedings of Quark Matter 2005, to be published in Nucl. Phys. A (2005), eprint nucl-ex/0510051.
- Adcox et al. (2003) K. Adcox et al. (PHENIX), Nucl. Instrum. Methods A499, 469 (2003).
- S.S. Adler et al. (2003a) S.S. Adler et al. (PHENIX), Nucl. Instrum. Methods A499, 560 (2003a).
- S.S. Adler et al. (2003b) S.S. Adler et al. (PHENIX), Nucl. Instrum. Methods A499, 593 (2003b).
- M. Allen et al. (2003) M. Allen et al. (PHENIX), Nucl. Instrum. Methods A499, 549 (2003).
- Akikawa et al. (2003) H. Akikawa et al. (PHENIX), Nucl. Instrum. Methods A499, 537 (2003).
- S.H. Aronson et al. (2003) S.H. Aronson et al. (PHENIX), Nucl. Instrum. Methods A499, 480 (2003).
- S.S. Adler et al. (2003c) S.S. Adler et al. (PHENIX), Phys. Rev. Lett. 91, 241803 (2003c), eprint hep-ex/0304038.
- GEA (1994) GEANT 3.2.1 Manual (1994), CERN W5013, URL http://wwwasdoc.web.cern.ch/wwwasdoc/pdfdir/geant.pdf.
- V.L. Highland (1975) V.L. Highland, Nucl. Instrum. Methods 129, 497 (1975).
- V.L. Highland (1979) V.L. Highland, Nucl. Instrum. Methods 161, 171 (1979).
- G.R. Lynch and O.I. Dahl (1991) G.R. Lynch and O.I. Dahl, Nucl. Instrum. Methods B58, 6 (1991).
- (65) S.S. Adler et al. (PHENIX), to be submitted to Phys. Rev. D.
- V. Ryabov, for the PHENIX Collaboration (2005) V. Ryabov, for the PHENIX Collaboration, Proceedings Quark Matter 2005, to be published in Nucl. Phys. A (2005), eprint hep-ex/0510017.
- Eidelman et al. (2004) S. Eidelman et al., Phys. Lett. B592, 1 (2004), URL http://pdg.lbl.gov.
- A. Fassò et al. (2001) A. Fassò et al., in Proceedings of the MonteCarlo 2000 Conference, Lisbon, October 23-26, 2000, edited by A. Kling et al. (Springer-Verlag, Berlin, 2001), p. 955, URL http://www.fluka.org.
- H.S. Fesefeldt (1985) H.S. Fesefeldt, Tech. Rep. PITHA 85/02, Aachen (1985).
- E.W. Cornell et al. (1994) E.W. Cornell et al., Nucl. Instrum. Methods A350, 150 (1994).
- G.A. Alves et al. (1996) G.A. Alves et al. (E769), Phys. Rev. Lett. 77, 2388 (1996).
- F.W. Büsser et al. (1976) F.W. Büsser et al., Nucl. Phys. B113, 189 (1976).
- Perez et al. (1982) P. Perez et al., Phys. Lett. B112, 260 (1982).
- Basile et al. (1981) M. Basile et al., Nuovo Cimento Soc. Ital. Fis. A65, 421 (1981).
- T. Sjöstrand et al. (2001b) T. Sjöstrand et al. (2001b), eprint hep-ph/0108264.
- H.L. Lai et al. (2000) H.L. Lai et al. (CTEQ), Eur. Phys. J C12, 375 (2000), eprint hep-ph/9903282.
- (77) M. Cacciari, private communication.
- H.L. Lai et al. (1997) H.L. Lai et al. (CTEQ), Phys. Rev. D55, 1280 (1997), eprint hep-ph/9606399.
- Gluck et al. (1995) M. Gluck, E. Reya, and R. Vogt, Z. Phys. C67, 433 (1995).
- Gluck et al. (1998) M. Gluck, E. Reya, and R. Vogt, Eur. Phys. J. C5, 461 (1998), eprint hep-ph/9806404.
- A.D. Martin et al. (2002) A.D. Martin et al., Eur. Phys. J. C23, 73 (2002), eprint hep-ph/0110215.
- A. Tai, for the STAR Collaboration (2004) A. Tai, for the STAR Collaboration, J. Phys. G30, S809 (2004), eprint nucl-ex/0404029.
- (83) R. Vogt, private communication.
- X.R. Wang, for the PHENIX Collaboration (2006) X.R. Wang, for the PHENIX Collaboration, Proceedings of Particles and Nuclei International Conference (PANIC) 2005, to be published in J. Phys. G (2006), eprint hep-ex/0603051.