and the Jefferson Lab Hall A Collaboration
A Search for , and Pentaquark States
Abstract
A high-resolution () search for narrow states () with masses of in , and electroproduction at small angles and low was performed. These states would be candidate partner states of the reported pentaquark. No statistically significant signal was observed in any of the channels at 90% C.L. Upper limits on forward production were determined to be between 0.8% and 4.9% of the production cross section, depending on the channel and the assumed mass and width of the state.
pacs:
12.39.Mk, 13.60.Rj, 13.60.-r, 14.20.Jn, 14.80.-jThe discovery of exotic baryonic states with positive strangeness, requiring a minimal configuration of four quarks and an antiquark, would contribute greatly to the understanding of confinement in Quantum Chromodynamics (QCD). Although searches for such states have been conducted for almost 40 years with both partial wave analyses of hadroproduction (e.g. Cool et al. (1966)) and electroproduction (e.g. Mori et al. (1969)), these early results have generally been interpreted as unconvincing Trippe et al. (1976). Recent claims of the observation of one such state, the Nakano et al. (2003) have generated renewed experimental and theoretical interest in this topic. For recent reviews of the experimental evidence, see Refs. Hicks (2005); Burkert (2006); Schumacher (2006). If confirmed, the could be the lowest-mass member of an antidecuplet of pentaquark states, predicted within the framework of the Chiral Quark Soliton Model Diakonov et al. (1997). Alternatively, such exotic baryons have been explained in terms of models based on diquark configurations Jaffe and Wilczek (2003), or in terms of isospin-violating strong decays, which lead to an isotensor multiplet of -pentaquarks of different charge states Capstick et al. (2003). If the pentaquark exists then other members of its symmetry group and/or other multiplets containing exotic states Arndt et al. (2004); Azimov et al. (2005) should be observable as well, provided they are sufficiently narrow. All of the approaches mentioned predict partner states in the mass region .
This paper reports on a high-resolution search at forward production angles for the and non-exotic members of the antidecuplet and for the exotic as narrow resonances in the missing mass spectra of the reactions , and , respectively. The measurements covered a limited range of small scattering angles, which did not allow a partial-wave analysis; however, both experimental indications Nakano et al. (2003) and theoretical expectations Kwee et al. (2005) are for the cross section to be forward peaked. One of the interesting features of the reported observations of the is that the measured width was either an upper limit from the experimental resolution or consistent with having a negligible width Hicks (2005). Based on this, the present measurement was specifically designed to be able to observe and determine the width of extremely narrow states. At large scattering angle, a recently reported search found no statistically significant evidence for the Kubarovsky et al. (2006). In the present experiment, very good mass resolution was achieved. Precise measurements of the known , and states were obtained for calibration.
The experiment took place in Hall A at Thomas Jefferson National Accelerator Facility (Jefferson Lab) using a electron beam incident on a 15 cm liquid hydrogen target. Scattered electrons were detected in one of the High-Resolution Spectrometers (HRS) Alcorn et al. (2004) in coincidence with electroproduced hadrons in the second HRS. Each spectrometer was positioned at relative to the electron beam by using a septum Brindza et al. (2001) magnet to achieve this small scattering angle. The spectrometers had an effective acceptance of approximately 4 msr in solid angle and in momentum. To obtain the desired missing mass coverage, the central momentum of the electron HRS was varied between 1.85 and 2.00 GeV, while the central momentum of the hadron HRS was changed between 1.89 and 2.10 GeV. In these configurations, the average momentum transfer of the virtual photon was , and the average center-of-mass (CM) photon energy was GeV. For the kaon (pion) kinematics, the center-of-mass scattering angle was (), and the angular acceptance was msr ( msr).
Both spectrometers have a QQDQ magnet arrangement with a upward bend. The detector packages, placed behind the magnetic elements, were equipped with four planes of drift chambers for tracking and two planes of hodoscopes for triggering. The electron spectrometer employed a CO2 gas Cherenkov counter and lead glass shower counters for pion rejection. For the kaon measurements, clean particle identification (PID) in the hadron spectrometer was particularly important because of the very high ratio of rates. With the use of two aerogel ( and ) and a ring-imaging Cherenkov detector (RICH) Iodice et al. (2005) in the hadron spectrometer less than 5% pion contamination in kaon events was achieved. A negligible pion contamination remained after additional separation using the coincidence timing between the hadron and electron signals. The aerogel counters and coincidence timing were also effective in removing any proton background.
The measured yields were corrected for detection and reconstruction efficiencies and dead-time. Cuts on the events from the PID detectors were applied to select appropriate particle types, and vertex and coincidence time cuts were used to reduce background from accidentals. The missing mass was reconstructed using the measured momenta of the electron and kaon (pion).
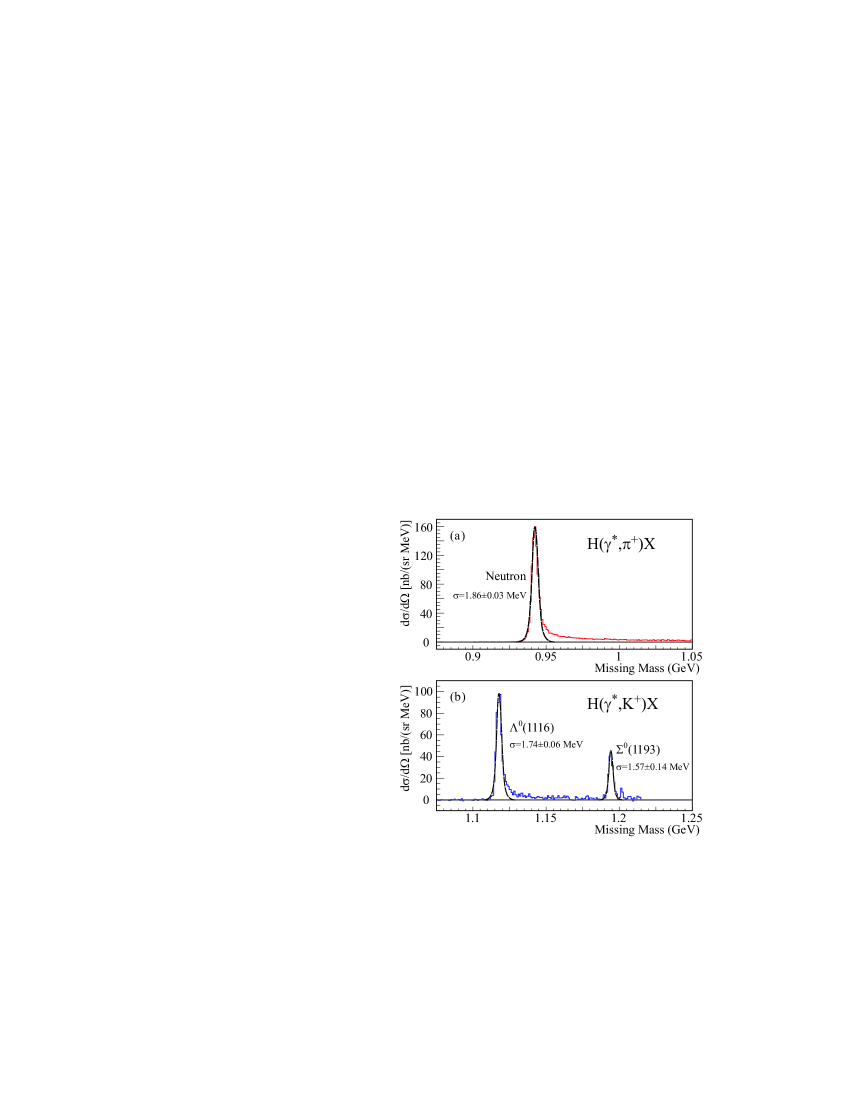
Calibration data were taken in the channel in the missing mass range which included the neutron and in the channel covering the missing mass range including the and . The missing mass resolution was determined by fitting the missing mass peaks for the neutron, and , as shown in Fig. 1. Based on the mass resolutions of these three peaks, the momentum resolutions of the left and right spectrometers were extracted. From these, the mass resolution in the region of interest was found to be . Also based on the fit masses of these well-known calibration states, the accuracy of the reconstructed missing mass was determined to be better than 3 MeV.
The photoproduction cross section of the was determined by fitting a Breit-Wigner with an energy dependent width Jackson (1964) and a non-interfering background to the missing mass spectra. From this fit, the cross section was determined to be nb/sr with a width of at . The largest systematic uncertainty arises from the absolute acceptance of each of the spectrometer arms for an extended target. From the fit, the mass was determined to be . Both the mass and width are in good agreement with the PDG averages Yao et al. (2006).
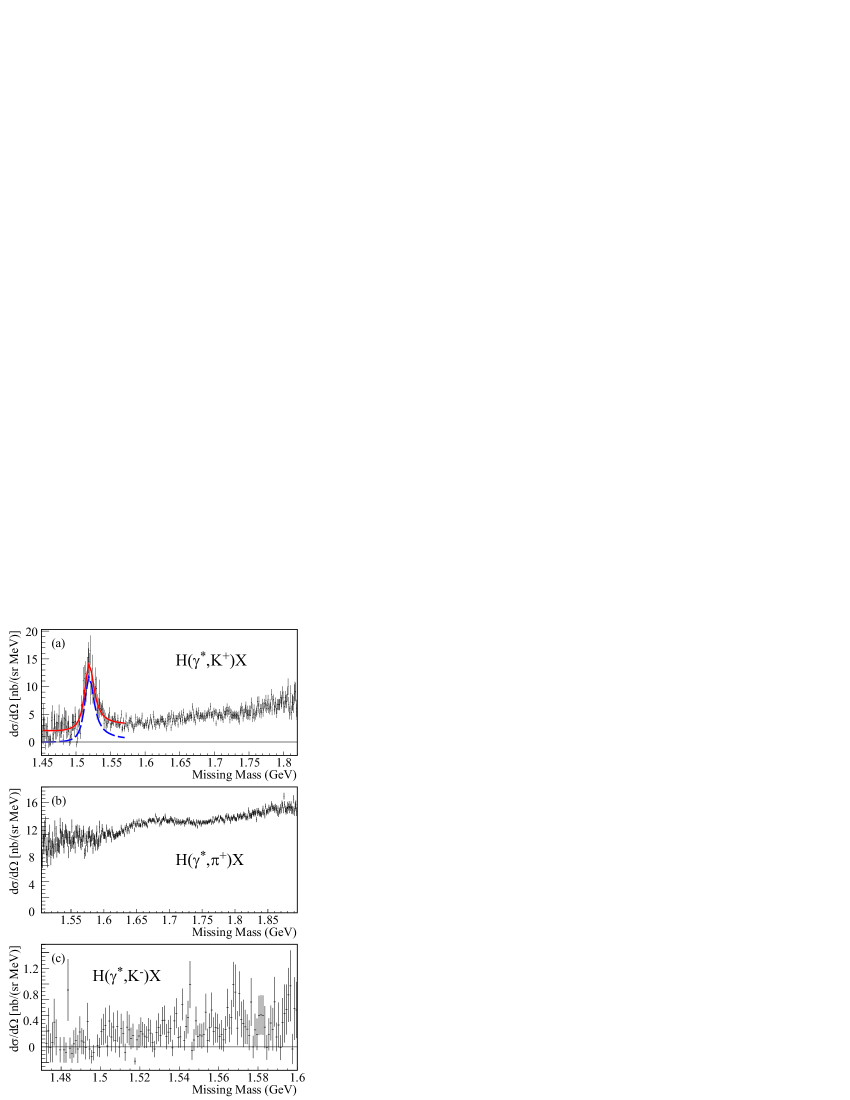
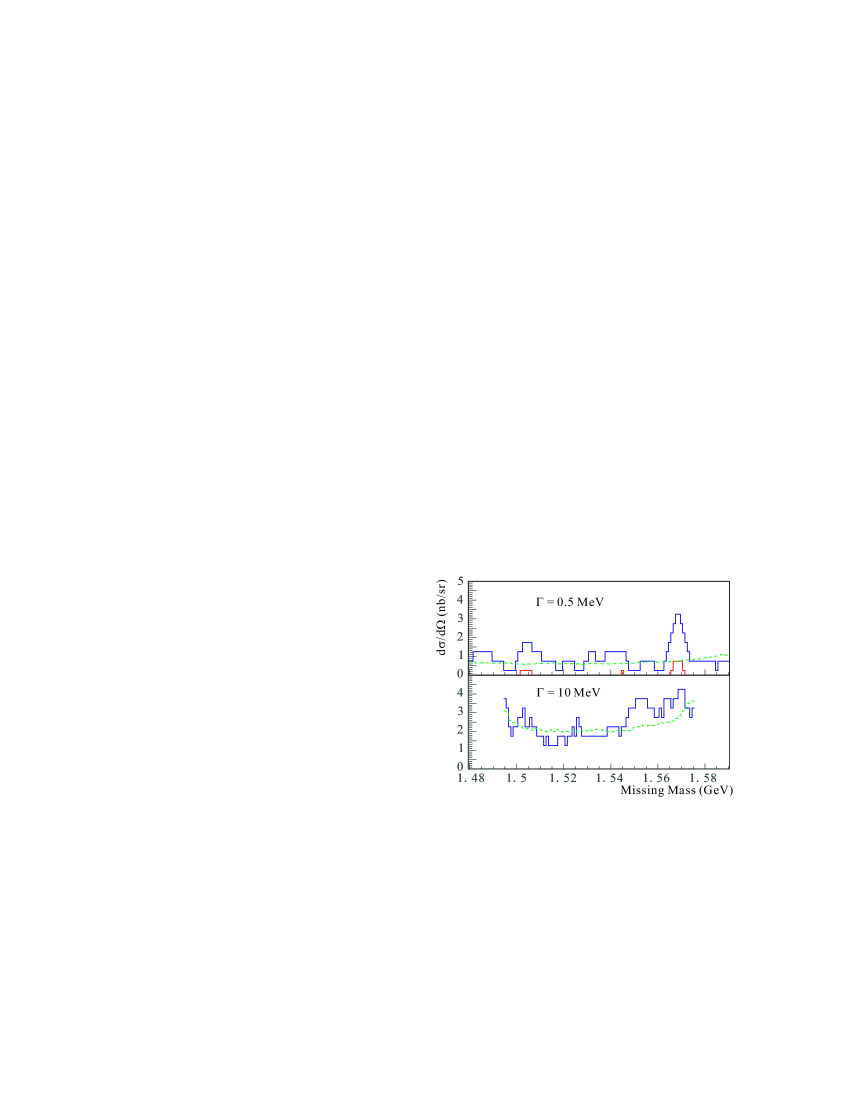
For each of the three possible pentaquark states, missing mass spectra from several (up to eight) different kinematic settings of the spectrometers were combined. The individual settings typically covered a range of approximately 130 MeV in missing mass. Each individual missing mass spectrum was transformed into a photoproduction cross section spectrum in the CM and the accidental coincidence background was subtracted. Combining the spectra required careful relative integrated luminosity normalizations and special attention to the acceptance weighting as a function of missing mass. The individual data sets overlapped to some extent, allowing for verification of the weighting and normalization. After finalizing the detector analysis, all transitions between spectrometer settings were found to be smooth, requiring no ad-hoc scaling. These spectra are shown in Fig. 2.
Within each of the search regions, for the , for the and for the , the data were examined for the existence of narrow resonances. A scan was performed in 1 MeV steps over each search region. For each mass, , and width, , the goal was to determine a range in the cross section of a hypothetical resonance that would be compatible with the missing mass spectrum at 90% confidence, with no a priori assumption of a non-zero resonance cross section. To accomplish this, the Feldman and Cousins Feldman and Cousins (1998) approach was adopted. The procedure outlined below was repeated for widths of 0.5, 2, 5 and 10 MeV.
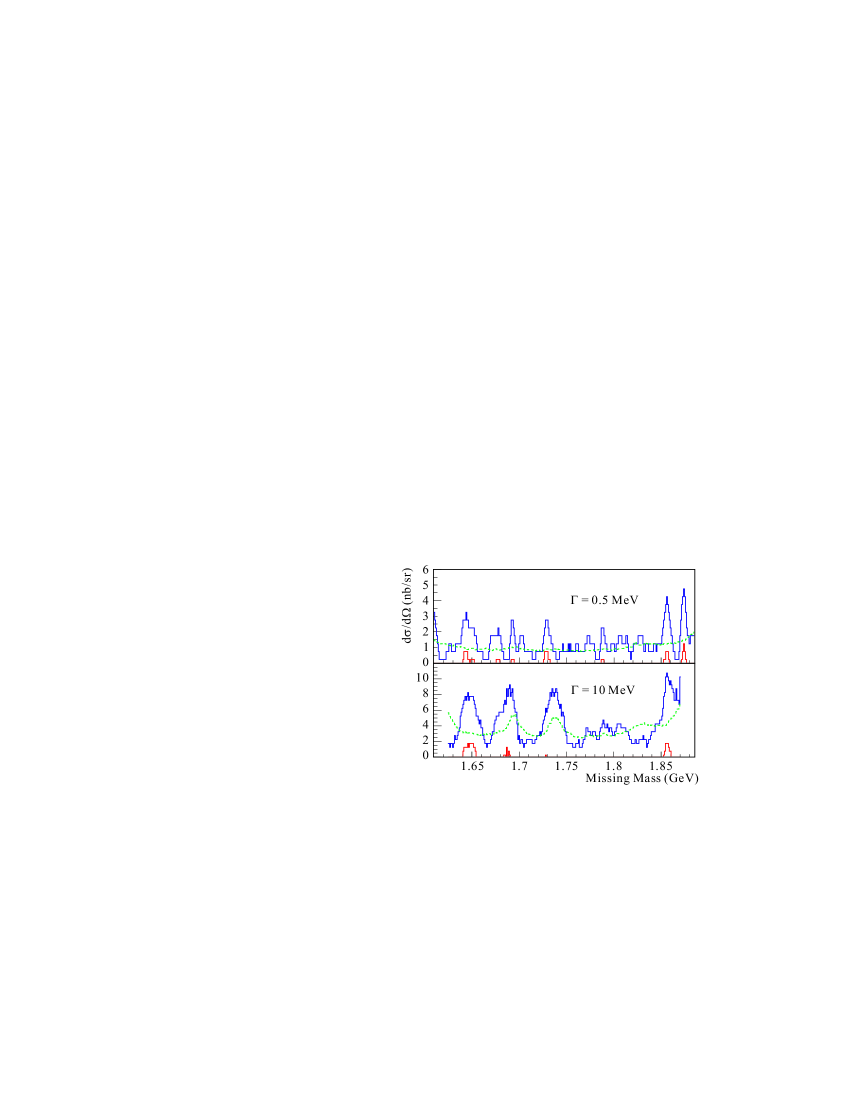
For a given missing mass, , the first step was to establish the level of background by fitting the 20 MeV wide sidebands above and below the region containing 90% of a hypothesized peak at with width . When was near the edge of the acceptance, the side band near the edge was reduced, to a minimum of 5 MeV. With the background level fixed, the data were fit to a Breit-Wigner at and width convoluted with a wide Gaussian (instrumental resolution) plus the fixed background within the same window. The only free parameter in this fit was the cross section of the Breit-Wigner resonance, , the most likely cross section, of the possible resonance. Because of the paucity of events in some bins for some spectrometer settings, all fits used maximum likelihood techniques Feldman and Cousins (1998); Baker and Cousins (1984). The range in cross section, , accepted at 90% confidence was found by examining deviations in the log likelihood, , as a function of from its best value, . The limit in of the 90% confidence region was established by Monte Carlo. For a given assumed cross section, , many Monte Carlo “experiments” were performed. Missing mass spectra for each spectrometer setting were randomly populated with total statistics equal to that of the actual data. The spectral shape was based on the smoothed background shape determined in the data analysis with a hypothetical resonance of cross section added. From each Monte Carlo “experiment”, , the difference between the hypothetical resonance’s cross section and the best fit of the Monte Carlo spectra was determined. The distribution of ’s from the Monte Carlo “experiments” was examined to determine such that 90% of the Monte Carlo simulations had 111Recall (in the large statistic limit, ).. If , then was within the region accepted with 90% confidence. In addition, curves indicating the 90% probability of background fluctuations were generated using a similar technique as suggested by Feldman and Cousins Feldman and Cousins (1998). The upper limit, lower limit and statistical sensitivity curves are shown in Figs. 3, 4 and 5 for the and cases. The maximum upper limits listed in Tab. 1 are expressed for each resonance in nb/sr and as a fraction of the cross section.
| (MeV) | (nb/sr) | % | (nb/sr) | % | (nb/sr) | % |
|---|---|---|---|---|---|---|
| 0.5 | 10.0 | 2.8 | 4.5 | 1.3 | 3.0 | 0.8 |
| 2.0 | 11.0 | 3.1 | 5.5 | 1.5 | 3.5 | 1.0 |
| 5.0 | 13.0 | 3.7 | 6.0 | 1.7 | 3.5 | 1.0 |
| 10.0 | 17.5 | 4.9 | 10.5 | 2.9 | 4.0 | 1.1 |
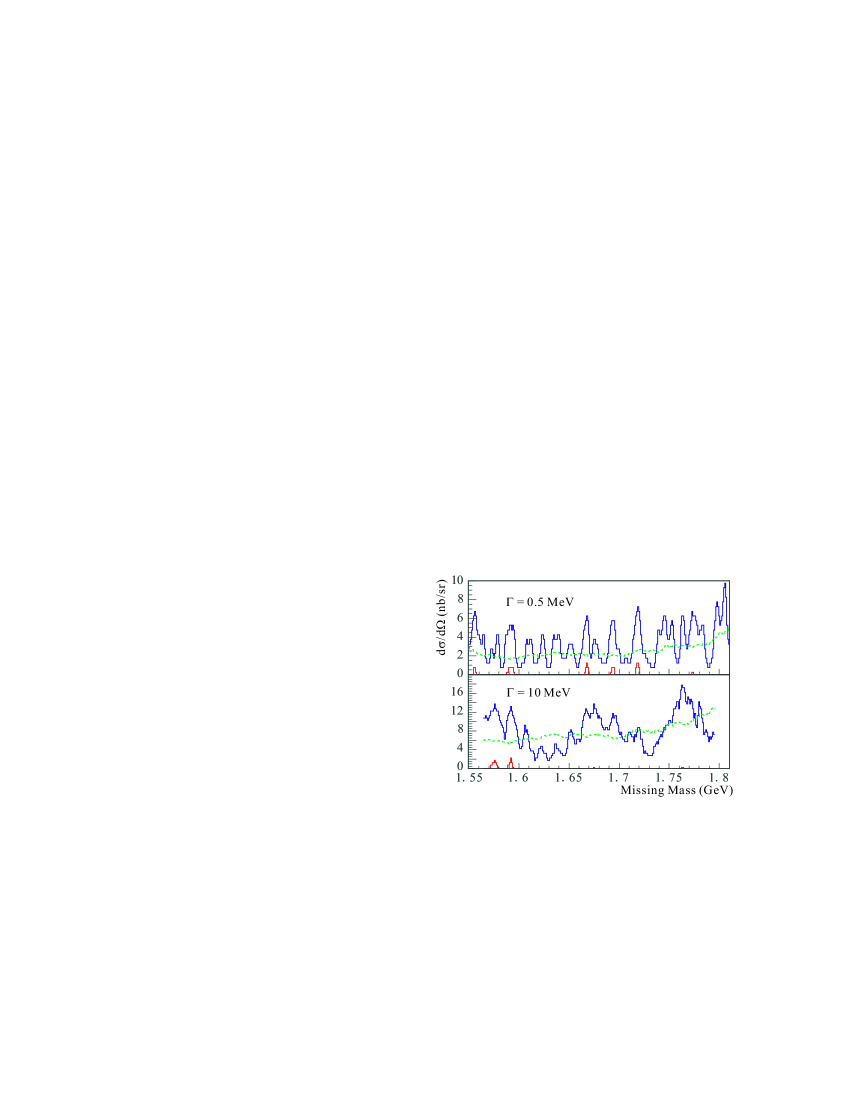
As can be seen in Figs. 3, 4 and 5 most of the 90% confidence region shows only upper limits and the upper limit curves oscillate about the statistical sensitivity curves. Where the lower limit curves are different from zero, they are always below the sensitivity curves implying that none of the lower limits can be distinguished from a statistical fluctuation.
There are several known or suspected resonances in this mass region, in particular several 3 or 4-star and states in the channel Yao et al. (2006). Most are too wide () to be visible in this experiment (unless they have a substantial cross section) or have only been seen in partial-wave analyses or both. Taken together, they add up to a relatively smooth background.
In conclusion, a high resolution search for the , and has been completed using the Jefferson Lab Hall A HRS spectrometers. This search had an instrumental resolution of . No statistically significant narrow () structures were observed in any of the three reaction channels. Upper limits of the photoproduction cross section for these states were found to be of the photoproduction cross section for at 90% C.L.
We would like to acknowledge the outstanding efforts of the Jefferson Lab Hall A technical staff that made this work possible. We are grateful to W.J. Briscoe, W. Dunwoodie, M. Polyakov and M. Vanderhaeghen for useful discussions in planning these measurements. This work was supported in part by the Italian Istituto Nazionale di Fisica Nucleare (INFN), Russian State Grant RSGSS-1124.2003.2, the U.S.-Israeli Binational Science Foundation, U.S. National Science Foundation and the U.S. Department of Energy, Office of Nuclear Physics under contracts DE-AC02-06CH11357, DE-FG02-99ER41110 and DE-AC05-84150, Modification No. M175, under which the Southeastern Universities Research Association (SURA) operates the Thomas Jefferson National Accelerator Facility.
References
- Cool et al. (1966) R. L. Cool et al., Phys. Rev. Lett. 17, 102 (1966).
- Mori et al. (1969) S. Mori et al., Phys. Rev. 185, 1687 (1969).
- Trippe et al. (1976) T. G. Trippe et al. (Particle Data Group), Rev. Mod. Phys. 48, S1 (1976).
- Nakano et al. (2003) T. Nakano et al. (LEPS), Phys. Rev. Lett. 91, 012002 (2003), eprint hep-ex/0301020.
- Hicks (2005) K. H. Hicks, Prog. Part. Nucl. Phys. 55, 647 (2005), eprint hep-ex/0504027.
- Burkert (2006) V. D. Burkert, Int. J. Mod. Phys. A21, 1764 (2006), eprint hep-ph/0510309.
- Schumacher (2006) R. A. Schumacher, AIP Conf. Proc. 842, 409 (2006), eprint nucl-ex/0512042.
- Diakonov et al. (1997) D. Diakonov, V. Petrov, and M. V. Polyakov, Z. Phys. A359, 305 (1997), eprint hep-ph/9703373.
- Jaffe and Wilczek (2003) R. L. Jaffe and F. Wilczek, Phys. Rev. Lett. 91, 232003 (2003), eprint hep-ph/0307341.
- Capstick et al. (2003) S. Capstick, P. R. Page, and W. Roberts, Phys. Lett. B570, 185 (2003), eprint hep-ph/0307019.
- Arndt et al. (2004) R. A. Arndt et al., Phys. Rev. C69, 035208 (2004), eprint nucl-th/0312126.
- Azimov et al. (2005) Y. I. Azimov et al., Eur. Phys. J. A26, 79 (2005), eprint hep-ph/0504022.
- Kwee et al. (2005) H. Kwee, M. Guidal, M. V. Polyakov, and M. Vanderhaeghen, Phys. Rev. D72, 054012 (2005), eprint hep-ph/0507180.
- Kubarovsky et al. (2006) V. Kubarovsky et al. (CLAS), Phys. Rev. Lett. 97, 102001 (2006), eprint hep-ex/0605001.
- Alcorn et al. (2004) J. Alcorn et al., Nucl. Instrum. Meth. A522, 294 (2004).
- Brindza et al. (2001) P. Brindza et al., IEEE Trans. Appl. Superconductivity 11, 1594 (2001).
- Iodice et al. (2005) M. Iodice et al., Nucl. Instrum. Meth. A553, 231 (2005).
- Jackson (1964) J. D. Jackson, Nuovo Cim. 34, 1644 (1964).
- Yao et al. (2006) W. M. Yao et al. (Particle Data Group), J. Phys. G33, 1 (2006).
- Feldman and Cousins (1998) G. J. Feldman and R. D. Cousins, Phys. Rev. D57, 3873 (1998), eprint physics/9711021.
- Baker and Cousins (1984) S. Baker and R. D. Cousins, Nucl. Instrum. Meth. A221, 437 (1984).