Improved Measurements of Branching Fractions and Partial Rate Asymmetries for and
C.-M. Jen
Department of Physics, National Taiwan University, Taipei
P. Chang
Department of Physics, National Taiwan University, Taipei
K. Abe
High Energy Accelerator Research Organization (KEK), Tsukuba
K. Abe
Tohoku Gakuin University, Tagajo
I. Adachi
High Energy Accelerator Research Organization (KEK), Tsukuba
H. Aihara
Department of Physics, University of Tokyo, Tokyo
D. Anipko
Budker Institute of Nuclear Physics, Novosibirsk
K. Arinstein
Budker Institute of Nuclear Physics, Novosibirsk
V. Aulchenko
Budker Institute of Nuclear Physics, Novosibirsk
A. M. Bakich
University of Sydney, Sydney NSW
E. Barberio
University of Melbourne, Victoria
M. Barbero
University of Hawaii, Honolulu, Hawaii 96822
A. Bay
Swiss Federal Institute of Technology of Lausanne, EPFL, Lausanne
I. Bedny
Budker Institute of Nuclear Physics, Novosibirsk
K. Belous
Institute of High Energy Physics, Protvino
U. Bitenc
J. Stefan Institute, Ljubljana
I. Bizjak
J. Stefan Institute, Ljubljana
A. Bondar
Budker Institute of Nuclear Physics, Novosibirsk
A. Bozek
H. Niewodniczanski Institute of Nuclear Physics, Krakow
M. Bračko
High Energy Accelerator Research Organization (KEK), Tsukuba
University of Maribor, Maribor
J. Stefan Institute, Ljubljana
T. E. Browder
University of Hawaii, Honolulu, Hawaii 96822
A. Chen
National Central University, Chung-li
W. T. Chen
National Central University, Chung-li
B. G. Cheon
Chonnam National University, Kwangju
S.-K. Choi
Gyeongsang National University, Chinju
Y. Choi
Sungkyunkwan University, Suwon
Y. K. Choi
Sungkyunkwan University, Suwon
A. Chuvikov
Princeton University, Princeton, New Jersey 08544
S. Cole
University of Sydney, Sydney NSW
J. Dalseno
University of Melbourne, Victoria
M. Dash
Virginia Polytechnic Institute and State University, Blacksburg, Virginia 24061
A. Drutskoy
University of Cincinnati, Cincinnati, Ohio 45221
S. Eidelman
Budker Institute of Nuclear Physics, Novosibirsk
D. Epifanov
Budker Institute of Nuclear Physics, Novosibirsk
S. Fratina
J. Stefan Institute, Ljubljana
N. Gabyshev
Budker Institute of Nuclear Physics, Novosibirsk
T. Gershon
High Energy Accelerator Research Organization (KEK), Tsukuba
A. Go
National Central University, Chung-li
G. Gokhroo
Tata Institute of Fundamental Research, Bombay
B. Golob
University of Ljubljana, Ljubljana
J. Stefan Institute, Ljubljana
H. Ha
Korea University, Seoul
J. Haba
High Energy Accelerator Research Organization (KEK), Tsukuba
T. Hara
Osaka University, Osaka
K. Hayasaka
Nagoya University, Nagoya
H. Hayashii
Nara Women’s University, Nara
M. Hazumi
High Energy Accelerator Research Organization (KEK), Tsukuba
D. Heffernan
Osaka University, Osaka
Y. Hoshi
Tohoku Gakuin University, Tagajo
S. Hou
National Central University, Chung-li
W.-S. Hou
Department of Physics, National Taiwan University, Taipei
Y. B. Hsiung
Department of Physics, National Taiwan University, Taipei
T. Iijima
Nagoya University, Nagoya
K. Inami
Nagoya University, Nagoya
A. Ishikawa
Department of Physics, University of Tokyo, Tokyo
R. Itoh
High Energy Accelerator Research Organization (KEK), Tsukuba
M. Iwasaki
Department of Physics, University of Tokyo, Tokyo
Y. Iwasaki
High Energy Accelerator Research Organization (KEK), Tsukuba
J. H. Kang
Yonsei University, Seoul
P. Kapusta
H. Niewodniczanski Institute of Nuclear Physics, Krakow
N. Katayama
High Energy Accelerator Research Organization (KEK), Tsukuba
H. Kawai
Chiba University, Chiba
T. Kawasaki
Niigata University, Niigata
H. R. Khan
Tokyo Institute of Technology, Tokyo
H. Kichimi
High Energy Accelerator Research Organization (KEK), Tsukuba
H. J. Kim
Kyungpook National University, Taegu
Y. J. Kim
The Graduate University for Advanced Studies, Hayama, Japan
P. Križan
University of Ljubljana, Ljubljana
J. Stefan Institute, Ljubljana
P. Krokovny
High Energy Accelerator Research Organization (KEK), Tsukuba
R. Kulasiri
University of Cincinnati, Cincinnati, Ohio 45221
R. Kumar
Panjab University, Chandigarh
C. C. Kuo
National Central University, Chung-li
A. Kuzmin
Budker Institute of Nuclear Physics, Novosibirsk
Y.-J. Kwon
Yonsei University, Seoul
G. Leder
Institute of High Energy Physics, Vienna
S. E. Lee
Seoul National University, Seoul
Y.-J. Lee
Department of Physics, National Taiwan University, Taipei
T. Lesiak
H. Niewodniczanski Institute of Nuclear Physics, Krakow
S.-W. Lin
Department of Physics, National Taiwan University, Taipei
D. Liventsev
Institute for Theoretical and Experimental Physics, Moscow
F. Mandl
Institute of High Energy Physics, Vienna
T. Matsumoto
Tokyo Metropolitan University, Tokyo
S. McOnie
University of Sydney, Sydney NSW
W. Mitaroff
Institute of High Energy Physics, Vienna
H. Miyake
Osaka University, Osaka
H. Miyata
Niigata University, Niigata
Y. Miyazaki
Nagoya University, Nagoya
T. Nagamine
Tohoku University, Sendai
Y. Nagasaka
Hiroshima Institute of Technology, Hiroshima
E. Nakano
Osaka City University, Osaka
M. Nakao
High Energy Accelerator Research Organization (KEK), Tsukuba
Z. Natkaniec
H. Niewodniczanski Institute of Nuclear Physics, Krakow
S. Nishida
High Energy Accelerator Research Organization (KEK), Tsukuba
O. Nitoh
Tokyo University of Agriculture and Technology, Tokyo
T. Nozaki
High Energy Accelerator Research Organization (KEK), Tsukuba
S. Ogawa
Toho University, Funabashi
T. Ohshima
Nagoya University, Nagoya
S. Okuno
Kanagawa University, Yokohama
Y. Onuki
Niigata University, Niigata
H. Ozaki
High Energy Accelerator Research Organization (KEK), Tsukuba
H. Palka
H. Niewodniczanski Institute of Nuclear Physics, Krakow
C. W. Park
Sungkyunkwan University, Suwon
H. Park
Kyungpook National University, Taegu
L. S. Peak
University of Sydney, Sydney NSW
R. Pestotnik
J. Stefan Institute, Ljubljana
L. E. Piilonen
Virginia Polytechnic Institute and State University, Blacksburg, Virginia 24061
A. Poluektov
Budker Institute of Nuclear Physics, Novosibirsk
Y. Sakai
High Energy Accelerator Research Organization (KEK), Tsukuba
T. Schietinger
Swiss Federal Institute of Technology of Lausanne, EPFL, Lausanne
O. Schneider
Swiss Federal Institute of Technology of Lausanne, EPFL, Lausanne
A. J. Schwartz
University of Cincinnati, Cincinnati, Ohio 45221
R. Seidl
University of Illinois at Urbana-Champaign, Urbana, Illinois 61801
RIKEN BNL Research Center, Upton, New York 11973
M. E. Sevior
University of Melbourne, Victoria
M. Shapkin
Institute of High Energy Physics, Protvino
H. Shibuya
Toho University, Funabashi
B. Shwartz
Budker Institute of Nuclear Physics, Novosibirsk
A. Somov
University of Cincinnati, Cincinnati, Ohio 45221
N. Soni
Panjab University, Chandigarh
S. Stanič
University of Nova Gorica, Nova Gorica
H. Stoeck
University of Sydney, Sydney NSW
T. Sumiyoshi
Tokyo Metropolitan University, Tokyo
F. Takasaki
High Energy Accelerator Research Organization (KEK), Tsukuba
K. Tamai
High Energy Accelerator Research Organization (KEK), Tsukuba
M. Tanaka
High Energy Accelerator Research Organization (KEK), Tsukuba
G. N. Taylor
University of Melbourne, Victoria
Y. Teramoto
Osaka City University, Osaka
X. C. Tian
Peking University, Beijing
T. Tsukamoto
High Energy Accelerator Research Organization (KEK), Tsukuba
S. Uehara
High Energy Accelerator Research Organization (KEK), Tsukuba
T. Uglov
Institute for Theoretical and Experimental Physics, Moscow
S. Uno
High Energy Accelerator Research Organization (KEK), Tsukuba
P. Urquijo
University of Melbourne, Victoria
Y. Usov
Budker Institute of Nuclear Physics, Novosibirsk
G. Varner
University of Hawaii, Honolulu, Hawaii 96822
K. E. Varvell
University of Sydney, Sydney NSW
S. Villa
Swiss Federal Institute of Technology of Lausanne, EPFL, Lausanne
C. C. Wang
Department of Physics, National Taiwan University, Taipei
C. H. Wang
National United University, Miao Li
M.-Z. Wang
Department of Physics, National Taiwan University, Taipei
Y. Watanabe
Tokyo Institute of Technology, Tokyo
E. Won
Korea University, Seoul
A. Yamaguchi
Tohoku University, Sendai
Y. Yamashita
Nippon Dental University, Niigata
M. Yamauchi
High Energy Accelerator Research Organization (KEK), Tsukuba
L. M. Zhang
University of Science and Technology of China, Hefei
Z. P. Zhang
University of Science and Technology of China, Hefei
V. Zhilich
Budker Institute of Nuclear Physics, Novosibirsk
A. Zupanc
J. Stefan Institute, Ljubljana
Abstract
We report improved measurements of to pseudoscalar-vector decays containing an meson in the final state.
Our results are obtained from a data sample that contains pairs accumulated at the
resonance, with the Belle detector at the KEKB asymmetric-energy collider. We measure the
following branching fractions:
,
, and
The partial width ratio = . We also set the % confidence level upper limit
In addition, we obtain the partial rate asymmetries
for , and for .
pacs:
11.30.Er,13.25.Hw
††preprint: Belle Preprint 2006-23KEK Preprint 2006-24
Charmless hadronic decays provide a rich ground to understand the dynamics of meson decays and the origin of violation.
Two-body decays with a vector meson and a pseudoscalar particle ( is either a kaon or a pion) proceed through combinations of
color-allowed () and color-suppressed () tree diagrams and
() or () penguin diagrams. For example, proceeds through , and ,
proceeds through , proceeds through , and , and
proceeds through and . The QCD factorization (QCDF) approach suggests that the branching fractions of
decays are in the range – QCDF . The predicted and
are enhanced after including the rescattering effect from final-state interactions QCDF2 . The
perturbative QCD (PQCD) approach, on the other hand, suggests that , and
, and that ,
and after considering next-to-leading-order accuracy PQCD .
Due to the lack of and diagrams, is expected to be small QCDF ; PQCD2 . Experimentally, clear signals
have been observed for , and with similar branching fractions chwang ; babar ; babar2 ; babar3 .
However, experimental measurements to date are not yet precise enough for a quantitative confirmation of the pattern predicted by QCDF or PQCD.
In this paper, we report improved measurements of branching fractions and partial rate asymmetries for decays, where can
be a kaon or pion. The partial rate asymmetry () is measured for the charged decays and defined to be
(1)
These measurements are based on a data sample of pairs collected with the Belle detector at the KEKB KEKB
asymmetric-energy collider. They improve upon our previously published results chwang by a five-fold increase in statistics and
supersede them.
The Belle detector is a large-solid-angle magnetic spectrometer that consists of a silicon vertex detector (SVD), a 50-layer
central drift chamber (CDC), an array of aerogel threshold Čerenkov counters (ACC), a barrel-like arrangement of time-of-flight scintillation
counters (TOF), and an electromagnetic calorimeter (ECL) comprised of CsI(Tl) crystals located inside a superconducting solenoid coil that provides a
magnetic field. An iron flux-return located outside of the coil is instrumented to detect mesons and to identify muons
(KLM). The detector is described in detail elsewhere Belle . In August 2003, the three-layer SVD was replaced by a four-layer radiation
tolerant device. The data sample for this analysis consists of of data recorded with a three-layer
SVD (Set I) Belle and recorded with a four-layer SVD (Set II) SVD2 .
Hadronic events are selected using criteria based on the charged track multiplicity and total visible energy, with an efficiency greater than
% for generic events. All primary charged tracks must satisfy quality requirements based on their impact parameters relative
to the run-dependent interaction point (IP). For tracks from the candidate mesons, their deviations from the IP position are required to be
within in the transverse direction and in the longitudinal direction.
Charged particle identification is performed using a - likelihood ratio, /(),
where () is the likelihood for a charged particle to be a kaon (pion) based on information from the ACC,
TOF and CDC. Charged tracks with are identified as kaons, and tracks with
are identified as pions. With these criteria, kaons produced in decays are selected with an efficiency of %,
while the corresponding rate of kaons that are misidentified as pions is %. On the other hand, pions from are
selected with an efficiency of % and have a corresponding kaon misidentification rate of %.
Candidate mesons are reconstructed from pairs of photons with an invariant mass in the range of
(within around the PDG value PDG ).
The cosine of the decay angle should satisfy , where is the angle between the photon decay axis
and the negative of the laboratory frame direction in the rest frame. Candidate mesons are reconstructed using pairs of
oppositely charged tracks that have an invariant mass in the range of
(within around the PDG value PDG ). The vertex of the candidate is required to be well reconstructed and
displaced from the IP, and the momentum direction must be consistent with the flight direction. Candidate
decays are reconstructed from charged tracks with (this requirement has a %
efficiency per track), and from candidates with center-of-mass frame (CM) momenta greater than .
Candidate mesons are required to have invariant masses within () of the PDG value PDG .
meson candidates are formed by combining an meson with either a kaon (, ) or a pion (, ).
Two kinematic variables are used to select candidates: the beam-energy constrained mass =
, and the energy difference , where
is the beam energy in the CM frame, and , are the momentum and
energy, respectively, of the candidate in the CM frame. Candidates with and
( for ) are selected for further analysis.
The dominant background arises from quark-antiquark continuum events (, ,,,). The continuum background
is characterized by a jet-like structure, while the events have a more spherical distribution. The following event-shape variables
calculated in the CM frame are employed to suppress the continuum. The thrust angle is defined as the angle between
the thrust axis thrust of the candidate daughter particles and that of the rest of the particles in an event. Signal events are uniformly
distributed in , while continuum events are sharply peaked near . Events with
are selected.
A Fisher discriminant is formed by combining a set of modified Fox-Wolfram moments SFW with the variable sper . This variable
is the scalar sum of the transverse momenta of particles outside a cone around the thrust axis, divided by the scalar sum of
their momenta. Here, the transverse momenta are calculated with respect to the thrust axis, and we do not include daughters of the candidate.
Further variables that have been found to separate signal from continuum background include: the cosine of the angle between the flight
direction of the candidate and the beam direction (); the distance along the beam direction between the vertex and
the vertex of the remaining particles in the event (); and the cosine of the helicity angle, defined as the angle
between the direction opposite to the flight direction in the rest frame and the direction normal to the plane
defined by the three daughter pions of the . The probability density functions (PDFs) for these three variables and the Fisher discriminant
are obtained using Monte Carlo (MC) simulation for signal events and sideband data () for backgrounds.
These variables are combined to form a likelihood ratio , where
is the product of signal () PDFs.
Additional background discrimination is provided by the quality of the flavor tagging of the accompanying meson. We use the standard
Belle tagging package TaggingNIM , which gives two outputs: a discrete variable () indicating the flavor, and a dilution factor
() ranging from zero for no flavor information to unity for unambiguous flavor assignment. We divide the data into six regions. Continuum
suppression is achieved by applying a mode-dependent requirement on for events in each region based on the figure-of-merit:
, where is the expected number of signal events
estimated from simulation and our previously published branching fractions chwang , and is the number of background
events estimated from sideband data (). This requirement retains %, %, %,
and % of the signal while rejecting %, %, %, and % of the continuum background for the ,
, , and modes, respectively.
Simulation studies indicate small backgrounds from generic transitions in the charged modes; they are found to be negligible for
the neutral modes. Two additional backgrounds have also been considered: reflections of decays due to
misidentification, and feed-down from other charmless decays, predominantly and . We include
these three components in the fit used to extract the signal.
The signal yields and partial rate asymmetries are obtained using an extended unbinned maximum likelihood (ML) fit for and .
The likelihood is defined as
(2)
where is the identifier of the -th event, is the PDF of and ,
is the number of events for category , which corresponds to either signal, background, reflections due to - misidentification,
or background ( and charmless). There is no reflection component or background for the neutral modes.
The signal distribution in is parameterized by a Gaussian function centered near the mass of the meson, while the
Crystal Ball line shape crystal is used to model the distribution. Both functions are calibrated with large
control samples of , , and ,
, decays. The continuum PDF is the product of a first-order polynomial for
and an ARGUS function argus for . All parameters of the continuum PDF are allowed to float in the fit except for
the endpoint of the ARGUS function, which is determined using the sample. Other background PDFs are modelled by
a smoothed two-dimensional function obtained from MC simulation. The yields of the continuum and backgrounds
are floated in the fit, except for the reflection component. The normalizations of the reflection components are fixed to expectations based
on the and branching fractions, as well as fake rates. The
reflection yields are first calculated according to the assumed branching fractions and then re-estimated based on our measured
results from the fit. After a few iterations, the reflection yields converge. For the charged modes, we perform independent fits to the
and samples in order to extract according to Eq. 1.
Figure 1 shows the data and fit results for each mode. Table 1 lists the resulting event yields, efficiencies,
corresponding branching fractions and . These new results are consistent with those measured by BaBar babar3 .
The branching fractions are computed as the sum of the yields divided by the corresponding efficiencies in each dataset and the total number
of mesons. The reconstruction efficiency for each mode includes all intermediate branching fractions and is defined as
the fraction of the signal yield remaining after all selection criteria, where the yield is determined by performing the unbinned maximum
likelihood fit on a MC sample. Small correction factors are included to account for differences in the reconstruction efficiency between MC
and data. The correction factor is obtained as a result of the relative reconstruction ( for Set I and for Set II)
using the inclusive and samples. The corresponding systematic error
is %. We determine the identification efficiency of charged kaons and pions by studying an inclusive ,
sample. This selection criterion leads to a correction factor within the range of – and
a corresponding systematic error of % for charged modes and % for neutral modes.
Table 1: Signal efficiency (), signal yield (), significance including systematic error
(), branching fraction (), the % C.L. upper limit (U.L.) and partial rate
asymmetry () for the decays. The first and second errors are statistical and
systematic, respectively.
Mode
(%)
()
()
19.5
17.1
9.3
1.5
Table 2: systematic uncertainties for and (%).
Mode
track reconstruction
3.0
3.0
4.0
2.0
requirement
2.5
2.6
2.5
3.3
particle identification
1.7
1.7
0.9
0.9
reconstruction
4.0
4.0
4.0
8.0
reconstruction
4.9
mass window
3.0
3.0
3.0
3.0
MC statistics
1.1
1.2
1.8
2.4
signal PDF
feed-across background
1.3
1.3
1.3
1.3
Total
6.8
6.8
8.8
9.9
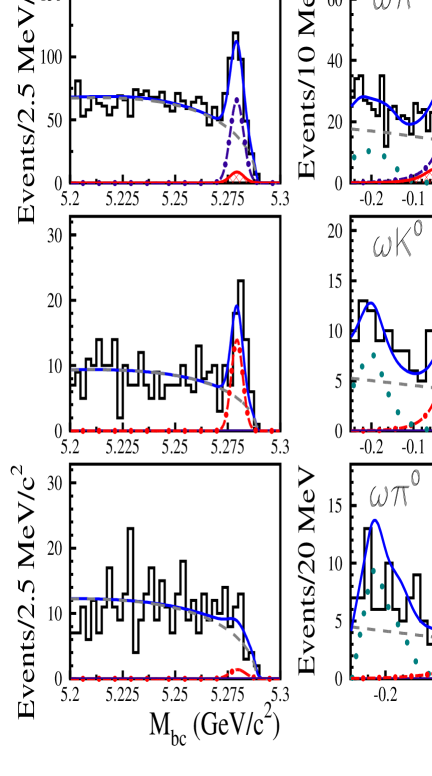
Figure 1: Projections of fit results on (within the region of GeV,
GeV for ) and (within the region of
) for , , ,
and . Open histograms are data, solid curves are the fit functions, solid-dotted lines represent the signals,
dashed lines show the sum of continuum and , dotted lines are due to other charmless decays,
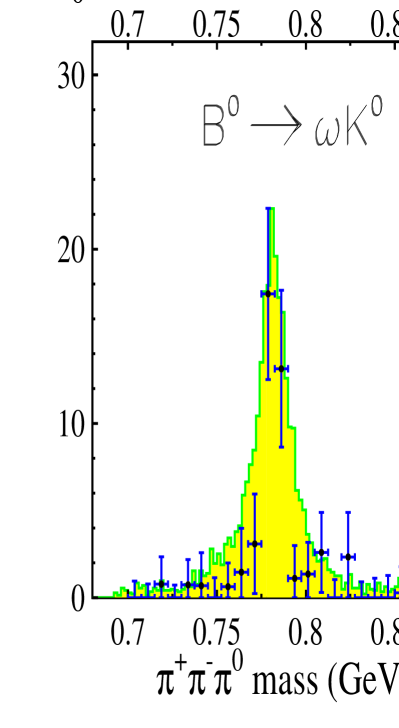
and cross-hatched areas represent reflections due to - misidentification.Figure 2: Background-subtracted one-dimentional projections are obtained from data fit results in bins of fit yields in (left)
the invariant mass and (right) the absolute value of the cosine of the helicity angle
for , , and candidate events. Points are data, and
histograms are from MC expectations for .
We define the significance as , where is the maximum
likelihood from the fit when the signal yields are floated, and is obtained when the signal yields are set to zero with the
remaining fit parameters still floating. To verify that signal candidates indeed arise from or , we in turn
change the criterion on or , and repeatedly perform ML fits for
and to obtain yields in each bin of or
shown in Figure 2, where denotes the angle between the flight direction and the normal to the decay plane in
the rest frame. The % C.L. upper limit for is calculated using the procedure of Ref. POLE ,
which is based on the Feldman-Cousins method UL . This procedure accounts for systematic uncertainties (discussed below). The estimated
background (observed count) is () events inside the signal box.
The main systematic uncertainties for the branching fraction measurements are listed in Table 2. These are evaluated as follows:
charged tracking efficiency (% per track) from partially reconstructed , ;
reconstruction (%) from , ; mass resolution (%); the requirement
on (%) from , ; MC statistics (–)%, and the number of
events in the data samples (%). For the measurement, the dominant systematic uncertainty comes from the fit parameters.
Systematic uncertainties due to fit parameters are evaluated by varying each parameter by and adding in quadrature the resulting
deviations from the central value. The total systematic uncertainty is the quadratic sum of all the above contributions. When varying each fit
parameter by one at a time, the significance is recalculated and the lowest value is chosen as the final significance (shown in
Table 1) including the systematic uncertainty.
While the branching fractions for , , and are of comparable size,
that for is much smaller as compared to that for . This is in agreement with both QCDF
and PQCD pictures, which predict that only color-suppressed tree and penguin diagrams contribute to QCDF ; PQCD ; PQCD2 .
We also determine the partial width ratio
(3)
where the ratio of meson lifetimes is taken to be PDG . The systematic error of
the partial width ratio is reduced because of the cancellation of several common systematic errors. No evidence for direct violation
is found for either or . Our results on branching fractions and CP asymmetries are consistent
with the recent measurements babar3 from the BaBar collaboration.
We thank the KEKB group for the excellent operation of the accelerator, the KEK cryogenics group for the efficient operation of the solenoid,
and the KEK computer group and the NII for valuable computing and Super-SINET network support. We acknowledge support from MEXT and JSPS (Japan);
ARC and DEST (Australia); NSFC (contract No. 10175071 China); DST (India); the BK21 program of MOEHRD and the CHEP SRC program of KOSEF (Korea);
KBN (contract No. 2P03B 01324, Poland); MIST (Russia); MHEST (Slovenia); SNSF (Switzerland); NSC and MOE (Taiwan); and DOE (USA). C.-M. Jen
thanks Y.Y. Chang, H.Y. Cheng, C.H. Chen, C.K. Chua, and H.n. Li for invaluable instruction and discussions on particle physics phenomenology
while at AS (Taiwan).
References
(1) M. Beneke, M. Neubert, Nucl. Phys. B 675, 333 (2003).
(3) H.-n. Li, Satoshi Mishima, hep-ph/0608277; C.-H. Chen, Phys. Lett. B 525, 56 (2002).
(4) Cai-Dian L, Mao-Zhi Yang, Eur. Phys. J. C 23, 275 (2002).
(5) C.-H. Wang et al. (Belle Collab.), Phys. Rev. D 70, 012001 (2004).
(6) B. Aubert et al. (BaBar Collab.), Phys. Rev. Lett. 92, 061801 (2004).
(7) B. Aubert et al. (BaBar Collab.), Phys. Rev. D 70, 032006 (2004).
(8) B. Aubert et al. (BaBar Collab.), Phys. Rev. D(RC) 74, 011106 (2006).
(9) S. Kurokawa and E. Kikutani, Nucl. Instrum. Meth. Phys. Res. Sect. A 499, 1 (2003),
and other papers included in this volume.
(10) A. Abashian et al. (Belle Collab.), Nucl. Instrum. Meth. Phys. Res. Sect. A 479 117 (2002).
(11) Y. Ushiroda (Belle SVD2 group), Nucl. Instrum. Meth. Phys. Res. Sect. A 511, 6 (2003).
(12) S. Eidelman et al. (Particle Data Group), Phys. Lett. B 592, 1 (2004).
(13) We define the thrust axis for a collection of particles as the axis that maximizes the sum of the magnitude of the
longitudinal momenta with respect to the axis.
(14) The Fox-Wolfram moments were introduced in G.C. Fox and S. Wolfram, Phys. Rev. Lett. 41, 1581 (1978).
The Fisher discriminant used by Belle, based on modified Fox-Wolfram moments (SFW), is described in K. Abe et al. (Belle Collab.),
Phys. Rev. Lett. 87, 101801 (2001) and K. Abe et al. (Belle Collab.), Phys. Lett. B 511, 151 (2001).
(15) R. Ammar et al. (CLEO Collab.), Phys. Rev. Lett. 71, 674 (1993).
The variable was first introduced by CLEO in the analysis. We use the thrust axis to calculate
, while CLEO uses the photon direction.
(16) H. Kakuno et al. (Belle Collab.), Nucl. Instr. and Meth. A 533, 516 (2004).
(17) J.E. Gaiser et al. (Crystal Ball Collab.), Phys. Rev. D 34, 711 (1986).
(18) H. Albrecht et al. (ARGUS Collab.), Phys. Lett. B 241, 278 (1990).
(19) POLE program, v1.0 (http://www3.tsl.uu.se/~conrad/pole.html);
see also J. Conrad, O. Botner, A. Hallgren, and C. Pérez de los Heros, Phys. Rev. D 67, 012002 (2003).
(20) G.J. Feldman and R.D. Cousins, Phys. Rev. D 57, 3873, (1998).