Measurements of Branching Fractions for and Decays with 449 million Pairs
S.-W. Lin
Department of Physics, National Taiwan University, Taipei
P. Chang
Department of Physics, National Taiwan University, Taipei
K. Abe
High Energy Accelerator Research Organization (KEK), Tsukuba
K. Abe
Tohoku Gakuin University, Tagajo
I. Adachi
High Energy Accelerator Research Organization (KEK), Tsukuba
H. Aihara
Department of Physics, University of Tokyo, Tokyo
D. Anipko
Budker Institute of Nuclear Physics, Novosibirsk
V. Aulchenko
Budker Institute of Nuclear Physics, Novosibirsk
T. Aushev
Swiss Federal Institute of Technology of Lausanne, EPFL, Lausanne
Institute for Theoretical and Experimental Physics, Moscow
S. Bahinipati
University of Cincinnati, Cincinnati, Ohio 45221
A. M. Bakich
University of Sydney, Sydney, New South Wales
E. Barberio
University of Melbourne, Victoria
I. Bedny
Budker Institute of Nuclear Physics, Novosibirsk
U. Bitenc
J. Stefan Institute, Ljubljana
I. Bizjak
J. Stefan Institute, Ljubljana
S. Blyth
National Central University, Chung-li
A. Bondar
Budker Institute of Nuclear Physics, Novosibirsk
A. Bozek
H. Niewodniczanski Institute of Nuclear Physics, Krakow
M. Bračko
High Energy Accelerator Research Organization (KEK), Tsukuba
University of Maribor, Maribor
J. Stefan Institute, Ljubljana
T. E. Browder
University of Hawaii, Honolulu, Hawaii 96822
M.-C. Chang
Department of Physics, Fu Jen Catholic University, Taipei
Y. Chao
Department of Physics, National Taiwan University, Taipei
A. Chen
National Central University, Chung-li
K.-F. Chen
Department of Physics, National Taiwan University, Taipei
W. T. Chen
National Central University, Chung-li
B. G. Cheon
Hanyang University, Seoul
R. Chistov
Institute for Theoretical and Experimental Physics, Moscow
S.-K. Choi
Gyeongsang National University, Chinju
Y. Choi
Sungkyunkwan University, Suwon
Y. K. Choi
Sungkyunkwan University, Suwon
J. Dalseno
University of Melbourne, Victoria
M. Dash
Virginia Polytechnic Institute and State University, Blacksburg, Virginia 24061
J. Dragic
High Energy Accelerator Research Organization (KEK), Tsukuba
A. Drutskoy
University of Cincinnati, Cincinnati, Ohio 45221
S. Eidelman
Budker Institute of Nuclear Physics, Novosibirsk
S. Fratina
J. Stefan Institute, Ljubljana
N. Gabyshev
Budker Institute of Nuclear Physics, Novosibirsk
A. Garmash
Princeton University, Princeton, New Jersey 08544
A. Go
National Central University, Chung-li
B. Golob
University of Ljubljana, Ljubljana
J. Stefan Institute, Ljubljana
H. Ha
Korea University, Seoul
J. Haba
High Energy Accelerator Research Organization (KEK), Tsukuba
T. Hara
Osaka University, Osaka
H. Hayashii
Nara Women’s University, Nara
M. Hazumi
High Energy Accelerator Research Organization (KEK), Tsukuba
D. Heffernan
Osaka University, Osaka
T. Hokuue
Nagoya University, Nagoya
Y. Hoshi
Tohoku Gakuin University, Tagajo
W.-S. Hou
Department of Physics, National Taiwan University, Taipei
Y. B. Hsiung
Department of Physics, National Taiwan University, Taipei
T. Iijima
Nagoya University, Nagoya
K. Ikado
Nagoya University, Nagoya
A. Imoto
Nara Women’s University, Nara
K. Inami
Nagoya University, Nagoya
A. Ishikawa
Department of Physics, University of Tokyo, Tokyo
H. Ishino
Tokyo Institute of Technology, Tokyo
R. Itoh
High Energy Accelerator Research Organization (KEK), Tsukuba
M. Iwasaki
Department of Physics, University of Tokyo, Tokyo
Y. Iwasaki
High Energy Accelerator Research Organization (KEK), Tsukuba
H. Kaji
Nagoya University, Nagoya
P. Kapusta
H. Niewodniczanski Institute of Nuclear Physics, Krakow
S. U. Kataoka
Nara Women’s University, Nara
H. Kawai
Chiba University, Chiba
T. Kawasaki
Niigata University, Niigata
H. Kichimi
High Energy Accelerator Research Organization (KEK), Tsukuba
Y. J. Kim
The Graduate University for Advanced Studies, Hayama
K. Kinoshita
University of Cincinnati, Cincinnati, Ohio 45221
S. Korpar
University of Maribor, Maribor
J. Stefan Institute, Ljubljana
P. Križan
University of Ljubljana, Ljubljana
J. Stefan Institute, Ljubljana
P. Krokovny
High Energy Accelerator Research Organization (KEK), Tsukuba
R. Kulasiri
University of Cincinnati, Cincinnati, Ohio 45221
R. Kumar
Panjab University, Chandigarh
A. Kuzmin
Budker Institute of Nuclear Physics, Novosibirsk
Y.-J. Kwon
Yonsei University, Seoul
M. J. Lee
Seoul National University, Seoul
T. Lesiak
H. Niewodniczanski Institute of Nuclear Physics, Krakow
D. Liventsev
Institute for Theoretical and Experimental Physics, Moscow
J. MacNaughton
Institute of High Energy Physics, Vienna
F. Mandl
Institute of High Energy Physics, Vienna
T. Matsumoto
Tokyo Metropolitan University, Tokyo
S. McOnie
University of Sydney, Sydney, New South Wales
T. Medvedeva
Institute for Theoretical and Experimental Physics, Moscow
W. Mitaroff
Institute of High Energy Physics, Vienna
H. Miyake
Osaka University, Osaka
H. Miyata
Niigata University, Niigata
Y. Miyazaki
Nagoya University, Nagoya
G. R. Moloney
University of Melbourne, School of Physics, Victoria 3010
E. Nakano
Osaka City University, Osaka
M. Nakao
High Energy Accelerator Research Organization (KEK), Tsukuba
H. Nakazawa
National Central University, Chung-li
Z. Natkaniec
H. Niewodniczanski Institute of Nuclear Physics, Krakow
S. Nishida
High Energy Accelerator Research Organization (KEK), Tsukuba
O. Nitoh
Tokyo University of Agriculture and Technology, Tokyo
S. Ogawa
Toho University, Funabashi
T. Ohshima
Nagoya University, Nagoya
S. Okuno
Kanagawa University, Yokohama
S. L. Olsen
University of Hawaii, Honolulu, Hawaii 96822
Y. Onuki
RIKEN BNL Research Center, Upton, New York 11973
H. Ozaki
High Energy Accelerator Research Organization (KEK), Tsukuba
P. Pakhlov
Institute for Theoretical and Experimental Physics, Moscow
G. Pakhlova
Institute for Theoretical and Experimental Physics, Moscow
C. W. Park
Sungkyunkwan University, Suwon
R. Pestotnik
J. Stefan Institute, Ljubljana
L. E. Piilonen
Virginia Polytechnic Institute and State University, Blacksburg, Virginia 24061
H. Sahoo
University of Hawaii, Honolulu, Hawaii 96822
Y. Sakai
High Energy Accelerator Research Organization (KEK), Tsukuba
N. Satoyama
Shinshu University, Nagano
T. Schietinger
Swiss Federal Institute of Technology of Lausanne, EPFL, Lausanne
O. Schneider
Swiss Federal Institute of Technology of Lausanne, EPFL, Lausanne
J. Schümann
High Energy Accelerator Research Organization (KEK), Tsukuba
A. J. Schwartz
University of Cincinnati, Cincinnati, Ohio 45221
K. Senyo
Nagoya University, Nagoya
M. E. Sevior
University of Melbourne, Victoria
M. Shapkin
Institute of High Energy Physics, Protvino
H. Shibuya
Toho University, Funabashi
B. Shwartz
Budker Institute of Nuclear Physics, Novosibirsk
J. B. Singh
Panjab University, Chandigarh
A. Somov
University of Cincinnati, Cincinnati, Ohio 45221
N. Soni
Panjab University, Chandigarh
S. Stanič
University of Nova Gorica, Nova Gorica
M. Starič
J. Stefan Institute, Ljubljana
H. Stoeck
University of Sydney, Sydney, New South Wales
K. Sumisawa
High Energy Accelerator Research Organization (KEK), Tsukuba
T. Sumiyoshi
Tokyo Metropolitan University, Tokyo
S. Suzuki
Saga University, Saga
S. Y. Suzuki
High Energy Accelerator Research Organization (KEK), Tsukuba
F. Takasaki
High Energy Accelerator Research Organization (KEK), Tsukuba
K. Tamai
High Energy Accelerator Research Organization (KEK), Tsukuba
M. Tanaka
High Energy Accelerator Research Organization (KEK), Tsukuba
G. N. Taylor
University of Melbourne, Victoria
Y. Teramoto
Osaka City University, Osaka
X. C. Tian
Peking University, Beijing
I. Tikhomirov
Institute for Theoretical and Experimental Physics, Moscow
T. Tsukamoto
High Energy Accelerator Research Organization (KEK), Tsukuba
S. Uehara
High Energy Accelerator Research Organization (KEK), Tsukuba
K. Ueno
Department of Physics, National Taiwan University, Taipei
Y. Unno
Hanyang University, Seoul
S. Uno
High Energy Accelerator Research Organization (KEK), Tsukuba
Y. Ushiroda
High Energy Accelerator Research Organization (KEK), Tsukuba
G. Varner
University of Hawaii, Honolulu, Hawaii 96822
K. E. Varvell
University of Sydney, Sydney, New South Wales
S. Villa
Swiss Federal Institute of Technology of Lausanne, EPFL, Lausanne
C. C. Wang
Department of Physics, National Taiwan University, Taipei
C. H. Wang
National United University, Miao Li
M.-Z. Wang
Department of Physics, National Taiwan University, Taipei
Y. Watanabe
Tokyo Institute of Technology, Tokyo
J. Wicht
Swiss Federal Institute of Technology of Lausanne, EPFL, Lausanne
E. Won
Korea University, Seoul
Q. L. Xie
Institute of High Energy Physics, Chinese Academy of Sciences, Beijing
B. D. Yabsley
University of Sydney, Sydney, New South Wales
A. Yamaguchi
Tohoku University, Sendai
Y. Yamashita
Nippon Dental University, Niigata
M. Yamauchi
High Energy Accelerator Research Organization (KEK), Tsukuba
Y. Yusa
Virginia Polytechnic Institute and State University, Blacksburg, Virginia 24061
C. C. Zhang
Institute of High Energy Physics, Chinese Academy of Sciences, Beijing
Z. P. Zhang
University of Science and Technology of China, Hefei
A. Zupanc
J. Stefan Institute, Ljubljana
Abstract
We report measurements of branching fractions for and
decays based on a data sample of 449
million pairs collected at the resonance with the Belle
detector at the KEKB asymmetric-energy collider.
We also calculate the ratios of partial widths for the decays ,
namely and
,where the first and the second errors are statistical and systematic,
respectively. These ratios are sensitive to enhanced electroweak
penguin contributions from new physics; the new measurements are, however,
consistent with Standard Model expectations.
pacs:
11.30.Er, 12.15.Hh, 13.25.Hw, 14.40.Nd
Tests of the Standard Model (SM) can be performed in -meson decays
to and final states, which involve various interplays
between dominant tree diagram, , penguin
diagrams and other sub-dominant contributions. In general, direct
comparisons of the measured branching fractions with the SM
predictions suffer from large hadronic uncertainties within the
current theoretical framework. However, many of the uncertainties
cancel out in ratios of branching fractions.
Previous experimental results bellebr ; babarbr ; cleobr for the ratios
and
ratios
deviate from the SM expectations within several
approaches buras ; pqcd ; rn1 ; rn2 . For example, Ref. buras
predicts the values and , which are
calculated
assuming flavor symmetry. If the differences between these SM
expectations and the measured values of and persist with more
data, this would imply a large electroweak penguin contribution in
decays buras ; rn1 ; rn2 .
In this letter, we report new measurements of the branching fractions for
, , , and
decays with a data sample five times larger than that used in our previous
study bellebr . Recent Belle results for ,
and decays have been reported elsewhere kk ; pi0pi0 .
The results are based on a sample of (449.3 5.7) 106
pairs collected with the Belle detector at the KEKB asymmetric-energy
(3.5 on 8 GeV) collider kur .
The production rates of and pairs are
assumed to be equal.
The inclusion of the charge-conjugate decay is implied, unless explicitly stated
otherwise.
The Belle detector is a large-solid-angle magnetic
spectrometer that consists of a silicon vertex detector (SVD),
a 50-layer central drift chamber (CDC), an array of
aerogel threshold Cherenkov counters (ACC),
a barrel-like arrangement of time-of-flight
scintillation counters, and an electromagnetic calorimeter
comprised of CsI(Tl) crystals located inside
a superconducting solenoid coil that provides a 1.5 T
magnetic field. An iron flux-return located outside
the coil is instrumented to detect mesons and to identify
muons. The detector is described in detail elsewhere aba .
Two different inner detector configurations were used. For the first sample
of 152 million pairs (set I), a 2.0 cm radius beampipe
and a three-layer silicon vertex detector were used;
for the latter 297 million pairs (set II),
a 1.5 cm radius beampipe, a four-layer silicon detector
and a small-cell inner drift chamber were used svd2 .
Primary charged tracks are required to have a distance of closest approach
to the interaction point (IP) of less than 4 cm in the beam
direction (-axis) and less than 0.1 cm in the transverse plane.
Charged kaons and pions are identified using information
from the CDC and Cherenkov light yields in the ACC, which are
combined to form a - likelihood ratio , where
is the likelihood that the
track is a kaon (pion).
Charged tracks with (0.4) are
classified as kaons (pions). Typically, the kaon (pion) identification
efficiency is 83% (90%), and 6% (12%) of selected kaons (pions) are
misidentified as pions (kaons).
Furthermore, we reject charged
tracks that are consistent with an electron hypothesis.
Candidate mesons are reconstructed as
decays with the branching fraction taken from Ref. ksbr .
We pair oppositely-charged tracks assuming the pion hypothesis
and require the invariant mass of the
pair to be within MeV/ of the nominal mass. The
intersection point of the pair must be displaced from the IP ksdis .
Pairs of photons with invariant masses in the range of 115 MeV/ 152 MeV/ ()
are considered as candidates. The photon energy
is required to be greater than 50 MeV in
the barrel region, defined as , and
greater than 100 MeV in the end-cap regions, defined as or ,
where denotes the photon polar angle with respect to the
direction anti-parallel to the beam.
Candidate mesons are identified by the “beam-energy-constrained” mass,
, and the energy difference,
, where
is the run-dependent beam energy, and
and are the reconstructed energy and momentum of the
candidates in the center-of-mass (CM) frame, respectively. Events with
GeV/ and
are selected for the analysis.
The dominant background is from
continuum events. We use event topology to distinguish the
events from the jet-like continuum background. We combine a set of modified
Fox-Wolfram moments pi0pi02 into a
Fisher discriminant. A signal/background likelihood is formed, based on a
GEANT-based geant
Monte Carlo (MC) simulation, from the product of the probability density
functions (PDFs) for the Fisher discriminant and that for the cosine of the
polar angle of the -meson flight direction.
Suppression of the
continuum is achieved by applying a requirement on the ratio
, where
()
is the signal (continuum) likelihood.
Continuum background is further suppressed through use of the
-flavor tagging algorithm tagging , which provides a discrete
variable indicating the flavor of the tagging meson and a continuous
quality parameter ranging from 0 (for no
flavor-tagging information) to 1 (for unambiguous flavor assignment).
Events with a high value of are considered well-tagged and hence are
unlikely to have originated from continuum processes.
We classify events separately as poorly-tagged () and well-tagged
() in
data set I and data set II and for each category we determine a continuum
suppression requirement for that maximizes the value of
.
Here, denotes the expected signal yields based on MC
simulation and the average branching fractions of the previous
measurements bellebr ; babarbr ; cleobr , and
denotes the
expected continuum yields as estimated from sideband data ( GeV/ and 0.3 GeV).
Background contributions from events are
investigated using a large MC sample that includes events from
transitions and charmless decays. After all the selection requirements,
no background is found, while a small contribution from
charmless decays is present at low values for all studied modes.
Due to misidentification, large and feed-across backgrounds appear in the and modes, respectively.
The signal yields are extracted by performing extended unbinned
maximum likelihood fits to the (, )
distributions of the selected candidate events.
The likelihood function for each mode is defined as
(1)
where is the total number of events, is the event identifier,
indicates set I or set II, distinguishes
the two regions and runs over all components included in the fitting
function: signal, continuum background, feed-across, and charmless
background.
The variable denotes the number of events, and , are two-dimensional PDFs, which are the same in the two
regions for all fit
components except for the continuum background.
All the signal PDFs ()
are parameterized by smoothed two-dimensional histograms obtained from correctly
reconstructed signal
MC based on the set I and set II detector configurations.
Signal MC events are generated with the PHOTOS photos
simulation package to take into account final-state radiation.
Since the signal distribution is dominated by
the beam-energy spread, we use the signal-peak positions and resolutions
obtained from data to refine our signal MC
(the sub-decay is used for modes
with a in the final state, while
is used for the other modes). The resolution
for the distribution is calibrated using the invariant
mass distribution of high momentum ( 3 GeV/) mesons.
The size of the final-state radiation effects can be assessed if we take
signal PDFs from MC without PHOTOS and use these PDFs to extract the signal
yields from the signal MC with PHOTOS. The extracted yields
decrease by 5.8% for , 9.4% for and 3.6% for and ,
respectively.
The continuum background PDF is described by a product of a linear function for
and an ARGUS function, , where
= / argus .
The overall normalization, slope and ARGUS parameter
are free parameters in the fit.
The background PDFs for charmless decays are modeled by a smoothed
two-dimensional histogram, obtained from a large MC sample.
We also use a smoothed two-dimensional histogram
to describe the feed-across background, since the background events have
(, ) shapes similar
to the signal, except for a peak position shift of MeV.
We perform a simultaneous
fit for and , since these two decay
modes feed across into each other. The feed-across fractions are constrained
according to the identification efficiencies and fake rates of kaons and pions.
A simultaneous fit is also used for the
and decay modes.
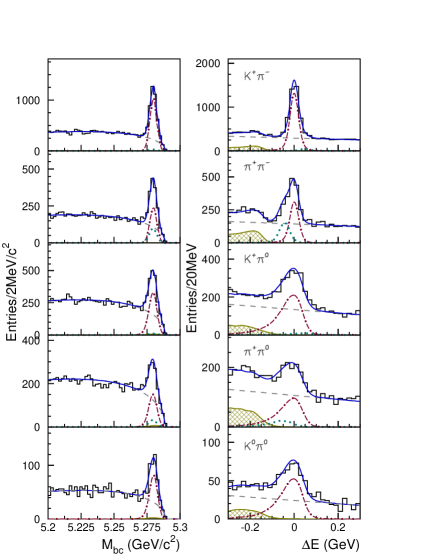
Figure 1: (left) and (right) distributions for
, , , and candidates. The histograms show
the data, while the curves represent the various components from
the fit: signal (dot-dashed), continuum (dashed), charmless decays
(hatched), background from mis-identification (dotted),
and sum of all components (solid). The and projections of the fits
are for events that have GeV (left) and
GeV/ GeV/ (right). (A looser
requirement, GeV GeV, is used for the modes with a
meson in the final state.)
When likelihood fits are performed, the yields
are allowed to
float independently for each (set I or set II) and bin (low
or high region).
The and projections of the fits are shown in
Fig. 1, while Table 1 summarizes the fit results for
each mode. The branching fraction of each mode is calculated by dividing the
total signal yield by the number of pairs and by the average
reconstruction efficiency. The calculation of this average
efficiency takes into account the differences between various and
bins, and sub-decay branching fractions.
The fitting systematic errors are due to signal PDF modeling,
charmless background modeling, and feed-across constraints. The first
and last of these errors are estimated from the fit deviations after varying each
parameter of the signal PDFs or the yields of the feed-across backgrounds by one
standard deviation. The effects due to fake-rate uncertainties are also
included in the
systematic error of the feed-across backgrounds. The systematic error due to the charmless background
modeling is evaluated by requiring that GeV, since the values of the charmless events are typically smaller than GeV.
The above deviations in the signal yield are added in quadrature to obtain
the overall systematic error due to fitting.
The MC-data efficiency difference due to the requirement on the likelihood
ratio is investigated with
samples.
The systematic error due to the charged-track reconstruction efficiency is
estimated to be 1% per track using partially
reconstructed events.
The systematic error due to the selection is 1.3%
for pions and 1.5% for kaons, respectively.
The reconstruction and the systematic error is verified by comparing the
ratio of and yields
with the MC expectations. The reconstruction efficiency and the
systematic error is verified by comparing the ratio of
and
yields with the MC expectations.
Possible systematic uncertainties due to the
description of final-state radiation have been studied by comparing the
latest theoretical calculations with the PHOTOS MC photoserr . These
uncertainties were found to be negligible and thus no systematic error is
assigned due to PHOTOS.
The systematic error due to the uncertainty of the total number of pairs
is 1.3% and the error due to signal MC statistics is between 0.4%
and 0.7%.
The final systematic uncertainty is obtained by quadratically summing all
the contributions, as shown in Table 2.
Table 1: Extracted signal yields, product of efficiencies and sub-decay
branching ratios , and calculated branching fractions for
individual modes. The branching fraction errors are statistical and
systematic, respectively.
Mode
Yield
Eff.(%)
40.16
872
37.98
5.1
693
23.63
6.5 0.4
379
9.17
9.2 0.7
Table 2: Summary of systematic errors, given in percent.
Signal PDF
0.2
0.3
0.4
0.5
Charmless background
Feed-across background
0.0
requirement
1.0
1.0
1.3
1.4
1.5
Tracking
2.0
2.0
1.0
1.0
0.0
requirement
2.9
2.8
1.5
1.3
0.0
reconstruction
0.0
0.0
0.0
0.0
4.9
reconstruction
0.0
0.0
4.0
4.0
4.0
# of
1.3
1.3
1.3
1.3
1.3
Signal MC statistics
0.6
0.4
0.4
0.5
0.7
Total
4.0
Table 3: Partial width ratios of and decays. The errors
are quoted in the same manner as in Table 1.
Modes
Ratio
2/
1.08 0.06 0.08
/2
1.08 0.08
/
0.94 0.04 0.05
/
0.26 0.01 0.01
/2
0.42 0.03
/
0.66 0.07 0.05
2/
0.57 0.04
The ratios of partial widths can be used to extract the angle and to
search for new physics buras ; rn1 ; rn2 .
These ratios (listed in Table 3) are obtained from the five measurements in
Table 1 and the new measurement of
described in Ref. kk .
The ratio of charged to neutral meson lifetime, / = 1.076 0.008 ratios , is used to convert the
branching-fraction ratios into the ratios of partial widths. The total errors are reduced because of the cancellation of some common systematic errors.
With a factor of five times more data than that used for our previous published
results bellebr , the statistical errors on the branching fractions for
all decay modes are reduced by more than a factor of 2.3.
The central value of the branching fraction has decreased from
to and the branching
fraction has increased from to ,
resulting in a change in from to . The
obtained value of is similar to the previous Belle
measurement () but is more precise. The errors for
and shown here are the sum in quadrature of the statistical
and systematic errors. These two ratios are now consistent with SM
expectations buras ; pqcd ; rn1 ; rn2 .
In conclusion, we have measured the branching fractions for
and decays with 449 million
pairs collected at the resonance with the Belle detector.
We confirm the expected
hierarchy of branching fractions : and find no significant deviation from SM expectations in the ratios of partial widths.
We also find that the ratios and are both in good agreement with SM
expectations, in contrast to early measurements bellebr ; babarbr ; cleobr .
We thank the KEKB group for excellent operation of the
accelerator, the KEK cryogenics group for efficient solenoid
operations, and the KEK computer group and
the NII for valuable computing and Super-SINET network
support. We acknowledge support from MEXT and JSPS (Japan);
ARC and DEST (Australia); NSFC and KIP of CAS (China);
DST (India); MOEHRD, KOSEF and KRF (Korea);
KBN (Poland); MIST (Russia); ARRS (Slovenia); SNSF (Switzerland);
NSC and MOE (Taiwan); and DOE (USA).
References
(1) Y. Chao et al. (Belle Collaboration),
Phys. Rev. D 69, 111102 (2004).
(2) B. Aubert et al. (BaBar Collaboration),
Phys. Rev. D 71, 111102 (2005); Phys. Rev. Lett. 94, 181802 (2005);
Phys. Rev. Lett. 97, 171805 (2006); Phys. Rev. D 75, 012008 (2007).
(3) A. Bornheim et al. (CLEO Collaboration), Phys. Rev.
D 68, 052002 (2003).
(4) The average results in Winter 2006 by the HFAG group.
(5) A. J. Buras, R. Fleischer, S. Recksiegel and F. Schwab,
Eur. Phys. J. C 45, 701 (2006).
(6) H.-n. Li, S. Mishima and A. I. Sanda, Phys. Rev. D 72, 114005 (2005).
(7) T. Yoshikawa, Phys. Rev. D 68, 054023 (2003); S. Mishima, T. Yoshikawa, Phys. Rev. D 70, 094024 (2004).
(8) M. Gronau and J. L. Rosner, Phys. Lett. B 572, 43 (2003).
(9) K. Abe et al. (the Belle Collaboration), hep-ex/0608049,
submitted to the Phys. Rev. Lett..
(10) Y. Chao et al. (Belle Collaboration), Phys. Rev. Lett. 94, 181803 (2005).
(11) S. Kurokawa and E. Kikutani, Nucl. Instr. Meth. A 499, 1 (2003), and other papers included in this volume.
(12) A. Abashian et al. (Belle Collaboration), Nucl. Instr. Meth. A 479, 117 (2002).
(13) Z. Natkaniec et al. (Belle SVD2 Group), Nucl. Instr. Meth. A 560, 1 (2006).
(14) W.-M. Yao et al. (Particle Data Group), J. Phys. G 33, 1 (2006).
(15) The selection is described in K. -F. Chen et al. (Belle Collaboration), Phys. Rev. D 72, 012004 (2005).
(16) G. C. Fox and
S. Wolfram, Phys. Rev. Lett. 41 1581 (1978). The modified
moments used in this paper are described in,
S. H. Lee et al. (Belle Collaboration), Phys. Rev. Lett. 91, 261801 (2003).
(17)
R. Brun et al.,
GEANT 3.21, CERN Report No. DD/EE/84-1 (1987).
(18) H. Kakuno et al., Nucl. Instr. and Meth.
A 533, 516 (2004).
(19) E. Barberio and Z. Was, Comput. Phys. Commun. 79,
291 (1994); P. Golonka and Z. Was, hep-ph/0506026.
We use PHOTOS version 2.13 allowing the emission of up to
two photons, with an energy cut-off at 1% of the
energy available for photon emission (i.e. approximately 26 MeV for the first
emitted photon). PHOTOS also takes into account interference
between charged final-state particles.
(20) H. Albrecht et al. (ARGUS Collaboration), Phys. Lett. B 241, 278 (1990).