CLEO Collaboration
Improved Measurement of the Branching Fraction and Energy Spectrum of from Decays
Abstract
We present an improved measurement of the meson energy spectrum in decays, using 1.2 of data taken at the center-of-mass energy with the CLEO III detector. We compare our results with models of gluonic form factor that have been suggested to explain the unexpectedly large rate. Models based on perturbative QCD fail to fit the data for large energies, showing that Standard Model strong interaction dynamics is not likely to provide an explanation for the large rate of high energy observed in decays.
pacs:
13.20.HeI Introduction
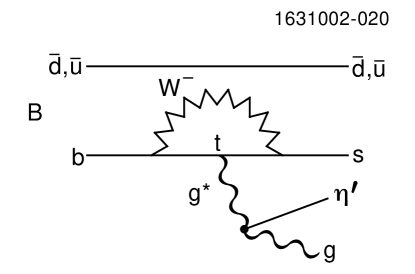
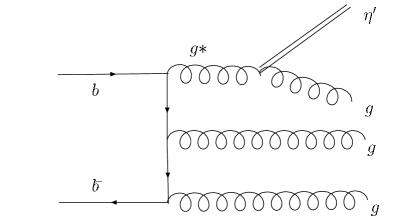
A surprisingly large rate for , with high momentum , (=2 - 2.7 GeV/c), was observed by CLEO Browder ; Ernst and confirmed by BaBar babar . This result motivated intense theoretical activity because new physics could account for such an enhancement. However, Standard Model explanations have also been proposed. For example, Atwood and Soni Atwood:1997bn argued that the observed excess is due to an enhanced penguin diagram, complemented by a strong coupling, induced by the gluonic content of the wave function. Fig. 1 (left) shows the corresponding Feynman diagram. The high region of the vertex function involved in this process also affects fast production in decay Kagan02 ; Ali:2000ci , whose relevant diagram is shown in Figure 1 (right). Thus a precise measurement of the inclusive spectra from the process provides valuable information towards our understanding of important meson decays.
The effective vertex function can be written as Atwood:1997bn :
| (1) |
where is the virtual gluon’s four-momentum, is the “on-shell” gluon’s momentum (), , represent color indices, are the polarization vectors of the two gluons, and is the transition form factor. Different assumptions on its dependence have been proposed Atwood:1997bn ; Hou:1997wy ; Kagan:1997 ; Ali:2000ci ; pQCD ; kroll .
While ARGUS was the first experiment to study the inclusive production at the argus , CLEO II jc was the first experiment to have sufficient statistics to measure inclusive production from the subprocess . These data ruled out a class of form factors characterized by a very weak dependence Atwood:1997bn ; Hou:1997wy . Intense theoretical activity has followed Ali:2000ci ; pQCD ; kroll to derive the perturbative QCD form factors from models of the wave function. Attempts to use CLEO II data to constrain the model parameters ali-extended were not conclusive, due to the limited statistics at the end point of the spectrum. Moreover, the order of the perturbative expansion necessary to achieve a good representation of the data was not clearly defined ali-extended . Thus an improved measurement, based on a higher statistics sample, is important to settle these issues. This work reports a new measurement of the inclusive spectrum from the process based on the largest sample presently available, more than a factor of 11 higher than the previous study jc . Thus the measured high energy distribution function provides a much more stringent constraint.
II Data sample and analysis method
We use 1.2 of CLEO III data recorded at the resonance, at 9.46 GeV center-of-mass energy, containing events and off-resonance continuum data collected at center-of-mass energies of 10.54 GeV (2.3 ).
The CLEO III detector includes a high resolution tracking system track , a state of the art CsI electromagnetic calorimeter csi , and a Ring Imaging Cherenkov (RICH) hadron identification system rich . The CsI calorimeter measures the photon energies with a resolution of 2.2% at GeV and 5% at =100 MeV. The tracking system provides also charged particle discrimination, through the measurement of the specific ionization .
We detect mesons through the channel and . The branching fractions for these processes are (44.51.4)% and (39.380.26)% respectively. We identify single photons based on their shower shape. The photon four-vectors are constrained to have invariant mass equal to the nominal mass. Subsequently, candidates are combined with two oppositely charged tracks to form an . Loose consistency criteria based on measurements are applied to the charged tracks.
The gluonic production at the is expected to be dominant only at very high , or, equivalently, at high scaled energy , where is defined as
| (2) |
where is the energy and is the beam energy. Enhanced production at high would indicate a large coupling.
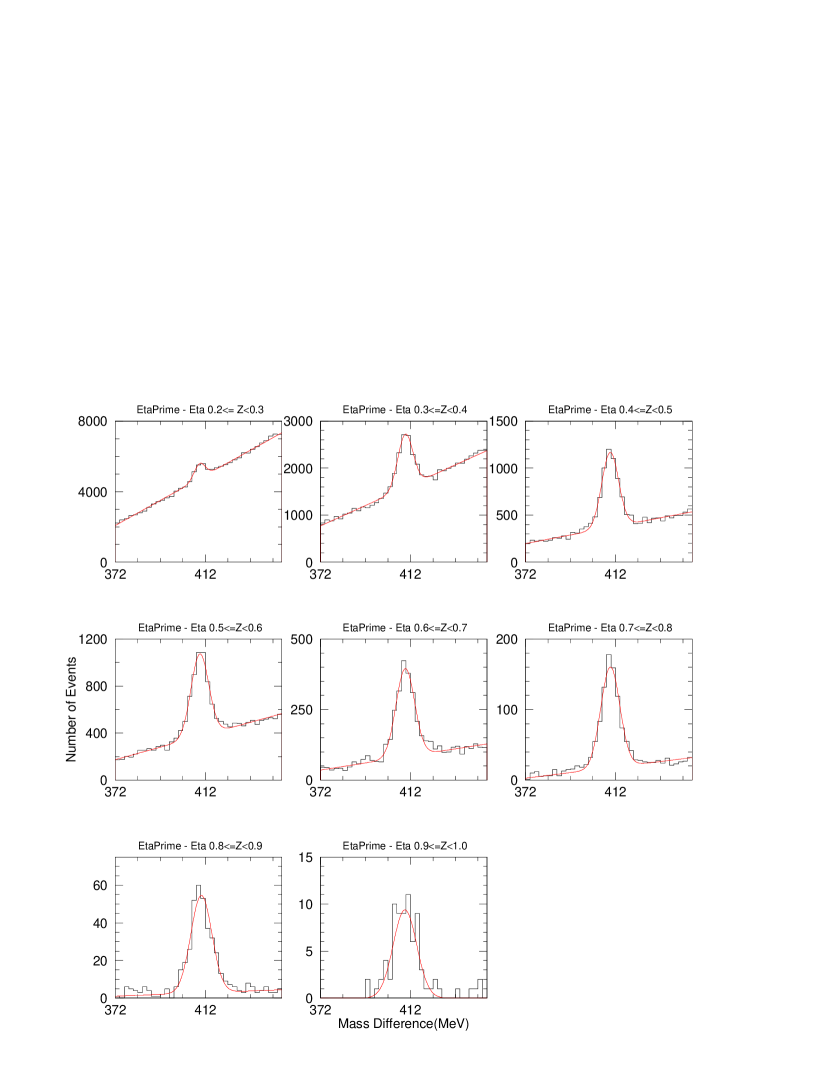
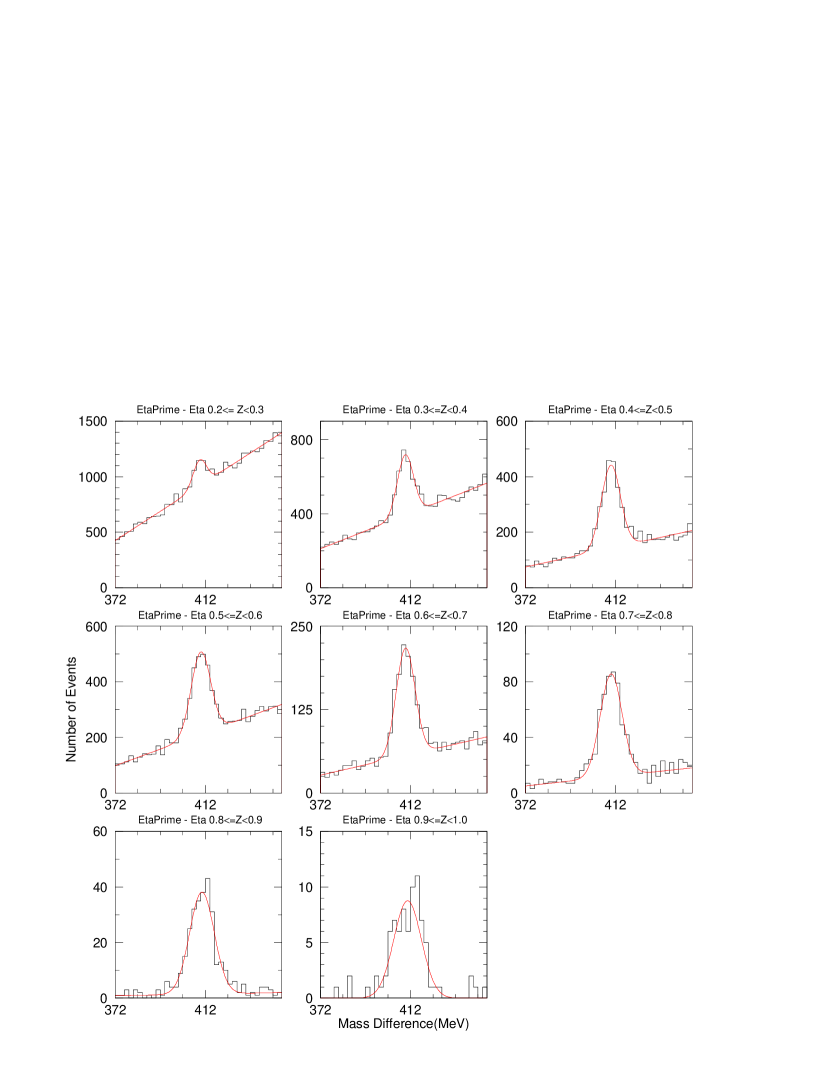
For low energy s, photons coming from low energy s are a severe source of background. Thus a veto is applied for , whereby photon pairs that have an invariant mass consistent (within 2.5 ) of the nominal mass are not included as the candidate photons for reconstruction. We consider only with scaled energy between 0.2 and 1 and divide this range into eight equal bins. Fig. 2 demonstrates the extraction of the yields in these bins for the sample. Fig. 3 shows the corresponding plots from the continuum sample taken at a center-of-mass energy of 10.54 GeV. In order to derive the signal yields, we fit the mass difference spectra in each bin with a Gaussian function representing the signal, and a polynomial background. The Gaussian is used only to define a signal interval. Then the yield in this interval is evaluated counting events in the signal window, after subtracting the background estimate obtained from the fit function. As the signal is not described well by a single Gaussian function, this procedure minimizes systematic uncertainties associated with the choice of an alternative signal shape.
Information on the gluon coupling of the can be drawn only from the decay chain . Thus we need to subtract both continuum production and from the process . The latter component is estimated using
| (3) |
where is the ratio between the hadronic cross section and the di-muon cross section at an energy close to 9.46 GeV. We use ammar:1998 and % pdg06 .
The two dominant components of the spectrum have different topologies: produces a spherical event topology, whereas processes are more jet-like. This difference affects the corresponding reconstruction efficiencies. Fig. 4 shows the efficiencies obtained for the two event topologies with CLEO III Monte Carlo studies. We use GEANT-based geant Monte Carlo samples, including and continuum samples. In order to use the continuum sample taken at 10.54 GeV center-of-mass energy for background subtraction, we develop a “mapping function”, to correct for the difference in phase space and range spanned in the two samples. The procedure is described in detail in Ref. jc . By comparing the energy distribution functions for the Monte Carlo continuum samples at center-of-mass energies equal to 9.46 and 10.54 GeV, we obtain the mapping:
| (4) |
where is the value used to subtract the continuum contribution, as mapped from , the measured in the continuum data taken at the center-of-mass energy equal to 10.54 GeV.
The cross section ratio is only about 3%, thus we make no attempt to subtract this term.


Upon correcting the raw yields with the corresponding efficiencies, the spectrum from the 3 gluon decay of the is extracted using the relationship:
| (5) |
where is the number of hadronic events in our sample, and is the number of continuum events estimated from the sample taken at 10.54 GeV, corrected for the luminosity difference between the resonance and continuum data, and the dependence of the cross section for the process . The component is estimated from using the relationship:
| (6) | |||||
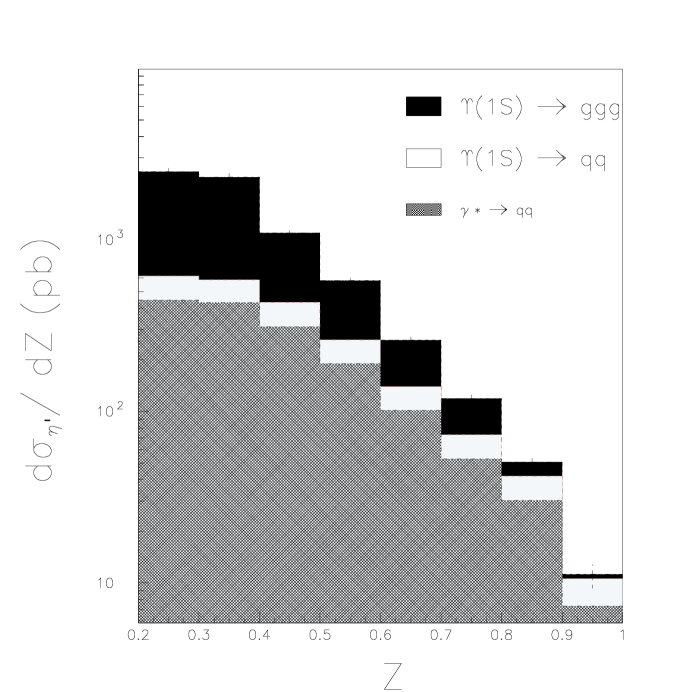
where accounts for the difference between the and the spectra due to initial state radiation (ISR) effects, estimated using Monte Carlo continuum samples with and without ISR simulation, and accounts for the relative cross section of these two processes. The correction factor differs from 1 by a few percent at low and as much as 25% at the end point of the energy. The cross sections used are nb pdg06 and is 1.38 nb fpair . Fig. 5 shows the differential cross sections for the processes , , and .
Theoretical predictions give the energy distribution function
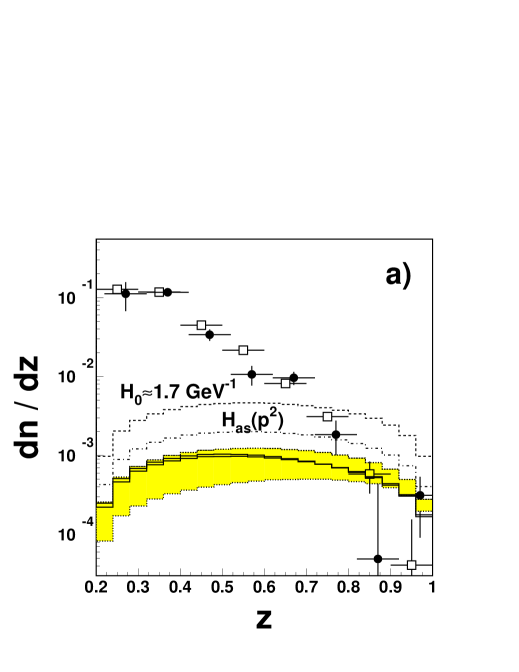
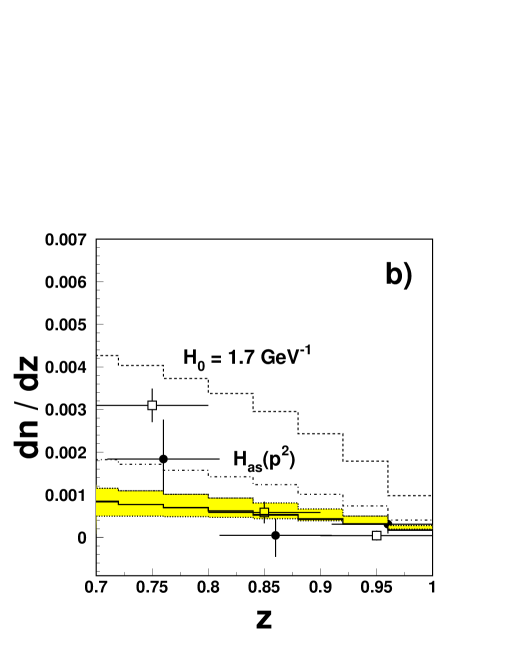
we obtain the corresponding experimental quantity by dividing by the total number of , estimated by applying Eq. 5 without any restriction. Fig. 6.a) shows the energy distribution function, whereas Fig. 6.b) and c) show the corresponding distributions for , normalized with respect of the total number of and , normalized with respect to the total number of .


The inclusive production at the is expected to be dominated by the transition only at high energy. The energy at which this occurs cannot be predicted from first principle: an empirical criterion is the of the theory fit to the data. For example, a numerical analysis of the CLEO II data ali-extended obtained a of 2.4 for three degrees of freedom, using the 3 experimental points at , and 24 for 4 degrees of freedom using the 4 points at . Thus Ali and Parkhomenko concluded that the region likely to be dominated by the starts at . Thus, we quote separately global branching fractions for and the corresponding results for .
Table 1 summarizes the dominant components of the systematic uncertainties. The systematic errors on the branching fractions from are for , for the for and for all other branching fractions.
| Sources | Sample () | Sample | All others |
| Reconstruction efficiency of | 2 | 2 | 2 |
| Reconstruction efficiency of | 5 | 5 | 5 |
| Number of from fit | 1 | 1 | 1 |
| Total number of | 1 | 1 | 1 |
| 3.4 | 3.4 | 3.4 | |
| - | 3 | - | |
| Ratio of integrated luminosity | 1.9 | 1 | - |
| 0.7 | 1.3 | - | |
| veto | - | 1.7 | 0.4 |
| Z mapping | 6 | 3 | 3 |
| Total | 9.1 | 8.1 | 7.2 |
Thus we obtain:
| (7) |
The branching fractions at high momentum () are measured to be:
| (8) |
III Comparison with theory and conclusions
A. Kagan Kagan02 used the ratio defined as
| (9) |
to obtain a first rough discrimination between radically different dependence between the form factors. At the time that Ref. Kagan02 was published, the comparison was based on 90% c.l. upper limits on the data. This test repeated with our present data give values of equal to 74 for a representative slowly falling form factor Hou:1997wy , 25 for the intermediate form factor studied by Ref. Kagan:1997 , and 2 for the perturbative QCD inspired shape. Thus the last shape is the closest to the data, although not providing a perfect match.
Different approaches have been taken to implement perturbative QCD calculations. Their difference is translated into different assumptions for the form factor , Kagan and Petrov Kagan02 assume , Ali and Parkhomenko related to the expansion of the two light-cone distribution amplitudes (LCDA) describing the quark and gluon components of the wave function. Fig. 7 shows the measured distribution, compared with three representative choices for . , , based on the asymptotic form of the meson LCDA, and corresponding to the spectrum with the Gegenbauer coefficients from the best fit range obtained by Ali and Parkhomenko ali-extended , using the previous CLEO II data and the constraints from the transitions kroll . Note that most of the discrepancy between theory and data occurs in the bin. In fact, the for the fit of the new data with this theoretical parametrization is 27. This may imply that higher order terms in the QCD expansion need to be taken into account, or that the is not the dominant source of , at least at a scaled energy as high as .
In conclusion we have measured the energy spectra of the meson in the decay . Our results are not very well described by existing models based on strong gluonic coupling of the . Thus the observed inclusive branching fraction is unlikely to be explained by an enhanced form factor, and an explanation outside the realm of the Standard Model may be needed to account for this large rate.
IV Acknowledgements
We would like to thank A. Kagan and A. Ali for useful discussions and for providing us with their calculations. We gratefully acknowledge the effort of the CESR staff in providing us with excellent luminosity and running conditions. D. Cronin-Hennessy and A. Ryd thank the A.P. Sloan Foundation. This work was supported by the National Science Foundation, the U.S. Department of Energy, and the Natural Sciences and Engineering Research Council of Canada.
References
- (1) T. E. Browder et al. [CLEO Collaboration], Phys. Rev. Let. 81, 1786 (1998), [hep-ex/9804018].
- (2) G. Bonvicini et al. [CLEO Collaboration], Phys. Rev. D 68, 011101 (2003) [hep-ex/0303009].
- (3) B. Aubert et al. [BABAR Collaboration], [hep-ex/0109034]; B. Aubert et al. [BABAR Collaboration], Phys. Rev. Lett. 93, 061801 (2004) [hep-ex/0401006].
- (4) D. Atwood and A. Soni, Phys. Lett. B 405, 150 (1997) [hep-ph/9704357].
- (5) A. L. Kagan (2002), [hep-ph/0201313].
- (6) A. Ali and A. Y. Parkhomenko, Phys. Rev. D 65, 074020 (2002) [hep-ph/0012212].
- (7) W. S. Hou and B. Tseng, Phys. Rev. Lett. 80, 434 (1998) [hep-ph/9705304].
- (8) A. Kagan and A. A. Petrov [hep-ph/9707354].
- (9) T. Muta and M. Z. Yang, [hep-ph/9909484].
- (10) P. Kroll and K. Passek-Kumericki, Phys. Rev. D 67, 054017 (2003)[hep-ph/0210045].
- (11) H. Albrecht et al. [ARGUS Collaboration], Z. Phys. C 58, 199 (1993).
- (12) M. Artuso et al. [CLEO Collaboration], Phys. Rev. D 67, 052003 (2003).
- (13) A. Ali and A. Y. Parkhomenko, Eur. Phys. J. C 30, 183 (2003) [hep-ph/0304278].
- (14) D. Peterson et al., Nucl. Instrum. Meth. A 478, 142 (2002).
- (15) Y. Kubota et al., Nucl. Instrum. Meth. A 320, 66 (1992).
- (16) M. Artuso et al., Nucl. Instrum. Meth. A 502, 91 (2003) [hep-ex/0209009].
- (17) R. Ammar et al. [CLEO Collaboration], Phys. Rev. D 57, 1350 (1998) [hep-ex/9707018].
- (18) Particle Data Group, S. Eidelemann et al., Phys. Lett. B, 1 (2004) and 2005 partial update for edition 2006 (url; http://pdg.lbl.gov).
- (19) R. Brun et al., computer code GEANT3.21, CERN Program Library Long Write Up W5013 (1992).
- (20) R. Kleiss and S. van der Marck, Nucl. Phys. B 342, 61 (1990).