Current address:]University of New Hampshire, Durham, New Hampshire 03824-3568 Current address:]Old Dominion University, Norfolk, Virginia 23529 Current address:]Old Dominion University, Norfolk, Virginia 23529 Current address:]Massachusetts Institute of Technology, Cambridge, Massachusetts 02139-4307 Current address:]University of South Carolina, Columbia, South Carolina 29208 Current address:]Physikalisches Institut der Universität Gießen, 35392 Giessen, Germany Current address:]Edinburgh University, Edinburgh EH9 3JZ, United Kingdom Current address:]University of Massachusetts, Amherst, Massachusetts 01003
The CLAS Collaboration
Search for the pentaquark in the reactions
and
Abstract
The exclusive reactions and have been studied in the photon energy range 1.6–3.8 GeV, searching for evidence of the exotic baryon in the decays and . Data were collected with the CLAS detector at the Thomas Jefferson National Accelerator Facility. The integrated luminosity was about 70 pb-1. The reactions have been isolated by detecting the and proton directly, the neutral kaon via its decay to and the neutron or neutral kaon via the missing mass technique. The mass and width of known hyperons such as , and were used as a check of the mass determination accuracy and experimental resolution. Approximately 100,000 ’s and 150,000 ’s were observed in the and final state respectively. No evidence for the pentaquark was found in the or invariant mass spectra. Upper limits were set on the production cross section of the reaction as functions of center-of-mass angle, and masses. Combining the results of the two reactions, the 95% C.L. upper limit on the total cross section for a resonance peaked at 1540 MeV was found to be 0.7 nb. Within most of the available theoretical models, this corresponds to an upper limit on the width, , ranging between 0.01 and 7 MeV.
pacs:
12.39.Mk, 13.60.Rj, 13.60.-r, 14.20.Jn, 14.80.-jI Introduction
The possible existence of baryon states beyond the usual configuration is of fundamental importance for the understanding of hadronic structure. QCD does not prohibit the existence of exotic states with different configurations such as . In fact, measurements of nucleon structure functions from high energy lepton-nucleon experiments have shown for example that “sea” quarks ( pairs) contribute significantly to the total momentum of the nucleon. Indeed usual baryons are admixtures of the standard configuration and of , , etc.
In the past, experimental searches focused on pentaquarks, i.e. baryons with a minimal structure. In 1997, Diakonov and collaborators diakonov made definite predictions about the masses and widths of a decuplet of pentaquark states (the so-called “antidecuplet”) in the framework of a chiral soliton model. The most intriguing aspect of such a multiplet is the presence of three states with exotic quantum numbers or a combination of quantum numbers not allowed for ordinary baryons: the with =+1, the and with . In particular the positive strangeness is not compatible with a state, requiring a minimal quark configuration of the type . The widths of the exotic pentaquarks were predicted by this model to be very narrow (10–15 MeV) implying that if such states exist they should be directly visible in invariant mass spectra without the need for a more sophisticated partial wave analysis.

The first evidence of a candidate was reported in October 2002 by the LEPS Collaboration, based on the re-analysis of existing data nakano . Several other experimental groups followed itep ; clas ; saphir ; clas2 ; itep2 ; hermes ; zeus ; serpu ; cosytof ; jinr reporting evidence of a peak in the mass range 1521–1555 MeV. The observation of an isospin partner of the (the ) was recently reported by the STAR Collaboration star while the observation of a second pentaquark state, the with structure, was reported by the NA49 Collaboration na49 . The first evidence for an anti-charmed pentaquark, , was reported by the H1 Collaboration h1 . While pentaquark signals observed in each experiment suffered from low statistics, the observations in many different reactions using different probes (photons, electrons, protons, neutrinos) and targets (protons, neutrons, nuclei) supported the pentaquark’s existence. On the contrary, subsequent re-analysis of data collected in a different set of experiments aleph ; babar ; belle ; bes ; cdf ; focus ; herab ; hypercp ; lass ; l3 ; phenix ; sphinx ; wa89 ; compass found no evidence of pentaquarks casting doubts about their existence.
The experimental evidences, both positive and negative, were obtained from data previously collected for other purposes in many reaction channels and in diverse kinematic conditions, thus may involve different production mechanisms. As a result, direct comparisons of the different experiments are very difficult, preventing a definitive conclusion about the pentaquark’s existence. A second generation of dedicated experiments prl ; g10 , optimized for the pentaquark search, was undertaken at the Department of Energy’s Thomas Jefferson National Accelerator Facility. These experiments covered the few GeV region in photon energy, where most of the positive evidence was reported, and collected at least an order of magnitude more data than used in the previous measurements.
The exclusive reactions and were studied with the CLAS detector B00 with 1.6 to 3.8 GeV energy photons, to look for evidence of the reaction , where the decays into or . The main results for the channel were reported in Ref. prl . In this paper we discuss in detail the analysis procedure and the results for both decay modes, combining them to give a final consistent result.
For the decay mode, the measurement of all participating particles allows one to tag the strangeness of the reaction which clearly identifies the exotic nature of the baryon produced in association with the . For the other possible decay mode, , since a was measured, the strangeness of the invariant mass system is not defined. Nevertheless, we were motivated to analyze this channel since the majority of the positive results itep ; hermes ; zeus ; serpu ; cosytof ; jinr were reported looking at this decay mode. Moreover the CLAS acceptance for the two reactions is somewhat complementary and the combination of the two channels results in complete kinematic coverage. According to many theoretical predictions, e.g. theory-treshprod ; oh04 ; Guidal ; Nam , the photon energy range covered by this experiment should be the best to explore since the is expected to have its maximum cross section near the production threshold. Also, in this kinematic region, the CLAS detector provides a mass resolution of few MeV and an accuracy in the mass determination of 1–2 MeV, which is necessary to pin down the mass and width of any narrow peak in the spectrum.
The channel was previously investigated at ELSA by the SAPHIR collaboration saphir in a similar photon energy range, finding positive evidence for a narrow state with MeV and FWHM less than 25 MeV. The most recent analysis resulted in a total production cross section of the order of 50 nb. Since this experiment completely overlaps the kinematic regions of the SAPHIR experiment, the new results put those previous findings to a direct test for the first time. Results on pentaquark searches in the exclusive reaction have never been published before.
In the following, some details are given on the experiment (Sec. II) and its analysis (Sec. III). The findings of channel are compared with the SAPHIR experiment in Sec. IV and the systematic checks are discussed in Sec. V. The final results are reported in the last section.
II The experiment
The measurement was performed using the CLAS detector in Hall B at Jefferson Lab with a bremsstrahlung photon beam produced by a continuous 60 nA electron beam of = 4.02 GeV impinging on a gold foil of thickness radiation lengths. A bremsstrahlung tagging system SO99 with a photon energy resolution of 0.1 was used to tag photons in the energy range from 1.58 GeV (about the production threshold) to a maximum energy of 3.8 GeV. A cylindrical liquid hydrogen target cell 4 cm in diameter and 40 cm long was used. Outgoing hadrons were detected in the CLAS spectrometer. Momentum information for charged particles was obtained via tracking through three regions of multi-wire drift chambers DC in conjunction with a toroidal magnetic field ( T) generated by six superconducting coils. The polarity of the field was set to bend the positive particles away from the beam into the acceptance of the detector. Time-of-flight scintillators (TOF) were used for charged hadron identification Sm99 . The interaction time between the incoming photon and the target was measured by the start counter (ST) ST . This is made of 24 strips of 2.2 mm thick plastic scintillator surrounding the hydrogen cell with a single-ended PMT-based read-out. A time resolution of 300 ps was achieved. The CLAS momentum resolution, is from 0.5 to 1%, depending on the kinematics. CLAS is well suited for simultaneous multi-hadron detection as required by experiments searching for pentaquarks (this experiment required at least 3 hadrons detected). The detector geometrical acceptance for each positive particle in the relevant kinematic region is about 40%. It is somewhat less for low energy negative hadrons, which can be lost at forward angles because their paths are bent toward the beam line and out of the acceptance by the toroidal field. Coincidences between the photon tagger and the CLAS detector triggered the recording of the events. The trigger in CLAS required a coincidence between the TOF and the ST in at least two sectors, in order to select reactions with at least two charged particles in the final state. The collected data sample contains events from several reaction channels in addition to the reactions of interest. Reactions such as , , , and have been used for systematic studies. An integrated luminosity of 70 pb-1 was accumulated in 50 days of running in 2004.
III Data Analysis
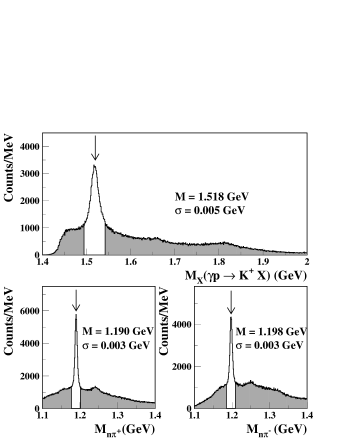
The raw data were passed through the standard CLAS reconstruction software to determine the 4-momenta of detected particles. In this phase of the analysis, corrections were applied to account for the energy loss of charged particles in the target and surrounding materials, misalignments of the drift chambers’ position, and uncertainties in the value of the toroidal magnetic field. The energy calibration of the Hall-B tagger system was performed both by a direct measurement of the pairs produced by the incoming photons tag-abs_cal and by applying an over-constrained kinematic fit to the reaction , where all particles in the final state were detected in CLAS tag-kinefit . The quality of the calibrations was checked by looking at the mass of known particles as well as their dependence on other kinematic variables (photon energy, detected particle momenta and angles). As an example, Fig. 1 shows the missing mass spectrum of the reaction : peaks of known hyperons such as the , the , and related excited states are clearly visible.
III.1 Pentaquark Analysis Strategy
The data set was independently analyzed by three groups that made use of different analysis tools and procedures. This strategy was adopted both to have a corroboration of the analysis results and an estimate of the systematic errors associated with the choice of the analysis procedure. All three analyses agreed on the main conclusions. In the following sections we report in detail the analysis procedure of one group while the comparison of the results from the different groups is discussed in Section V.3.

III.2 Reaction identification:
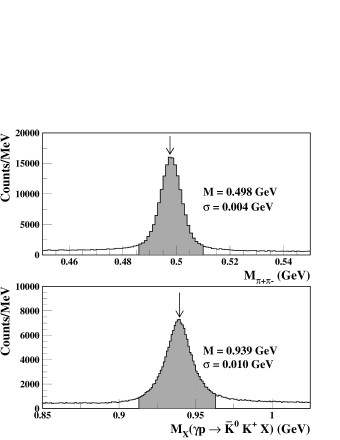
The reaction was isolated as follows. The was directly detected by the spectrometer, while the component of the was reconstructed from the invariant mass of its decay (B.R. 69%). The neutron was then reconstructed from the missing mass of all the detected particles. After its identification, the neutron mass used to calculate other kinematic variables was kept fixed at its nominal PDG value PDG . A cut around the and the neutron peaks was applied to isolate the exclusive reaction. A total of 320,000 events was selected by this procedure. Three background reactions having the same final state as the reaction of interest were clearly identified: with , , and with . Figure 2 shows the background hyperon peaks: the in the missing mass spectrum and the and peaks in the and invariant mass spectra respectively. We found MeV and MeV, with a measured experimental width 3.5 MeV for both of them. These are in excellent agreement with the world data PDG , and are a measure of the quality of the mass determination. Since these states have a much smaller width than the CLAS resolution, their observed widths provide an estimate of the experimental resolution. The reported values are in good agreement with the CLAS resolution estimated from simulations. To remove the contribution of these channels, a cut was applied around the peaks while a 24 MeV cut was applied around the peak, resulting in a total of 160,000 retained events. The resulting and neutron mass plots are shown in Fig. 3, where the two peaks are seen above small background levels. The peak positions of the reconstructed and neutron masses were found to be 4981 MeV and 9391 MeV respectively.

After all cuts, the resulting invariant mass spectrum is shown in Fig. 4. The spectrum is smooth and structureless. In particular no evidence for a peak or an enhancement is observed at masses close to 1540 MeV, where signals associated with the were previously reported. To enhance a possible resonance signal not visible in the integrated spectra, we assumed the two-body reaction and selected different center-of-mass angle intervals. Fig. 5 shows the invariant mass spectrum for different ranges. Monte Carlo studies of the CLAS acceptance for this reaction (see Sec. III.5) showed that we could detect events over the entire angular range, in spite of a drop in the efficiency at forward angles, . No structures were found in the spectra when specific angular ranges were selected.
As a demonstration of our sensitivity to baryon resonances, we derived the yield. We fit the missing mass spectrum of Fig. 2 by a Breit-Wigner function convoluted with a Gaussian function to account for the detector resolution, plus a second-order polynomial background. To derive the yield, following Ref. Jackson , we used the Breit-Wigner form:
| (1) |
where:
and are the resonance mass and intrinsic width, is the momentum in the rest frame of the system, is the same quantity evaluated at the peak, and is the relative orbital angular momentum ( for the ). In the fit was fixed to 15.6 MeV PDG while the of the Gaussian function was allowed to vary. Integrating the Breit-Wigner line in the mass range 1.45–2.0 GeV we obtained a yield of . The quoted error is dominated by the systematic uncertainty related to the shape of the Breit-Wigner and the underlying background. The mass position was found to be 1518 2 MeV, in good agreement with world data PDG , while the experimental resolution was found to be 5 MeV, typical for CLAS B00 .
III.3 Reaction identification:
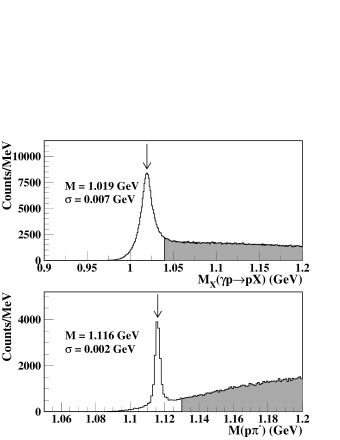
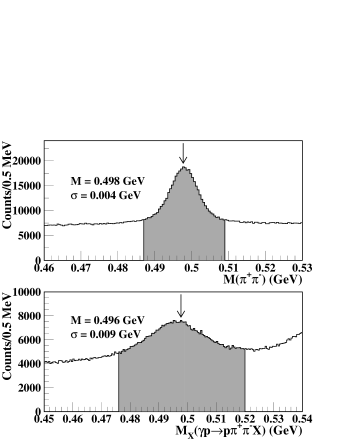
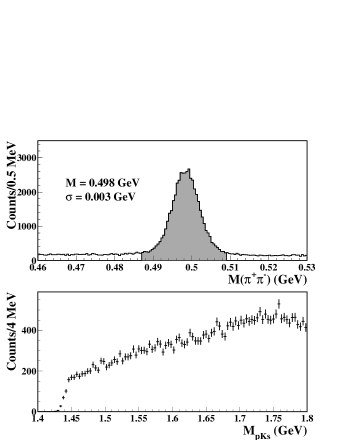
To isolate the reaction , the proton was detected by the spectrometer and a meson was reconstructed from the invariant mass of its decay (B.R. 69%). The second neutral kaon was then reconstructed from the missing mass of all the detected particles. A cut around the and the missing kaon peaks was applied to isolate the exclusive reaction. A total of 750,000 events were selected by this procedure. The reaction with has the same final state as the reaction of interest. The reaction also contributes to the background. Fig. 6 shows the background peaks: the shows up in the proton missing mass spectrum and the (1116) in the invariant mass spectrum. We found = 1019 1 MeV and MeV, with a measured experimental resolution of about 7 MeV and 2 MeV respectively. The peak was fitted with a Breit-Wigner ( MeV), convoluted with a Gaussian describing the CLAS resolution, in the same way as was done for the . The obtained masses are in agreement with world data PDG . To remove the contribution of these channels, only events with a 1.04 GeV and 1.13 GeV were retained, resulting in a total of 550,000 events. The two neutral kaon mass spectra after the background rejection are shown in Fig. 7. The two masses were found to be respectively 4981 MeV and 4963 MeV.

The selected final state contains two neutral kaons, one detected and one missing, therefore a possible peak can show up in two ways: in the invariant mass spectrum of the system or in the missing mass spectrum of the detected . Fig. 8 shows the two spectra after all cuts: both of them are smooth and structureless. In particular no evidence for a peak or an enhancement is observed at masses close to 1540 MeV, where signals associated with the were previously reported. To enhance a possible resonance signal not visible in the integrated spectra, we assumed the two body reaction and selected different center-of-mass angle intervals. The angle was calculated using the reconstructed kinematic variables of the missing kaon in the first case and the measured kinematic variables of the observed kaon in the second case. Fig. 9 shows the invariant mass and the missing mass spectra for forward and backward ranges separately. When the system is considered, Monte Carlo studies showed that the CLAS acceptance is maximum at forward and therefore complementary to what we found for the decay mode (as seen in Sec. III.2). No structures were found in any of the spectra when specific angular ranges were selected.

As shown in Fig. 7 the peak sits over a large background mainly related to multi-pion production. A cleaner sample is obtained by applying a cut on the decay length: in fact, due to the sizeable mean life (c 2.68 cm), its decay vertex () is detached from the primary production vertex (). Taking into account the vertex resolution of the CLAS detector ( 0.3 cm) and the c, we applied a 3 cm decay length cut, obtaining the mass spectra of Fig. 10. Despite the use of a cleaner sample (top panel), no structures are present in the invariant mass spectrum (bottom panel), confirming the results reported above. The decay length cut improves the signal-to-background ratio for the identification, cleaning the data sample from the multipion contamination. On the other side it reduces the yields by almost a factor five and, due to the strong correlation of the mean life with the kaon momentum, it results in a momentum-dependent cut on the sample, difficult to reproduce by Monte Carlo simulation. This also distorts the invariant mass spectrum at low values where a possible resonance is more likely produced. For these reasons, the upper limit for this decay mode are evaluated without the vertex cut.


III.4 Upper limit on the yields
Since no signal was observed, an upper limit on the yield was extracted and transformed to an upper limit on the production cross section in each reaction channel. In this section we discuss in detail the procedure adopted for the channel and, since the procedure is the same, we summarize the results for the channel .
The was assumed to be a narrow peak over a smooth background. The invariant mass spectrum was fit to the sum of a Gaussian-shape resonance and a fifth-order polynomial representing the background. The resonance position was varied from 1520 to 1600 MeV in 5 MeV steps while the width was kept fixed assuming the dominance of the experimental resolution over the intrinsic width as suggested from recent analyses of scattering data kn .
The width, , was derived by means of a Monte Carlo simulation. A zero-width resonance was generated and projected over the CLAS detector, applying the same analysis chain used to process the data. A width of of 3–4 MeV was obtained, which weakly depends on the photon energy and the emission angle. To check the consistency of the experimental resolution obtained from the Monte Carlo simulations, the same procedure was applied to the reactions , and where a direct comparison to the data is possible (see Sec. III.2). The width of the two hyperons derived from the simulations was found to be compatible with the measured values. For each value of the mass, the resonance and background yields were extracted using three different fit procedures: (1) a fit of the mass distribution binned in 4 MeV channels; (2) a likelihood fit of the unbinned spectrum; (3) as in case (1) but with the background function being fit after excluding the signal region defined as around the selected mass value. In all cases the background yield was obtained by integrating the polynomial function over of the selected mass value. In methods (1) and (2) above, the signal yield was obtained as the integral of the resulting Gaussian, while in method (3) it was obtained as the difference between the number of observed events and the background integrated over of the chosen mass value. The same procedure was then repeated subdividing the data into 16 bins producing binned spectra. The results of the three methods applied to the integrated spectrum are shown in Fig. 11. In general, the signal yields obtained with the three procedures are compatible with zero within 1 or 2 sigma, confirming that no evidence for production is observed in the mass range 1.52–1.6 GeV. The results of the binned fits and un-binned likelihood fit are in good agreement with each other showing that the binning effects are small. The measured yields and the background are shown in the top and middle panels of Fig. 12. In general the results of the three methods (, likelihood, and without the mass window) are consistent with each other as expected by the dominance of the background over the signal yield. They were combined by taking the average of the event yields, for both signal and background, in the conservative assumption of totally correlated measurements. The averaged yields were transformed into upper limits of the yield using the Feldman and Cousins approach fc99 . This method determines proper confidence level boundaries for small signals over a background taking into account external constraints (e.g. the yield is constrained to be positive). In addition it decouples the goodness-of-fit confidence level from the confidence level interval. The resulting upper limit at 95% C.L. is shown in the bottom panel of Fig. 12; it is almost flat with the maximum value around 1545 MeV.
On average, the upper limit at 95% C.L. on the yields is . The ratio of the yield of to the has also been obtained: (the two yields are not corrected for the CLAS efficiency).


The same procedure was repeated for the channel to derive an upper limit at 95% C.L. on the yield as a function of the invariant mass and on the differential cross section assuming a mass of 1540 MeV. The upper limit was derived from the mass spectrum only (the missing mass spectrum was ignored because it is correlated to the mass spectrum being built from the same event sample). The better CLAS acceptance for the proton and the coming from the decay leads to a complete angular coverage complementary to the channel. The was searched for as a narrow peak by fitting the mass spectrum with a Gaussian curve with 4 MeV inferred from dedicated Monte Carlo simulations, plus a fifth-order polynomial representing a smooth background. The mass region 1520–1600 MeV was scanned in 5 MeV steps. To derive the yields of a possible resonance and associated background the three fit procedures described for the channel were applied to the integrated spectrum and the -binned spectra for a fixed mass of 1540 MeV. The three results were combined taking the average of the event yields. These were transformed into 95% C.L. upper limits. Figure 13 shows the comparison of the 3 fitted yields as a function of the invariant mass and the resulting 95% C.L. upper limit.

III.5 Upper limits on the Cross Section
The 95% C.L. upper limits on the yield described in the previous section were then transformed into limits on the production cross section according to the following formula:
| (2) |
| (3) |
where is the 95% C.L. limit on the yield, is the CLAS efficiency, is the integrated luminosity, is the branching ratio for the decay, and subscripts indicate the decay mode of the . Each branching ratio is assumed to be 50%. The branching ratios for neutral kaon decay to () were included in the CLAS efficiency.
The luminosity was obtained as the product of the target density and length, and the incoming photon flux measured during the experiment corrected for data-acquisition dead time. When the mass was varied from 1.5 to 1.6 GeV, the production threshold in beam energy moved from 1.65 to 1.85 GeV. The photon flux used in the cross section estimate was calculated accordingly.


The CLAS detection efficiency was obtained by means of detailed Monte Carlo studies. The reaction and subsequent decay to and was generated assuming different production mechanisms: exchange dominance (the mainly produced at forward angles in the center-of-mass system), exchange dominance ( at backward angles), uniformly distributed, and using the predictions of the model in Ref. oh04 . For the exchange hypothesis we assumed the same angular distribution as for the reaction , which exhibits the typical channel forward peaking behavior (approximately an exponential with a slope of GeV-2). The exchange distribution was generated the same way except that the center-of-mass angles of the and were interchanged.
For , , the CLAS overall detection efficiencies obtained with the various production mechanisms vary between 1% for the exchange hypothesis to 1.8% for the angular distribution of Ref. oh04 when no exchange process is included. As a function of all the different hypotheses gave a comparable efficiency: almost flat from 180∘ to 90∘ (about 2) and then smoothly dropping at forward angles. For , , the efficiency varied between 1% for the angular distribution of Ref. oh04 with no exchange process to 1.8% for the channel hypothesis, with an angular dependence complementary to the other channel (smoothly increasing from backward to forward angles). For each branch, the model that yielded the lowest efficiency was chosen for conservatism. The resulting efficiencies are shown in Fig. 14.
The upper limits on the total cross sections as a function of the mass were obtained independently for each decay mode using the model assumptions described above. The results are shown in Fig. 15. For a 95% C.L. upper limit of 1.0 nb was found for = 1540 MeV. The corresponding limit for was 1.3 nb.
The 95% C.L. upper limit on the (1540) differential cross section is shown Fig. 16, using the same assumption on the production mechanisms as for the evaluation of the upper limit on the total cross section. However, for this quantity no significant difference was found when the other hypotheses were used in the efficiency evaluation. For the decay mode the cross section limit remains within 1–2 nb for most of the angular range and rises at forward angle due to the reduced CLAS acceptance. For the decay mode, the cross section limit is within 2–5 nb over the entire angular range.
Finally, for the reaction with , the (1540) total cross section upper limit as a function of the photon energy is shown in Fig. 17; the behavior reflects the CLAS efficiency, which is reduced at low energy near the (1540) production threshold, and then increases with energy, resulting in a better limit for higher energies.

IV Comparison with existing data
Our result for the reaction is in clear disagreement with the findings of Ref. saphir which reported a signal of 55 events at a mass of 1540 MeV corresponding to an estimated total cross section of 50 nb.
In order to better compare our data with this experiment, the kinematic cuts described in Ref. saphir were applied to the present data. The photon energy was limited to be below 2.6 GeV and a possible forward peaked production of the was selected by applying the angular cut . This cut also reduces the hyperon production yield. The effect is shown in Fig. 18 where the missing mass of the is shown before and after the angular cut: the is clearly suppressed. As a result, no hyperon rejection cuts were applied.
The missing mass spectrum, after all cuts, is shown in Fig. 19 with two different bin sizes reflecting the CLAS and the SAPHIR resolutions. There is no evidence of a peak.
Applying the same procedure described above, we evaluated a 95% confidence level limit on the yield with SAPHIR selection cuts of events.
To derive the yield, the missing mass spectrum obtained before the angular cut was fit by a Breit-Wigner function plus a second-order polynomial background, with the same procedure described in Sec. III.2, obtaining (57,0005,500) s. This number is to be compared to 63090 reported by SAPHIR Ref. saphir . The ratio between observed and in this experiment is differing by more than a factor 50 from the value quoted in Ref. saphir . All the yields reported above are notcorrected for detector acceptances.
No results were published on the search of the in the exclusive reaction and therefore no comparison is possible for this channel.
V Systematic errors
In the evaluation of the upper limit we have considered the following sources of systematic errors: determination of the mass resolution for the resonance, determination of the signal and background yields from the mass spectra, evaluation of the CLAS efficiency, detector inefficiencies, photon flux normalization, and dependence on the analysis procedure. The first three sources were already included in the quoted upper limit as explained in the following subsections. In particular, the model dependence in evaluating the CLAS efficiency was estimated by comparing the results obtained using different models for the production cross section. The resulting efficiencies differ by a maximum of a factor two. The upper limits were estimated using always the worse case scenario. The remaining sources of systematic uncertainty, summarized in Table 1, result in an overall systematic error of accounted for by multiplying the upper limit by (1+).
| Source | Error (%) |
|---|---|
| Detector inefficiencies | 10 |
| Photon flux normalization | 10 |
| Analysis procedure | 20 |
In the following, the different contributions to the total systematic error are discussed in more detail.
V.1 Mass resolution and evaluation of signal and background yields
As discussed in Sec. III.4 the mass resolution for a narrow resonance was estimated from Monte Carlo simulation; the reliability of simulations in reproducing the CLAS resolution was tested comparing the observed resolution for known narrow resonances and a maximum discrepancy of 20% was found. The resolution for the peak extracted from Monte Carlo was therefore rescaled by a factor 1.2 to account for this.
The comparison of different fitting procedures provides an estimate of the associated systematics. The upper limits were derived combining the results of the three fits, including therefore an estimate of the associated error.

V.2 Detector inefficiencies and normalization
As a check of the accuracy of the CLAS detector simulations and photon flux normalization, the differential and the total cross section for several known reactions were derived from this data set. Due to the high multiplicity of charged particles in the final state in our data (similar to and ) and the existence of precise measurements that can be taken as a reference, the reactions and were used as a test of the different ingredients used in our analysis. Moreover, the measurement of different final states of the same reaction, such as and for the photoproduction and and for the channel, were also used to test the hardware trigger, the photon flux normalization and the procedure to extract the CLAS efficiency. The differential and the total cross sections extracted from this data set agree with each other and with the world data within the experimental error, verifying that the different steps in the analysis are in control at the 15 level.
To directly check our ability to observe the final state involved in the pentaquark decaying into the final state, the cross section for the reaction was also extracted. As shown above, the peak is clearly visible, and the sample of 100,000 ’s made possible an analysis deriving both the differential and the total cross sections. The cross sections we obtained were compared with data from the SAPHIR lstar-saphir and NINA lstar-nina collaborations. We are in good agreement with the SAPHIR results but find a much lower cross section than that reported by NINA. The results of all these measurements will be reported elsewhere.

V.3 Dependence on the analysis procedure
Three independent analyses were conducted both on the reactions of interest for the pentaquark search and on reference reactions as . This enabled an evaluation of the systematic errors associated with the analysis procedures and provided a cross check on the results. The three analyses were not totally independent since they all used the same raw data and the same basic corrections to the measured kinematic quantities such as the energy loss. However, they used different particle identification schemes, different detector calibration procedures (for both the tagger system and the CLAS spectrometer), different Monte Carlo simulations to evaluate the CLAS efficiency, and different fit procedures to extract yields.
The differential and total cross sections obtained by the three analyses were found to be consistent with each other at the 10 level and agree with the SAPHIR measurement at the same level.

For the reaction , all three analyses agreed on the main conclusion: the and spectra are smooth and structureless and, in particular, no signal is observed at 1540 MeV where the pentaquark has been widely reported.
The mass spectra for the reaction obtained by the three analyses are shown in Fig. 20. The difference in the shape of the spectra is mainly related to the different particle identification schemes adopted by the three groups while the small differences in the bin-to-bin fluctuations are due to the different kinematic corrections applied in the analyses. Signal and background yields as a function of the mass resulting from the fit of the three spectra are shown in Fig. 21. The three analyses are consistent at the 10% level on the background estimate while they differ in the event yield evaluation. This discrepancies, reflecting the different choices in the analysis procedures, provide an estimate of the systematic error associated to the extraction of the upper limits.
The same comparison was performed for the channel with similar results.
VI Results
VI.1 Upper limits on the production cross section
The independent analyses were combined, taking the average of the event yields, and transformed into the 95% C.L. upper limit on the yields with the Feldman and Cousins procedure. They were then transformed into the 95% C.L. on the cross section using the CLAS efficiency evaluated in the most conservative scenario. Results are shown in Fig. 22.
For the reaction with the upper limit at 95% C.L. on the production cross section varies between 0.5 nb and 1.3 nb as a function of the invariant mass with a value of 0.8 nb at 1540 MeV. For the reaction with the upper limit at 95% C.L. on the production cross section varies between 0.5 nb and 2.5 nb as a function of the invariant mass with a value of 1.5 nb at 1540 MeV. The results for the two decay modes are similar in value and set stringent upper limits on the models which predict these long-lived pentaquark states.
So far the two reaction channels were independently analyzed. Assuming they result from the two possible decay modes of the , they can be combined to give a single upper limit.
As shown in the previous sections, we estimated a signal yield (with 1 and 2, corresponding to and branching mode), e.g. the area of a Gaussian of fixed width and fixed mass fit to the mass histogram, and a background yield , e.g. the polynomial background.
These were corrected for the detection efficiency and luminosity to obtain the two corresponding cross sections () and associated errors ():
with the corresponding branching ratios, the integrated luminosity and the CLAS detection efficiency.
The cross section for a possible is then built as the weighted average of the two, using the CLAS efficiency evaluated using the five models described in Sec.III.5. The dependence on the model assumptions resulted to be within 30%. The largest cross section was obtained in the hypothesis of exchange dominance then chosen for conservatism.
VI.2 Upper limits on
The production cross section is directly connected to the width (see for example Ref. Roberts ). Therefore upper limits on the cross section imply upper limits on the resonance width. However, this connection depends strongly on the theoretical model, differing by more than an order of magnitude for the available calculations Roberts ; Ko ; oh04 ; Guidal ; Nam . In Table 2, we summarize various theoretical predictions for the total cross section averaged in the energy range 2–4 GeV for different assumptions for parity and spin of the and MeV. For example, assuming our upper limit of 0.7 nb on results in a MeV within the Regge approach of Ref. Guidal and MeV for the other models. The upper bounds on the width for these models are summarized in Table 3.
VII Conclusions
In this paper we report the results of the first Jefferson Lab high statistics and high resolution experiments entirely devoted to the pentaquark search on a nucleon target. The reactions and were studied in search of evidence of the pentaquark in the and decay channels. The final states were isolated by detecting the or proton, the via its decay to and identifying the neutron or the second neutral kaon with the missing mass technique. For the former decay mode, the direct measurement of the allows the definition of the strangeness of any resonance observed in this final state. A total of 160,000 and 550,000 events were selected for the reaction and respectively, after the exclusion of background reactions. The was searched for as a narrow resonance in the and mass spectra with a width of 3–4 MeV corresponding to the CLAS resolution for these channels in the kinematic region of this experiment. Both mass spectra were found to be smooth and structureless. No evidence for a narrow resonance was found in the mass range 1520–1600 MeV. Combining the results of the two decay modes, we set an upper limit of 0.7 nb (95% confidence level) on the total production cross section for the reaction . This contradicts the results previously reported for a resonance in the reaction channel .

The accuracy in the mass determination was found to be 1–2 MeV from the comparison of the measured masses of known particles with world data. The quality of the data and the analysis procedures were tested by deriving the differential and the total cross section for some known reactions and obtaining an agreement within the experimental errors with existing measurements. The same conclusions were found by several independent analyses, giving confidence in our final results.
Due to the loose hardware trigger of the experiment, the same data set was analyzed to study the reactions and vpk++ . These findings, together with the results coming from other pentaquark search experiments at Jefferson Lab, could clear up the debate about the existence of the pentaquark.
VIII Acknowledgments
We would like to acknowledge the outstanding efforts of the staff of the Accelerator and the Physics Divisions at Jefferson Lab that made this experiment possible. This work was supported in part by the Italian Istituto Nazionale di Fisica Nucleare, the French Centre National de la Recherche Scientifique and Commissariat à l’Energie Atomique, the U.S. Department of Energy and National Science Foundation, and the Korea Science and Engineering Foundation. The Southeastern Universities Research Association (SURA) operates the Thomas Jefferson National Accelerator Facility for the United States Department of Energy under contract DE-AC05-84ER40150.
References
- (1) D. Diakonov, V. Petrov and M. Polyakov, Z. Phys. A 359, 305 (1997).
- (2) T. Nakano et al. (LEPS Collaboration), Phys. Rev. Lett. 91, 012002 (2003).
- (3) V. V. Barmin et al. (DIANA Collaboration), Phys. Atom. Nucl. 66, 1715 (2003).
- (4) S. Stepanyan et al. (CLAS Collaboration), Phys. Rev. Lett. 91, 252001 (2003).
- (5) J. Barth et al. (SAPHIR Collaboration), Phys. Lett. B 572, 127 (2003); M. Ostrick, Prog. Part. Nucl. Phys. 55, 337 (2005).
- (6) V. Kubarovsky et al. (CLAS Collaboration), Phys. Rev. Lett. 92, 032001 (2004).
- (7) A.E. Asratyan, A.G. Dolgolenko, and M.A. Kubantsev, Phys. Atom. Nucl. 67, 682 (2004).
- (8) A. Airapetian et al. (HERMES Collaboration), Phys. Lett. B 585, 213 (2004).
- (9) S. Chekanov et al. (ZEUS Collaboration), Phys. Lett. B 591, 7 (2004).
- (10) A. Aleev et al. (SVD Collaboration), Phys. At. Nucl. 68, 974 (2005) and hep-ex/0509033.
- (11) M. Abdel-Bary et al. (COSY-TOF Collaboration), Phys. Lett. B 595, 127 (2004).
- (12) P. Z. Aslanyan, V. N. Emelyanenko and G. G. Rikhkvitzkaya, Nucl. Phys. A 755, 375 (2005).
- (13) H. Huang et al. (STAR Collaboration), arXiv:nucl-ex/0509037.
- (14) C. Alt et al. (NA49 Collaboration), Phys. Rev. Lett. 92, 042003 (2004).
- (15) A. Aktas et al. (H1 Collaboration), Phys. Lett. B 588, 17 (2004).
- (16) S. Schael et al. (ALEPH Collaboration), Phys. Lett. B 599, 1 (2004).
- (17) B. Aubert et al. (BABAR Collaboration), arXiv:hep-ex/0408064.
- (18) K. Abe et al. (Belle Collaboration]), arXiv:hep-ex/0411005.
- (19) J. Z. Bai et al. (BES Collaboration), Phys. Rev. D 70, 012004 (2004).
- (20) I. V. Gorelov (CDF Collaboration), arXiv:hep-ex/0408025; D. O. Litvintsev (CDF Collaboration), Nucl. Phys. Proc. Suppl. 142, 374 (2005).
- (21) K. Stenson (FOCUS Collaboration), Int. J. Pod. Phys. A 20, 3745 (2005).
- (22) I. Abt et al. (HERA-B Collaboration), Phys. Rev. Lett. 93, 212003 (2004); K. T. Knopfle, M. Zavertyaev and T. Zivko (HERA-B Collaboratio), J. Phys. G 30, S1363 (2004).
- (23) M. J. Longo et al. (HyperCP Collaboration), Phys. Rev. D 70, 111101(R) (2004).
- (24) J. Napolitano, J. Cummings and M. Witkowski, arXiv:hep-ex/0412031.
- (25) S. R. Armstrong, Nucl. Phys. Proc. Suppl. 142, 364 (2005).
- (26) C. Pinkenburg (PHENIX Collaboration), J. Phys. G 30, S1201 (2004).
- (27) Y. M. Antipov et al. (SPHINX Collaboration), Eur. Phys. J. A 21, 455 (2004).
- (28) M. I. Adamovich et al. (WA89 Collaboration), Phys. Rev. C 72, 055201, (2005).
- (29) E. S. Ageev et al. (COMPASS Collaboration), Eur. Phys. J. C 41, 469 (2005).
- (30) M. Battaglieri et al. (CLAS Collaboration), Phys. Rev. Lett.96, 042001 (2006).
- (31) B. McKinnon et al. (CLAS Collaboration), submitted to Phys. Rev. Lett., arXiv:hep-ex/0603028.
- (32) B. Mecking et al., Nucl. Instr. and Meth. A503, 513 (2003).
- (33) T. Mart, Phys. Rev. C 71, 022202(R) (2005).
- (34) Y. Oh, H. Kim and S. H. Lee, Phys. Rev. D 69 (2004) 014009, Nucl. Phys. A745, 129 (2004); Y. Oh, K. Nakayama, and T. -S. H. Lee, Phys. Rept. 423, 49 (2006).
- (35) H. Kwee, M. Guidal, M. V. Polyakov,M. Vanderhaeghen, Phys. Rev. D 72 (2005) 054012.
- (36) S. Nam et al., Phys. Lett. B633, 483 (2006).
- (37) D.I. Sober et al., Nucl. Instr. and Meth. A440, 263 (2000).
- (38) M.D. Mestayer et al., Nucl. Instr. and Meth. A449, 81 (2000).
- (39) E.S. Smith et al., Nucl. Instr. and Meth. A432, 265 (1999).
- (40) Y.G. Sharabian et al., Nucl. Instr. and Meth. A556, 246 (2006).
- (41) S. Stepanyan et al., CLAS-Note 2005-012.
- (42) M. Williams et al., CLAS-Note 2004-017.
- (43) S. Eidelman et al., Phys. Lett. B592, 1 (2004).
- (44) J. D. Jackson, Il Nuovo Cimento 34,1644 (1964).
- (45) R. A. Arndt, I. I. Strakovsky, R. L. Workman, Phys. Rev. C68, 042201(R) (2003); R. N. Cahn and G. H. Trilling, Phys. Rev. D69, 011501(R) (2004); J. Haidenbauer and G. Krein, Phys. Rev. C68, 052201(R) (2003); W. R. Gibbs, Phys. Rev. C70, 045208 (2004); A. Sibirtsev et al., Phys. Lett. B599, 230 (2004).
- (46) G. J. Feldman and R. D. Cousins, Phys. Rev. D 57 3873 (1998).
- (47) E. Klempt et al., Proceedings of Baryons ’98 Conference, Bonn, 22-26 September 1998, World Scientific.
- (48) D. Barber et al., Z. Phys. C7, 17 (1980).
- (49) W. Roberts, Phys. Rev. C70, 065201(2004).
- (50) C .M. Ko and W. Liu, nucl-th/0410068.
- (51) V. Kubarovsky et al. (CLAS Collaboration), submitted to Phys. Rev. Lett., arXiv:hep-ex/0605001.