DESY 06-049 ISSN 0418-9833
May 2006
Measurement and QCD Analysis of the
Diffractive Deep-Inelastic Scattering Cross Section at HERA
H1 Collaboration
A detailed analysis is presented of the diffractive deep-inelastic scattering process , where is a proton or a low mass proton excitation carrying a fraction of the incident proton longitudinal momentum and the squared four-momentum transfer at the proton vertex satisfies . Using data taken by the H1 experiment, the cross section is measured for photon virtualities in the range , triple differentially in , and , where is the Bjorken scaling variable. At low , the data are consistent with a factorisable dependence, which can be described by the exchange of an effective pomeron trajectory with intercept . Diffractive parton distribution functions and their uncertainties are determined from a next-to-leading order DGLAP QCD analysis of the and dependences of the cross section. The resulting gluon distribution carries an integrated fraction of around of the exchanged momentum in the range studied. Total and differential cross sections are also measured for the diffractive charged current process and are found to be well described by predictions based on the diffractive parton distributions. The ratio of the diffractive to the inclusive neutral current cross sections is studied. Over most of the kinematic range, this ratio shows no significant dependence on at fixed and or on at fixed and .
Submitted to Eur. Phys. J. C
A. Aktas9, V. Andreev25, T. Anthonis3, B. Antunovic26, S. Aplin9, A. Asmone33, A. Astvatsatourov3, A. Babaev24,†, S. Backovic30, A. Baghdasaryan37, P. Baranov25, E. Barrelet29, W. Bartel9, S. Baudrand27, S. Baumgartner39, M. Beckingham9, O. Behnke12, O. Behrendt6, A. Belousov25, N. Berger39, J.C. Bizot27, M.-O. Boenig6, V. Boudry28, J. Bracinik26, G. Brandt12, V. Brisson27, D. Bruncko15, F.W. Büsser10, A. Bunyatyan11,37, G. Buschhorn26, L. Bystritskaya24, A.J. Campbell9, F. Cassol-Brunner21, K. Cerny32, V. Cerny15,46, V. Chekelian26, J.G. Contreras22, J.A. Coughlan4, Y.R. Coppens2, B.E. Cox20, G. Cozzika8, J. Cvach31, J.B. Dainton17, W.D. Dau14, K. Daum36,42, Y. de Boer24, B. Delcourt27, M. Del Degan39, A. De Roeck9,44, E.A. De Wolf3, C. Diaconu21, V. Dodonov11, A. Dubak30,45, G. Eckerlin9, V. Efremenko24, S. Egli35, R. Eichler35, F. Eisele12, A. Eliseev25, E. Elsen9, S. Essenov24, A. Falkewicz5, P.J.W. Faulkner2, L. Favart3, A. Fedotov24, R. Felst9, J. Feltesse8, J. Ferencei15, L. Finke10, M. Fleischer9, G. Flucke33, A. Fomenko25, G. Franke9, T. Frisson28, E. Gabathuler17, E. Garutti9, J. Gayler9, C. Gerlich12, S. Ghazaryan37, S. Ginzburgskaya24, A. Glazov9, I. Glushkov38, L. Goerlich5, M. Goettlich9, N. Gogitidze25, S. Gorbounov38, C. Grab39, T. Greenshaw17, M. Gregori18, B.R. Grell9, G. Grindhammer26, C. Gwilliam20, D. Haidt9, M. Hansson19, G. Heinzelmann10, R.C.W. Henderson16, H. Henschel38, G. Herrera23, M. Hildebrandt35, K.H. Hiller38, D. Hoffmann21, R. Horisberger35, A. Hovhannisyan37, T. Hreus3,43, S. Hussain18, M. Ibbotson20, M. Ismail20, M. Jacquet27, X. Janssen3, V. Jemanov10, L. Jönsson19, C.L. Johnson2, D.P. Johnson3, A.W. Jung13, H. Jung19,9, M. Kapichine7, J. Katzy9, I.R. Kenyon2, C. Kiesling26, M. Klein38, C. Kleinwort9, T. Klimkovich9, T. Kluge9, G. Knies9, A. Knutsson19, V. Korbel9, P. Kostka38, K. Krastev9, J. Kretzschmar38, A. Kropivnitskaya24, K. Krüger13, M.P.J. Landon18, W. Lange38, G. Laštovička-Medin30, P. Laycock17, A. Lebedev25, G. Leibenguth39, V. Lendermann13, S. Levonian9, L. Lindfeld40, K. Lipka38, A. Liptaj26, B. List39, J. List10, E. Lobodzinska38,5, N. Loktionova25, R. Lopez-Fernandez23, V. Lubimov24, A.-I. Lucaci-Timoce9, H. Lueders10, T. Lux10, L. Lytkin11, A. Makankine7, N. Malden20, E. Malinovski25, P. Marage3, R. Marshall20, L. Marti9, M. Martisikova9, H.-U. Martyn1, S.J. Maxfield17, A. Mehta17, K. Meier13, A.B. Meyer9, H. Meyer36, J. Meyer9, V. Michels9, S. Mikocki5, I. Milcewicz-Mika5, D. Milstead17, D. Mladenov34, A. Mohamed17, F. Moreau28, A. Morozov7, J.V. Morris4, M.U. Mozer12, K. Müller40, P. Murín15,43, K. Nankov34, B. Naroska10, Th. Naumann38, P.R. Newman2, C. Niebuhr9, A. Nikiforov26, G. Nowak5, K. Nowak40, M. Nozicka32, R. Oganezov37, B. Olivier26, J.E. Olsson9, S. Osman19, D. Ozerov24, V. Palichik7, I. Panagoulias9, T. Papadopoulou9, C. Pascaud27, G.D. Patel17, H. Peng9, E. Perez8, D. Perez-Astudillo22, A. Perieanu9, A. Petrukhin24, D. Pitzl9, R. Plačakytė26, B. Portheault27, B. Povh11, P. Prideaux17, A.J. Rahmat17, N. Raicevic30, P. Reimer31, A. Rimmer17, C. Risler9, E. Rizvi18, P. Robmann40, B. Roland3, R. Roosen3, A. Rostovtsev24, Z. Rurikova26, S. Rusakov25, F. Salvaire10, D.P.C. Sankey4, M. Sauter39, E. Sauvan21, F.-P. Schilling9,44, S. Schmidt9, S. Schmitt9, C. Schmitz40, L. Schoeffel8, A. Schöning39, H.-C. Schultz-Coulon13, F. Sefkow9, R.N. Shaw-West2, I. Sheviakov25, L.N. Shtarkov25, T. Sloan16, P. Smirnov25, Y. Soloviev25, D. South9, V. Spaskov7, A. Specka28, M. Steder9, B. Stella33, J. Stiewe13, A. Stoilov34, U. Straumann40, D. Sunar3, V. Tchoulakov7, G. Thompson18, P.D. Thompson2, T. Toll9, F. Tomasz15, D. Traynor18, T.N. Trinh21, P. Truöl40, I. Tsakov34, G. Tsipolitis9,41, I. Tsurin9, J. Turnau5, E. Tzamariudaki26, K. Urban13, M. Urban40, A. Usik25, D. Utkin24, A. Valkárová32, C. Vallée21, P. Van Mechelen3, A. Vargas Trevino6, Y. Vazdik25, C. Veelken17, S. Vinokurova9, V. Volchinski37, K. Wacker6, G. Weber10, R. Weber39, D. Wegener6, C. Werner12, M. Wessels9, B. Wessling9, Ch. Wissing6, R. Wolf12, E. Wünsch9, S. Xella40, W. Yan9, V. Yeganov37, J. Žáček32, J. Zálešák31, Z. Zhang27, A. Zhelezov24, A. Zhokin24, Y.C. Zhu9, J. Zimmermann26, T. Zimmermann39, H. Zohrabyan37, and F. Zomer27
1 I. Physikalisches Institut der RWTH, Aachen, Germanya
2 School of Physics and Astronomy, University of Birmingham,
Birmingham, UKb
3 Inter-University Institute for High Energies ULB-VUB, Brussels;
Universiteit Antwerpen, Antwerpen; Belgiumc
4 Rutherford Appleton Laboratory, Chilton, Didcot, UKb
5 Institute for Nuclear Physics, Cracow, Polandd
6 Institut für Physik, Universität Dortmund, Dortmund, Germanya
7 Joint Institute for Nuclear Research, Dubna, Russia
8 CEA, DSM/DAPNIA, CE-Saclay, Gif-sur-Yvette, France
9 DESY, Hamburg, Germany
10 Institut für Experimentalphysik, Universität Hamburg,
Hamburg, Germanya
11 Max-Planck-Institut für Kernphysik, Heidelberg, Germany
12 Physikalisches Institut, Universität Heidelberg,
Heidelberg, Germanya
13 Kirchhoff-Institut für Physik, Universität Heidelberg,
Heidelberg, Germanya
14 Institut für Experimentelle und Angewandte Physik, Universität
Kiel, Kiel, Germany
15 Institute of Experimental Physics, Slovak Academy of
Sciences, Košice, Slovak Republicf
16 Department of Physics, University of Lancaster,
Lancaster, UKb
17 Department of Physics, University of Liverpool,
Liverpool, UKb
18 Queen Mary and Westfield College, London, UKb
19 Physics Department, University of Lund,
Lund, Swedeng
20 Physics Department, University of Manchester,
Manchester, UKb
21 CPPM, CNRS/IN2P3 - Univ. Mediterranee,
Marseille - France
22 Departamento de Fisica Aplicada,
CINVESTAV, Mérida, Yucatán, Méxicoj
23 Departamento de Fisica, CINVESTAV, Méxicoj
24 Institute for Theoretical and Experimental Physics,
Moscow, Russiak
25 Lebedev Physical Institute, Moscow, Russiae
26 Max-Planck-Institut für Physik, München, Germany
27 LAL, Université de Paris-Sud 11, IN2P3-CNRS,
Orsay, France
28 LLR, Ecole Polytechnique, IN2P3-CNRS, Palaiseau, France
29 LPNHE, Universités Paris VI and VII, IN2P3-CNRS,
Paris, France
30 Faculty of Science, University of Montenegro,
Podgorica, Serbia and Montenegroe
31 Institute of Physics, Academy of Sciences of the Czech Republic,
Praha, Czech Republich
32 Faculty of Mathematics and Physics, Charles University,
Praha, Czech Republich
33 Dipartimento di Fisica Università di Roma Tre
and INFN Roma 3, Roma, Italy
34 Institute for Nuclear Research and Nuclear Energy,
Sofia, Bulgariae
35 Paul Scherrer Institut,
Villigen, Switzerland
36 Fachbereich C, Universität Wuppertal,
Wuppertal, Germany
37 Yerevan Physics Institute, Yerevan, Armenia
38 DESY, Zeuthen, Germany
39 Institut für Teilchenphysik, ETH, Zürich, Switzerlandi
40 Physik-Institut der Universität Zürich, Zürich, Switzerlandi
41 Also at Physics Department, National Technical University,
Zografou Campus, GR-15773 Athens, Greece
42 Also at Rechenzentrum, Universität Wuppertal,
Wuppertal, Germany
43 Also at University of P.J. Šafárik,
Košice, Slovak Republic
44 Also at CERN, Geneva, Switzerland
45 Also at Max-Planck-Institut für Physik, München, Germany
46 Also at Comenius University, Bratislava, Slovak Republic
† Deceased
a Supported by the Bundesministerium für Bildung und Forschung, FRG,
under contract numbers 05 H1 1GUA /1, 05 H1 1PAA /1, 05 H1 1PAB /9,
05 H1 1PEA /6, 05 H1 1VHA /7 and 05 H1 1VHB /5
b Supported by the UK Particle Physics and Astronomy Research
Council, and formerly by the UK Science and Engineering Research
Council
c Supported by FNRS-FWO-Vlaanderen, IISN-IIKW and IWT
and by Interuniversity
Attraction Poles Programme,
Belgian Science Policy
d Partially Supported by the Polish State Committee for Scientific
Research, SPUB/DESY/P003/DZ 118/2003/2005
e Supported by the Deutsche Forschungsgemeinschaft
f Supported by VEGA SR grant no. 2/4067/ 24
g Supported by the Swedish Natural Science Research Council
h Supported by the Ministry of Education of the Czech Republic
under the projects LC527 and INGO-1P05LA259
i Supported by the Swiss National Science Foundation
j Supported by CONACYT,
México, grant 400073-F
k Partially Supported by Russian Foundation
for Basic Research, grants 03-02-17291
and 04-02-16445
1 Introduction
Quantum Chromodynamics (QCD) is well established as the gauge field theory of the strong interaction. However, it is only able to provide reliable predictions for scattering processes if they involve short distance partonic interactions, where perturbative methods may be applied. In contrast, hadronic scattering cross sections are dominated by soft interactions, to which perturbation theory is not applicable. In a large fraction of these soft interactions, often termed ‘diffractive’, one or both of the interacting hadrons remains intact. Such processes are commonly discussed in terms of exchanges with net vacuum quantum numbers, though the exact nature of these exchanges is not well known.
The observation of high transverse momentum jet production in diffractive scattering [1] introduced the possibility of understanding the diffractive exchange in terms of partons. The presence of processes of the type (figure 1) in deep-inelastic scattering (DIS) at low Bjorken- at the HERA collider [2] offers a uniquely well controlled environment in which to study the QCD properties and structure of diffraction. Several measurements of the semi-inclusive cross section for this ‘diffractive DIS’ process have been made by the H1 [3, 4, 5, 6] and ZEUS [7, 8, 9, 10, 11] collaborations.
The detailed explanation of hard diffraction has become a major challenge in the development of our understanding of the strong interaction at high energies and low values [12]. A wide variety of models has been put forward to interpret the dynamics of diffractive DIS as well as its relationships to inclusive DIS and to diffractive hadron-hadron scattering [13, 14, 15, 16, 17, 18, 19]. A general theoretical framework is provided by the proof [20] of a hard scattering QCD collinear factorisation theorem [21, 22, 23] for semi-inclusive DIS cross sections such as that for . As illustrated in figure 1a, this theorem implies that the concept of ‘diffractive parton distribution functions’ (DPDFs) [22, 24] may be introduced, representing conditional proton parton probability distributions under the constraint of a leading final state proton with a particular four-momentum. Empirically, a further factorisation has been found to apply to good approximation, whereby the variables which describe the proton vertex factorise from those describing the hard interaction [5, 6], as illustrated in figure 1b. According to this ‘proton vertex’ factorisation, the shape of the DPDFs is independent of the four-momentum of the final state proton. The dependence of the DPDF normalisation on the proton four-vector can be parameterised conveniently using Regge asymptotics, which amounts to a description of diffraction in terms of the exchange of a factorisable ‘pomeron’ () [25] with universal parton densities [26].
Several authors have analysed diffractive DIS data to extract DPDFs [5, 27, 28, 29, 30, 16, 10, 31, 32]. In [5, 6], H1 measurements are studied, with the conclusion that the data are compatible with proton vertex factorisation at low fractional proton energy losses, . At larger , a separately factorisable sub-leading exchange (), with a different dependence and partonic composition, is present. The DPDFs extracted in [5] are dominated by the gluon distribution. Further tests of the factorisation properties of diffractive DIS have been made by comparing predictions using these DPDFs with hadronic final state observables such as diffractive jet [33] and heavy quark [34] cross sections. These tests have shown a remarkable internal consistency within the HERA DIS data. In contrast, the DPDFs extracted in DIS are not expected to be directly applicable to hadron-hadron scattering [35, 21, 22, 20]. Indeed diffractive factorisation breaks down spectacularly when the DPDFs from [5] are applied to diffractive interactions at the Tevatron [36]. However, with the introduction of an additional ‘rapidity gap survival probability’ factor to account for secondary interactions between the beam remnants [37], the HERA DPDFs remain an essential ingredient in the phenomenology of diffraction at the Tevatron and the LHC [38].
In this paper, a new measurement111The results presented here are in agreement with the previous H1 measurement using similar techniques [5] throughout most of the measured kinematic range. The new measurement and DPDFs supersede the old due to the improvements in precision, kinematic coverage, theoretical modelling and detector understanding. of the diffractive neutral current DIS cross section is presented. This is based upon H1 data for which there is an absence of hadronic activity in a large rapidity region extending close to the outgoing proton beam direction. It is thus complementary to measurements such as [6], in which the leading proton is detected and measured. The proton vertex factorisation property is tested and the dependence of the diffractive cross section on is expressed in terms of an effective pomeron intercept . The dependence on and is interpreted through a QCD analysis using the DGLAP [39] evolution equations at next-to-leading order (NLO) [40], from which new DPDFs are determined. The kinematic range of validity of the DPDFs is tested systematically and, for the first time, an assessment is made of the experimental and theoretical uncertainties. A first measurement is also made of the diffractive charged current cross section, which is compared with a prediction based on the DPDFs extracted from the neutral current data. The ratio of diffractive to inclusive cross sections and its kinematic dependences are also investigated. Section 2 introduces the formalism adopted for the paper. Section 3 describes the cross section measurement. The results are presented in sections 4–7 and are followed by a summary in section 8.
2 Diffractive DIS Kinematic Variables and Observables
The data studied here are subsets of inclusive H1 neutral and charged current DIS samples, arising from the processes and , where the positron (with four-momentum ) couples to an electroweak gauge boson (), which interacts with the proton (). The usual DIS kinematic variables are defined as
| (1) |
where is the boson virtuality, is the longitudinal momentum fraction of the proton carried by the struck quark and measures the inelasticity of the process. The squared invariant masses of the positron-proton and gauge boson-proton systems are and , respectively.
The hadronic final state of any DIS event may be broken down into two systems and , separated by the largest gap in the rapidity distribution of the hadrons relative to an axis defined by the exchanged boson and the proton in their centre of mass frame [5]. If the masses and of these two systems are small compared with the mass of the full hadronic final state, the two systems are expected to be separated by a large rapidity gap and a colourless exchange of well defined four-momentum may be considered to have taken place between them. As illustrated in figure 1a, the longitudinal momentum fractions, of the colourless exchange with respect to the incoming proton, and of the struck quark with respect to the colourless exchange, are then defined by
| (2) |
Here, is the four-momentum of the system and . The squared four-momentum transferred at the proton vertex is
| (3) |
The rapidity gap selection (section 3.4) implies that the data analysed in this paper are dominated by the case where is a lone proton and is relatively small. However, since the system is not detected directly, a small admixture of proton excitations and other systems such as leading neutrons is also present (see section 3.5).
The neutral current data are presented in the form of a ‘diffractive reduced cross section’ , integrated over the ranges of and specified in section 3.5 and related to the differential cross section measured experimentally by
| (4) |
where . Similarly to inclusive DIS [41], the reduced cross section depends on the diffractive structure functions and in the one-photon exchange approximation according to
| (5) |
For not too close to unity, holds to very good approximation. In previous measurements of inclusive diffractive DIS at HERA, the data were presented in terms of instead of .
Due to the smaller available data sample, the charged current measurements must be integrated over some or all of the kinematic variables. They are presented as a total cross section and single differentially in either , or .
3 Experimental Procedure
3.1 H1 Apparatus
The H1 coordinate system is defined such that the origin is at the nominal interaction point and the polar angle corresponds to the direction of the outgoing proton beam. The region , which has positive pseudorapidity , is referred to as the ‘forward’ hemisphere.
The interaction region is surrounded by the central tracking system, which consists of a silicon vertex detector, drift chambers and multi-wire proportional chambers, all located within a solenoidal magnetic field of . The trajectories of charged particles are measured in the range with a transverse momentum resolution of . The Forward Tracking Detector and the Backward Drift Chamber (BDC) provide track segments of charged particles at smaller and larger than the central tracker, respectively.
A highly segmented Liquid Argon (LAr) sampling calorimeter, covering the range , surrounds the tracking chambers and consists of electromagnetic and hadronic sections. The energy resolution is for electrons and for hadrons, as obtained from test beam measurements [42]. The backward direction () is covered by a lead / scintillating fibre calorimeter (SpaCal), which also has both electromagnetic and hadronic sections. The energy resolution for electrons is .
In addition to the ‘central detectors’ described above, a set of ‘forward detectors’ are also used in the present analysis. The copper / silicon Plug calorimeter, the Forward Muon Detector (FMD) and the Proton Remnant Tagger (PRT) are sensitive to hadronic activity at large pseudorapidity, near to the outgoing proton beam. The Plug enables energy measurements to be made in the pseudorapidity range . The FMD is a series of drift chambers covering the range . Primary particles produced at larger are often detected indirectly in the FMD if they undergo a secondary scattering with the beam-pipe or other material. The PRT, a set of scintillators surrounding the beam pipe at , detects charged particles in the region .
3.2 Data Samples
Different event samples are used for different ranges of the measurement, as summarised in table 1. For the interval , a ‘minimum bias’ sample (‘1997 MB’) corresponding to an integrated luminosity of is used, which was recorded during a dedicated data taking period in 1997 with unbiased triggers. For intermediate photon virtualities (), data taken throughout 1997 are used (‘1997 all’), corresponding to an integrated luminosity of . The kinematic range is covered by a sample (‘1999-2000’) corresponding to , taken in the years 1999 and 2000.
For all three samples, HERA collided positrons with protons, the positron beam energy being in each case. The proton beam energy was in 1997 and in 1999 and 2000, leading to centre of mass energies of and , respectively. The ‘1997 MB’ and ‘1997 all’ samples are used to study neutral current interactions with the scattered electron222The scattered positron is referred to as an electron throughout this paper. detected in the SpaCal calorimeter. More details of the analysis of diffractive data with SpaCal electrons may be found in [45]. The ‘1999-2000’ sample is used for the study of both neutral and charged current interactions. In the neutral current case, the scattered electron is detected in the LAr calorimeter. These measurements are further described in [46].
| range | Data Set | Proton Energy | Luminosity | ||
|---|---|---|---|---|---|
| 1997 MB | . | ||||
| 1997 all | . | ||||
| 1999-2000 | . | ||||
3.3 Selection and Reconstruction of DIS Events
The trigger conditions, detector alignment and calibration, and inclusive DIS selection criteria are very similar to those used in the analogous fully inclusive H1 analyses at low [47] and high [41] . The selection criteria are summarised below.
Neutral current DIS events are triggered by the detection of an energetic electromagnetic calorimeter cluster attributed to the scattered electron. Inefficient regions of the calorimeters, for example due to cracks between modules or poorly performing trigger cells, are not included in the analysis. The trigger efficiency is then close to for the ranges in electron energy considered here, namely for electrons detected in the SpaCal and for LAr electrons. To suppress photoproduction background, in which the scattered electron escapes undetected in the backward direction and a hadron fakes the electron signature, cuts are applied on the lateral extent and isolation of the cluster forming the electron candidate and its containment within the electromagnetic part of the calorimeter.
An event vertex, reconstructed by the central or forward tracker, is required within of the nominal interaction point for the SpaCal (LAr) electron samples. To suppress background where a photon fakes the scattered electron, a charged particle track segment must be associated to the electron candidate. This track is reconstructed in the BDC for SpaCal electron candidates and in the central tracking system for LAr electron candidates. The polar angle of the scattered electron is calculated from the interaction vertex and the BDC track (the LAr cluster) for SpaCal (LAr) electrons. In order to ensure good acceptance for the electron in the calorimeters and associated trackers, the scattered electron polar angle range considered is for the SpaCal electron samples and for the LAr electron sample.
Hadronic final state objects are reconstructed from the LAr and SpaCal calorimeters and the central tracking system using an energy flow algorithm which combines charged particle tracks with calorimeter deposits without double counting [48]. Isolated low energy calorimeter deposits are classified as noise and are rejected from the analysis. To further suppress backgrounds, a minimum of two remaining hadronic final state objects is demanded. Consistency is required between the variable , as reconstructed according to
using, respectively, the scattered electron only, the hadronic final state333Here and in the following, the four-vector of the reconstructed hadronic final state is denoted . In diffractive events, , where the leading baryonic system is not observed, this corresponds to the four-vector of the system. only [49], and the electron and hadronic final state polar angles and [50]. The criteria and remove badly reconstructed events, further suppress photoproduction background and reduce QED radiative corrections due to photon emission from the initial state positron.
The variables , and are reconstructed by combining information from the scattered electron and the hadronic final state using the method introduced in [5]:
| (6) |
This reconstruction method interpolates between the electron method at large where it has the best performance and the double angle method at low . For diffractive events, where the component of the hadronic final state is well contained in the central detectors, the polar angle is well measured and the double angle method has an improved resolution compared with that for non-diffractive events. This method yields a resolution of in , improving with increasing . The resolution in is around .
The principal selection criterion for the charged current sample is a large missing transverse momentum, corresponding to the unobserved final state neutrino. This is identified at the trigger level mainly using the Liquid Argon calorimeter. The trigger efficiency exceeds 60% throughout the kinematic range studied here. For the final selection, the missing transverse momentum must exceed . A reconstructed event vertex is required as for the neutral current case. To suppress backgrounds, further selection criteria are applied on the event topology, as described in [41]. The inclusive kinematic variables are reconstructed using the final state hadrons [49].
The selection is applied to all data samples to ensure reasonable containment of the hadronic final state in the central detectors. For the neutral current LAr electron data, the sample is restricted to for and to for , which suppresses photoproduction background.
3.4 Selection and Reconstruction of Diffractive Events
Diffractive events are selected on the basis of a large rapidity gap, separating the leading baryonic system from the system . The rapidity gap is inferred from the absence of activity in detectors sensitive to forward energy flow. The pseudorapidity of the most forward energy deposit above a noise threshold of in the LAr calorimeter must satisfy . This requirement ensures that the forward extent of the system lies within the acceptance range of the main detector components and thus that can be reconstructed reliably. There must also be no activity above noise thresholds in the Plug, FMD and PRT detectors. Studies of the correlations between the activity levels in the different forward detector components show that the LAr, Plug, FMD and PRT requirements have rejection efficiencies for events with no large rapidity gap of around 95%, 80%, 80% and 30%, respectively. These efficiencies are well described by the simulations of inclusive DIS used in the analysis (section 3.6) and the combined efficiency for the rejection of events with hadronic activity in the range is close to 100%. Corrections of around , evaluated using randomly triggered events, are applied to account for the component of the diffractive signal which is rejected due to electronic noise, synchrotron radiation or other effects which fake activity in the forward detectors.
The diffractive event kinematics are reconstructed using the mass of the system , obtained from
| (7) |
Neglecting the transverse momentum of the hadrons, this method of reconstructing reduces at large to a measurement of , thus improving the resolution where losses of hadrons in the backward () direction become significant. The resolution in varies between and in the measured kinematic range. The diffractive variables and are obtained from
| (8) |
The sensitivity of the measurement to variations in the details of the selection and reconstruction has been tested in detail. For example, there is no significant change in the results when one or more of the forward detectors is not used in the measurement. The final charged current sample is scanned visually and all events are consistent with production via scattering in the interaction region.
3.5 Measurement Ranges in and
The large rapidity gap selection yields a sample which is dominated by the single dissociation process , with the proton transverse momentum , and hence , relatively small. However, there is an admixture of proton dissociative events, , where the proton dissociation system has a small mass . The ranges of sensitivity of the measurement in and are determined by the acceptances of the forward detectors which are used to identify the large rapidity gap (section 3.4).
In order to keep the uncertainties arising from proton dissociation small and to ease comparisons with previous data [5, 33, 34], the measurement is integrated over the region
| (9) |
The correction factors applied to account for the net migrations about these limits are determined by evaluation of the forward detector response to elastic proton and proton dissociative processes444Only proton dissociation to low states is considered in this procedure. Proton dissociation with is simulated using the inclusive Monte Carlo models as described in section 3.6., using the DIFFVM [51] simulation. The ratio of the full generated proton dissociation cross section to the generated elastic cross section is taken to be 1:1. Proton dissociation is simulated using an approximate dependence, with explicit simulations of the most important resonances at low [52]. The dependence for proton dissociation follows with a slope parameter . The uncertainties are evaluated by varying the details of this simulation as described in section 3.7. The resulting correction factors are (‘1997 MB’), (‘1997 all’) and (‘1999-2000’).
Comparison of the current data with a similar measurement in which the leading proton is directly measured [6] yields a ratio of cross sections for and of which is consistent with the DIFFVM prediction of . Neither the comparison in [6], nor further studies sensitive to the larger region [45], show any evidence for a dependence of the ratio of proton dissociation to elastic cross sections on any of the measured kinematic variables in the region under study.
3.6 Simulations and Corrections to the Data
Corrections for detector inefficiencies, acceptances and migrations between , and measurement intervals are evaluated using a Monte Carlo simulation which combines several models. The RAPGAP [53] event generator simulates the processes and with , assuming proton vertex factorisation. Both pomeron and sub-leading exchanges are included, based on the DPDFs from a leading order QCD fit to previous H1 data (‘fit 2’ in [5]). The parton densities are evolved using as a scale and are convoluted with leading order QCD matrix elements. Higher order QCD radiation is modelled using initial and final state parton showers in the leading approximation [54]. Hadronisation is simulated using the Lund string model [55] as implemented in JETSET [56]. QED radiative effects, including virtual loop corrections, are taken into account via an interface to the HERACLES program [57]. Small weighting factors are applied to the neutral current simulation to ensure that the dependence matches that measured in [6] and to optimise the description of the current data. The DIFFVM model [51] is used to simulate the exclusive production of the , , and vector mesons, which contribute significantly in the SpaCal electron samples at small (high ).
Due to the small inefficiency in the rejection of events with forward hadronic activity using the forward detectors, small contributions in the selected data arise from the regions and . These backgrounds are subtracted using a simulation based on the DJANGO [58] Monte Carlo model of inclusive DIS for the SpaCal electron sample and the non-diffractive RAPGAP simulation [53] for the LAr electron and charged current samples. The cross sections in the inclusive simulations are obtained from QCD fits to recent H1 DIS data [47, 59].
Residual photoproduction background, which is sizeable only at the highest values, is subtracted on a statistical basis. Its contribution to the data is evaluated using the PHOJET [60] model for the SpaCal electron data and the PYTHIA [56] Monte Carlo model for the charged current sample. For the neutral current LAr data, the background is evaluated from the fraction of reconstructed events for which the detected lepton candidate has the opposite charge to the beam lepton, under the assumption that the background is charge symmetric [41]. The small backgrounds near from QED-Compton scattering () and from di-lepton production via photon-photon fusion () are subtracted using the COMPTON [61] and LPAIR [62] Monte Carlo simulations, respectively. In the charged current measurement, a further small background from the production of real electroweak gauge bosons is simulated using the EPVEC [63] Monte Carlo model. The normalisations and kinematic dependences of each of the background simulations have been checked using dedicated alternative selections designed to enhance the corresponding background.
3.7 Systematic Uncertainties
A detailed systematic error analysis has been performed, in which the sensitivity of the measurements to variations in the efficiencies and energy scales of the detector components and to the details of the correction procedure is tested. For the neutral current measurement, the systematic error sources leading to uncertainties which are correlated between data points are listed below.
-
•
The uncertainty on the SpaCal electromagnetic energy scale varies from 2.4% at to 0.5% at [47]. For electrons detected in the LAr calorimeter, the energy scale is known to a precision varying between 1% and 1.5%, depending on [41]. The uncertainties in the relative alignment of the different detector components are reflected in possible biases in the electron polar angle measurement at the level of for the SpaCal data [47] and between and , depending on , for the LAr data [41].
-
•
The hadronic energy scale of the LAr calorimeter is known to for all samples studied. The uncertainty on the hadronic energy scale of the SpaCal is 7% and that on the contribution to the hadronic energy measurement from charged particle tracks is 3%.
-
•
Imperfect treatment of calorimeter noise can result in a bias in the reconstruction of . The corresponding uncertainty is evaluated by varying the amount of calorimeter energy classified as noise by . This level of precision is determined by comparing the calorimeter noise subtracted in the data with the Monte Carlo model, which includes a simulation of noise based on randomly triggered events.
-
•
The efficiency with which the FMD registers activity when there is hadronic energy flow in its acceptance region is varied by 5% in the simulation. For the PRT, this efficiency is varied by 20%. The Plug energy scale is varied by 30%. These levels of uncertainty are obtained by comparison of the present data with the Monte Carlo simulation for samples in which forward detector activity is required to be present rather than absent.
-
•
The model dependence of the acceptance and migration corrections and background subtractions is estimated by varying the details of the Monte Carlo simulation within the limits permitted by the present data. In the RAPGAP simulation of diffraction for the SpaCal electron data, the distribution is reweighted by , the distribution by and , the distribution by and the distribution by . The same systematic shifts are applied for the LAr electron data, except that the powers by which the , and distributions are reweighted are increased from to , reflecting the weaker constraints on those distributions from the data at high . The normalisation of the sub-leading meson exchange in RAPGAP is varied by and that of the vector meson production simulation (DIFFVM) is varied by . The uncertainty in the background from high or , as simulated by the DJANGO and inclusive RAPGAP Monte Carlo models, is taken to be 100%. Appropriate variations are also made in the normalisations of the photoproduction, QED-Compton scattering and lepton pair production background simulations.
Several further uncertainties, listed below, affect all data points in an identical manner and are thus considered as normalisation uncertainties.
-
•
The uncertainty on the factor accounting for smearing about the and boundaries of the measurement (section 3.5) is 5.8% for the data taken in 1997 and 7.4% for the 1999-2000 data. The dominant contribution to this uncertainty arises from variations in the assumed ratio of proton dissociation to elastic proton cross sections in the range 0.5 to 2.0, which is determined from studies with alternative forward detector requirements. Smaller contributions arise from reweighting the and distributions of the proton dissociation simulation and propagating the uncertainties on the FMD, PRT and Plug detectors.
-
•
The uncertainty arising from the luminosity measurement is 1.5% for all samples.
-
•
The correction factor for diffractive events rejected due to noise fluctuations in the forward detectors is varied by 25%, which corresponds to the r.m.s. variation over the different fills of HERA. This leads to normalisation uncertainties at the level, varying slightly between the different data sets.
A final class of systematic errors leads to uncertainties which are not taken to be correlated between data points.
-
•
The calculated acceptance of the cut depends on the modelling of the hadronic final state topology. The associated uncertainty is estimated from the effect of using an alternative model for higher order QCD processes (the colour dipole approach [64] as implemented in ARIADNE [65] in place of parton showers). This results in an uncertainty which depends to good approximation on only and varies between 1.2% at and 11% at .
- •
- •
The total systematic uncertainty on each data point is formed by adding the individual contributions in quadrature. Away from the boundaries of the kinematic region studied in the neutral current measurement, the systematic error varying from point to point is around , with no single source of uncertainty dominating. The systematic error increases to typically at the largest , where the contribution from the modelling of the acceptance of the requirement becomes important. At small values, the calorimeter noise uncertainty becomes the largest. These point-to-point systematic uncertainties are to be compared with normalisation uncertainties of 6.2% and 7.6% for the SpaCal and LAr electron data, respectively, and statistical errors of between 5% and 20%.
For the charged current measurement, the statistical uncertainties are dominant. The systematic error treatment is similar to that used in the neutral current case, except that the model variations are increased in light of the lack of previous data to constrain the kinematic dependences. The largest systematic uncertainties arise from these model uncertainties, in particular from that on the sub-leading meson exchange contribution, and from the modelling of the acceptance of the requirement.
4 The Diffractive Neutral Current Cross Section
In order to obtain the reduced neutral current cross section defined in equation 4, the data are corrected to fixed values of , and , the influence of the finite bin sizes being evaluated using a parameterisation of the QCD fit described in section 5. The measurements are quoted at the Born level after the corrections for QED radiative effects described in section 3.6. For all data points shown, the acceptance, bin purity and bin stability555Purity (stability) is evaluated using the Monte Carlo simulation and is defined as the fraction of events reconstructed (generated) in a measurement bin which are also generated (reconstructed) in that bin. exceed 30 %. The results are given in numerical form in tables 4 (SpaCal electron data) and 5 (LAr electron data) and are shown graphically as described in sections 4.1 and 4.2. They can also be found at [66].
4.1 Dependences on and
The QCD properties and structure of the diffractive interaction are most easily interpreted from the dependences on (or equivalently ) and , with fixed. According to [20], DPDFs can then be defined for each fixed value, independently of the validity of proton vertex factorisation. A binning scheme is therefore adopted with fixed , and values. In order to minimise the statistical uncertainties and the systematic uncertainties associated with the reconstruction of , relatively large intervals are chosen. The binning in the much better resolved variables, and , is chosen to match previous inclusive measurements [47].
The and dependences of the reduced cross section, multiplied by , are shown in figures 2-6 at fixed values of , , , and , respectively. The results from different values complement one another in their and ranges, though there is also considerable overlap between the coverage at different values. For each value considered, the data exhibit similar and dependences.
As can be seen in figures 2a-6a, the cross section remains large up to the highest accessed values of (i.e. where ) at fixed and . This behaviour is in marked contrast to that of hadron structure functions, but is qualitatively similar to that of the photon [67]. The dependence of the data is shown for fixed and in figures 2b-6b. The reduced cross section increases with throughout most of the kinematic range, up to large . These positive scaling violations confirm earlier observations [5] and contrast with the case of inclusive scattering from hadrons, for which the cross section at fixed falls with increasing for [47].
The data in figures 2-6 are compared666The curves shown correspond to . The predictions for differ slightly at the lowest values, due to the influence of . with the results of the ‘H1 2006 DPDF Fit A’ described in section 5. This fit assumes proton vertex factorisation and includes a sub-leading exchange contribution, which is important at low and large as shown in figures 5a and 6a. It is clear from the good overall description that the data are broadly consistent with such a model. The dependence of then directly reflects the quark structure of the diffractive exchange with each quark flavour weighted by its squared electric charge, whilst the measured dependence is sensitive to the diffractive gluon density.
The dependence is quantified by fitting the data at fixed and to the form
| (10) |
such that is the first logarithmic derivative of the reduced cross section. This observable has been used previously to discriminate between different models of diffractive DIS [68]. Equation 10 is fitted to data with from each value if there are a minimum of three available data points777If only data with are included, as in the fit described in section 5, the changes to the logarithmic derivatives are small and the conclusions are unaffected.. The resulting derivatives are shown in figure 7a, after dividing by the factor , defined in equation 14, which is used to parameterise the dependence so that the results from different values can be compared in normalisation as well as in shape. Although the logarithmic derivatives at different values probe different regions, they are remarkably similar when viewed as a function of . This confirms the applicability of the proton vertex factorisation framework to the description of the current data. The lack of any significant change in behaviour at large indicates that the derivatives are not significantly affected by the presence of sub-leading exchange contributions.
According to the DGLAP evolution equations, the derivative of contains contributions due to the splittings and , convoluted with the diffractive gluon and quark densities, respectively. In figure 7b, the derivatives at are shown together with the decomposition into these two contributions according to the ‘H1 2006 DPDF Fit A’ described in section 5. The curves correspond to values which vary in order to match the average of the data which are fitted at each value. The theoretical calculation is in good agreement with the data. The derivative is determined almost entirely by the diffractive gluon density up to . The large positive derivatives in this region can thus be attributed to a large gluonic component in the DPDFs. For , the contribution to the evolution from quark splittings becomes increasingly important and the derivatives become less sensitive to the gluon density. The fall in the derivative as then arises dominantly from gluon radiation, , shifting quarks from higher to lower with increasing .
Considering diffractive DIS in terms of the elastic scattering from the proton of colour dipoles formed by partonic fluctuations of the exchanged virtual photon [69] provides a complementary framework in which to describe diffractive DIS. Modelling the exchange by two gluons in a net colour singlet configuration [70], the data at low and moderate are then described in terms of and fluctuations of transversely polarised photons, whilst the high region contains a -suppressed non-leading twist contribution from fluctuations of longitudinally polarised photons [17, 18, 71]. A significant contribution from this term could explain the tendency of the data to rise with increasing for at low (figure 2a- 4a). However, the high data in figures 2b-6b are adequately described by a single logarithmic dependence on and do not require a sum of leading and -suppressed terms.
4.2 Dependence on and Comparisons with other Data
For comparison with previous measurements of diffractive DIS and for a more detailed study of the dependence at fixed and , the reduced cross section is also measured using a binning scheme with fixed , and , as shown in figure 8. The data are multiplied by for visibility and are compared with the results of the QCD fit described in section 5, which is also in good agreement with the data obtained using this binning scheme. The dependence is roughly flat for all and values, implying that the reduced cross section approximately follows a dependence. However, when viewed in detail, there are clear deviations from this behaviour. The variations in the dependence as changes are as expected from the interplay between the leading pomeron and a sub-leading trajectory exchange, as discussed in section 5.4.
In figure 9, the measured reduced cross section is compared with results obtained by direct measurement of the final state proton using the H1 Forward Proton Spectrometer (‘H1 (FPS)’) [6] and the ZEUS Leading Proton Spectrometer (‘ZEUS (LPS)’) [10]. In figure 10, a comparison is made with ZEUS data obtained by decomposition of the inclusive distribution into diffractive and non-diffractive components (‘ZEUS ()’) [11]. Shifts, evaluated using the DPDF fit described in section 5, are applied to these data in order to transport them to the and values of the present measurement. Since no uncertainties are ascribed to this procedure, only data points for which the shifts are small and relatively insensitive to the choice of DPDFs are shown. The different contributions from proton dissociation in the different data sets are accounted for by the application of global factors of to the ‘H1 (FPS)’ and ‘ZEUS (LPS)’ data and of to the ‘ZEUS ()’ data. The former factor corresponds to the measured ratio of cross sections for and , for which the uncertainty is 0.16 (see [6] and section 3.5). The latter factor contains an additional contribution of , corresponding to the ratio of cross sections for and according to [11].
There is broad agreement between all of the data sets on the general behaviour of the diffractive cross section. The ‘H1 (FPS)’ and ‘ZEUS (LPS)’ data are compatible with the present measurement throughout the kinematic range available for comparison. A more detailed comparison with the ‘H1 (FPS)’ data is presented in [6]. The ‘ZEUS ()’ data are in good agreement with the present measurement in some regions, for example at low and low . However, there are disagreements in the low , high region and in the high , low region, which correspond to low and high values of , respectively. The high discrepancy gives rise to a weaker dependence of the ‘ZEUS ()’ cross section at low than is the case for H1 [72].
5 QCD Analysis and Diffractive Parton Distributions
The high precision and large kinematic range of the diffractive cross section data presented in this paper allow detailed tests of the factorisation properties of diffractive DIS and the extraction of DPDFs, which may be used to predict cross sections for other diffractive processes at HERA and elsewhere.
5.1 Theoretical Framework
QCD hard scattering collinear factorisation, when applied to diffractive DIS [20], implies that the cross section for the process can be written in terms of convolutions of partonic cross sections with DPDFs as
| (11) |
The partonic cross sections are the same as those for inclusive DIS. The DPDFs represent probability distributions for partons in the proton under the constraint that the proton is scattered to a particular system with a specified four-momentum. They are not known from first principles, but can be determined from fits to the data using the DGLAP [39] evolution equations. The factorisation formula in equation 11 is valid for sufficiently large and fixed , and system . It also applies to any cross section which is integrated over a fixed range in and and may thus be applied to the present data with and .
Due to kinematic constraints, it is not possible to access the full range of and using data from only one value of . A parameterisation of the dependence of the DPDFs, for which there is no clear procedure in QCD, is therefore necessary. The proton vertex factorisation framework is adopted here, such that the DPDFs are factorised into a term depending only on and and a term depending only on (or ) and :
| (12) |
This is equivalent to treating the diffractive exchange as a ‘pomeron’ with a partonic structure given by the parton distributions , the variable corresponding to the fraction of the pomeron longitudinal momentum carried by the struck quark. The ‘pomeron flux factor’ represents the probability that a pomeron with particular values of and couples to the proton. In the low region where sub-leading exchange contributions are negligible, the data presented in section 4 are consistent with factorisation of the dependence, as required for the proton vertex factorisation expressed in equation 12. There is also no evidence from the investigations in [10, 6] for any change in the or dependences as either or vary in the range relevant to the present analysis.
5.2 Fit Procedure
To determine the DPDFs, fits are made to the reduced cross section data as presented in figures 2-6, for which . In order to avoid regions which are most likely to be influenced by higher twist contributions or other problems with the chosen theoretical framework, only data with are included in the fit and the region is excluded, as explained in section 5.3. The total number of fitted data points is 190.
Input parameters describing the DPDFs at a starting scale for QCD evolution are adjusted to obtain the best description of the data after NLO DGLAP [40] evolution888Direct pomeron to parton splitting functions, leading to an inhomogeneous term in the DGLAP evolution equations [73, 32], are not considered. The presence of such a term would lead to a reduced gluon density. to and convolution of the DPDFs with coefficient functions. The fit is performed in the renormalisation scheme [74] with charm and beauty quarks treated as massive, appearing via boson gluon fusion-type processes up to order [75]. The heavy quark masses are set to world average values (see table 2). The strong coupling is set via for 3 flavours, which corresponds [76] to the world average for five flavours (table 2). The effects of are considered through its relation to the quark and gluon densities at NLO. Since the relative normalisations of the diffractive parton densities and the flux factor in equation 12 are arbitrary, no momentum sum rule is imposed.
The DPDFs are modelled in terms of a light flavour singlet distribution , consisting of , and quarks and anti-quarks with , and a gluon distribution . Here, is the longitudinal momentum fraction of the parton entering the hard sub-process with respect to the diffractive exchange, such that for the lowest order quark-parton model process, whereas for higher order processes. The quark singlet and gluon distributions are parameterised at using a similar approach to that commonly applied to hadronic parton densities [77, 78, 79], such that the most general form is
| (13) |
The exact choices of terms included for the quark singlet and gluon densities and the parameterisation scale are determined through a systematic investigation of the parameter space, as described in section 5.3. The DPDFs as defined in equation 13 are multiplied by a term in order to ensure that they vanish at , as required for the evolution equations to be solvable. The parameters and thus have the freedom to take negative as well as positive values. Modifying the argument of the exponential term within reasonable limits has no visible influence on the fit quality or the extracted DPDFs in the range of the measurement.
The dependence is parameterised using a flux factor motivated by Regge theory,
| (14) |
where the pomeron trajectory is assumed to be linear, , and the parameters and and their uncertainties are obtained from fits to H1 FPS data [6]. The values of these and other parameters which are fixed in the fits are summarised in table 2. Following the convention of [5], the value of the normalisation parameter is chosen such that at , where is the minimum kinematically accessible value of , is the proton mass and is the limit of the measurement.
| Parameter | Value | Source | |
|---|---|---|---|
| [6] | |||
| [6] | |||
| [5] | |||
| [6] | |||
| [6] | |||
| [52] | |||
| [52] | |||
| [52] | |||
To obtain a good description of the data, an additional sub-leading exchange () is included, which has a lower trajectory intercept than the pomeron and which contributes significantly only at low and large . As in [5, 6] this contribution is assumed to factorise in the same way as the pomeron term, such that equation 12 is modified to
| (15) |
The flux factor takes the form of equation 14, normalised via a parameter in the same manner as for the pomeron contribution and with fixed parameters , and obtained from other H1 measurements (see table 2). The parton densities of the sub-leading exchange are taken from a parameterisation derived from fits to pion structure function data [80]. Choosing a different parameterisation [81] does not affect the fit results significantly.
The free parameters of the fit are the , and parameters which determine the quark singlet and gluon distributions (equation 13), together with , which controls the dependence and , which controls the normalisation of the sub-leading exchange contribution. In order to constrain these parameters, a function as defined in [47] is minimised. This function involves the combined statistical and uncorrelated systematic errors for each data point and also takes account of correlations between data points caused by systematic uncertainties by allowing variations in each systematic error source at the expense of increases in the variable. Ten correlated systematic error parameters are considered for each of the SpaCal and LAr electron data sets, one for each of the error sources listed in tables 4 and 5. In this procedure, the sources of correlated uncertainty are taken to be common for the ‘1997 MB’ and ‘1997 all’ data, whereas it is assumed that there are no correlations between the uncertainties on the SpaCal and the LAr electron data. A further systematic error parameter controls the relative normalisation of the LAr electron data set with respect to the SpaCal electron data, for which the uncertainty is (section 3.7). The central results for the DPDFs and other parameters obtained from the fit are not altered significantly if all systematic uncertainties leading to correlations between the data points are ignored.
The statistical and experimental systematic errors on the data points and their correlations are propagated [82] to obtain experimental uncertainties on the DPDFs and other fit parameters, which correspond to increases in the variable by one unit. The theoretical error is obtained from variations of the assumed parameters as given in table 2, with an additional contribution expressing the sensitivity to the choice of DPDF parameterisation, obtained by varying as discussed in section 5.3. Since the pomeron flux factor is constrained simultaneously with the parton densities, the possible influence of interference between the pomeron and sub-leading exchange contributions cannot be assessed. However, in previous similar fits in which was extracted separately from the parton densities [5], changed by less than between the cases of no interference and maximum constructive interference.
5.3 Choices of Fit Parameterisation and Kinematic Range
In order to optimise the results of the fit, the sensitivity to variations in the details of the parameterisation is investigated. With the small numbers of parameters used to describe the parton densities, the values and the results of the fits are sensitive to the choice of the parameterisation scale [47], so that its value must be optimised by minimisation for each parameterisation choice. The -optimised results are then compared in order to make the final parameterisation choice. To ensure that the results of the fit are not sensitive to the kinematic range of the data included in the fit, the sensitivity of this procedure to variations in the kinematic cuts is also tested. All parton density parameterisation changes and kinematic range variations lead to extracted values of which are within the experimental uncertainties (see also section 5.4).
The only significant sensitivity to the boundaries of the chosen kinematic range occurs when the minimum value of the data included in the fit, , is varied. Whereas the quark distribution remains stable within uncertainties for all choices, the gluon distribution for increases systematically as varies between and , changing by about in total. The per degree of freedom also improves steadily as varies over this range. There is no evidence for any further variation in the gluon density for . The lowest data are therefore omitted from the fit and is chosen. The dependence is reflected in figures 2-6 as a tendency for the fit result extrapolated to to lie below the data. The dependence of the gluon density on may indicate inadequacies in the adopted formalism at the lowest values.
The fit results are not sensitive to variations in the minimum or maximum values of the data included, although the minimum is correlated with through the kinematics. There is similarly no significant change in the fit results when the minimum value of the data included is increased or when the highest data are omitted.
For the quark singlet distribution, the data require the inclusion of all three parameters , and in equation 13. By comparison, the gluon density is weakly constrained by the data, which are found to be insensitive to the parameter. The gluon density is thus parameterised at using only the and parameters. With this parameterisation, a value of yields the minimum value of for degrees of freedom. This fit is referred to as the ‘H1 2006 DPDF Fit A’ in the figures. As a measure of the parameterisation uncertainty, is varied between and , for which the variable increases by one unit. The correlated systematic error parameters have a mean close to zero and the largest shift in a correlated error source is . The fit shifts the normalisation of the LAr data relative to the SpaCal data by . Both the DPDFs and the per degree of freedom of this fit can be reproduced closely using the approach based on Chebyshev polynomials in [5].
As discussed in section 4.1 (figure 7b), the dependence of the data at fixed and determines the gluon density well at low . However, as increases the derivative becomes smaller and the fractional error on the gluon density becomes correspondingly larger. At the highest values, where the evolution is driven by quarks, the dependence of becomes insensitive to the gluon density. The results for the gluon density at large are thus determined principally by the data at lower coupled with the parameterisation choice. This lack of sensitivity is confirmed by repeating the fit with the parameter , which determines the high behaviour, set to zero. Apart from the exponential term, the gluon density is then a simple constant at the starting scale for evolution, which is chosen to be by minimisation. Even with this very simple parameterisation of the gluon density, the variable increases only slightly to , with degrees of freedom. This fit is referred to as the ‘H1 2006 DPDF Fit B’ in the figures.
5.4 Diffractive Parton Distributions and Effective Pomeron Intercept
A good description of the data is obtained throughout the fitted range , and by both H1 2006 DPDF Fit A and Fit B. The results of Fit A are compared with the measured reduced cross section in figures 2-6. The results for the fit parameters are given in table 3. They can also be found together with the correlation coefficients between the parameters at [66].
| Fit Parameter | Fit A | Fit B | ||
|---|---|---|---|---|
| (fixed) | ||||
The diffractive quark singlet and gluon distributions from Fit A are shown together with their uncertainties on a logarithmic scale in figure 11. In order to illustrate the high region in more detail, they are also shown on a linear scale in figure 12, where they are compared with the results from Fit B. At low , both the quark singlet and the gluon densities remain large up to the highest values accessed. The quark singlet distribution is well constrained, with an uncertainty of typically and good agreement between the results of Fit A and Fit B. The gluon distribution has a larger uncertainty of typically at low to moderate and low , dominated by the influence of the variation. For , where the sensitivity to the gluon density becomes poor, the level of agreement between Fit A and Fit B worsens.
As shown in figure 13, the fraction of the exchanged momentum carried by gluons integrated over the range , corresponding approximately to that of the measurement, is around throughout the range studied, confirming the conclusion from earlier work [5, 27]. The integrated gluon fraction is somewhat smaller for Fit B due to the lower gluon density at large values, though the results from the two fits are consistent within the uncertainties.
Fit A yields an effective pomeron intercept of
| (16) |
where the first error is the full experimental uncertainty and the second expresses the model dependence. This model dependence uncertainty arises dominantly from the variation of , which is strongly positively correlated with , such that increases to around if is set to . The intercept has also been shown to be strongly sensitive to the value of [83], though with the NLO treatment adopted here, is determined in the fit and no additional uncertainty is included. The influence of on the reduced cross section according to the fit is shown for in figure 4a. It is similar at other values of .
The extracted is slightly higher than the value expected for the ‘soft’ pomeron [84] describing long distance hadronic interactions. The result is compatible with that obtained from ZEUS data for [11]. However, in [11], evidence was reported for an increase of for . In some models [17, 18], a dependent has also been suggested. Any such dependence of on or implies a breakdown of proton vertex factorisation. In order to test for such effects in the present data, the QCD fit is repeated with additional free parameters corresponding to independent values of in different ranges of or . As can be seen from the results in figure 14, there is no evidence for any variation of with either variable within the kinematic range of the fit. This remains the case if the data with are included. This lack of dependence of contrasts with the dependent effective pomeron intercept extracted in a Regge approach to inclusive small proton structure function data, as discussed further in section 7.
The presence of the sub-leading exchange term is required by the data, the increasing by approximately 40 units if only the pomeron contribution is included. Its relative size is expressed through the normalisation parameter (Fit A), where the dominant uncertainty arises from the correlation with . The sub-leading exchange plays a significant role at high and low , as shown in figures 5a and 6a. It accounts for around () of the cross section at and is negligible at lower .
6 The Diffractive Charged Current Cross Section
The diffractive charged current process is sensitive to the diffractive , , and densities at large scales. Assuming factorisation, the measurement of the charged current cross section thus tests the assumed flavour decomposition of the quark singlet component of the DPDFs, which is completely unconstrained by the neutral current data. The total charged current cross section integrated over the range , and at is measured to be
| (17) |
corresponding to of the total charged current cross section [41] for the same and ranges, with .
The measured charged current cross section is compared with the prediction of the ‘2006 DPDF Fit A’ to the neutral current diffractive DIS data described in section 5.4. The prediction is obtained by implementing the DPDFs extracted from the neutral current data in the RAPGAP [53] Monte Carlo generator. The light quark-initiated contributions are calculated at lowest order and the contribution is calculated using the matrix element. Leading log () parton showers are used to approximate higher order QCD radiation. The resulting cross section prediction is , which is compatible with the measurement. The experimental uncertainties on the DPDFs and the theoretical uncertainties detailed in table 2 lead to negligible errors on the predictions by comparison with the statistical error on the measured cross section.
The charged current cross section measurement is shown differentially in , and in figures 15a-c, respectively. The numerical values are given in table 6. In all cases, the predictions derived from the DPDFs of section 5.4 are in agreement with the measurements. The charged current data are thus consistent with the singlet quark distribution assumed in the DPDF fit, where all light quark and antiquark densities are taken to be equal, although the large statistical uncertainties preclude strong conclusions. The contribution in the model from the sub-leading exchange is shown as a dashed line in the figures. It contributes at the level for and is negligible at lower .
7 Comparison between Diffractive and Inclusive DIS
In hadronic scattering, close connections have been drawn between the diffractive and the total cross sections, for example via the generalisation of the optical theorem to diffractive dissociation processes [85]. These connections are carried forward into many models of low DIS [15, 14, 18]. Comparing the and dynamics of the diffractive with the inclusive cross section is therefore a powerful means of developing our understanding of high energy QCD, comparing the properties of the DPDFs with their inclusive counterparts and testing models.
The evolution of the diffractive reduced cross section with is compared with that of the inclusive DIS reduced cross section by forming the ratio
| (18) |
at fixed and , using parameterisations of the data from999The inclusive reduced cross section is denoted in [41]. [47, 41]. This ratio, which was also studied in [10], is shown multiplied by in figures 16 and 17, as a function of for all measured and values. In order to compare the dependences of the diffractive and the inclusive cross sections quantitatively, the logarithmic derivative of their ratio, , is extracted through fits of a similar form to equation 10, whereby
| (19) |
The fits are overlayed on the data in figures 16 and 17. The resulting values of are shown in figure 18, where they are divided by the flux factor (equation 14), to allow comparisons between different values. Since the dominant uncertainties arise from the diffractive data, the statistical fluctuations in figure 18 reproduce those of figure 7a.
The ratio of the diffractive to the inclusive cross section is remarkably flat as a function of for most and values, such that the derivative of the ratio is consistent with zero. At the highest , where approaches , the ratio falls with increasing and the derivative becomes negative. This occurs in a manner which depends to good approximation on only; at fixed , there is no significant dependence of the logarithmic derivative on .
The compatibility of the derivative of the ratio with zero over much of the kinematic range implies that . Whereas the diffractive and inclusive reduced cross sections are closely related to their respective quark densities, the derivatives are approximately proportional to the relevant gluon densities in regions where the evolution is dominated by the splitting (see section 4.1 and [86]). The compatibility of with zero for thus implies that the ratio of the quark to the gluon density is similar in the diffractive and inclusive cases when considered at the same values. Indeed, global fits to inclusive DIS data [41, 78, 79] yield gluon fractions of approximately 70% at low , compatible with the results of section 5.4. At higher , where the DPDFs develop a more complicated structure (see figure 11) and the splitting becomes important in the evolution (see section 4.1), becomes negative.
The ratio defined in equation 18 can also be plotted as a function of (or ) with and fixed. However, this results in a complicated dependence, which is driven by the high structure of the diffractive reduced cross section (figures 2-6a).
The dependence of the ratio of the diffractive to the inclusive cross section has been studied previously101010The analyses in [8, 11, 9] differ from that described here in that the data were plotted as a function of . In [8, 11], the results were also shown integrated over ranges in , whereas they are presented here at fixed values. at fixed [8, 11, 9] rather than fixed . Using the diffractive data as presented in figure 8, the quantity
| (20) |
is formed. Assuming proton vertex factorisation and neglecting contributions from sub-leading exchanges, the generalised optical theorem [85] predicts that this ratio is independent of and depends only weakly on and for sufficiently large . In models in which both the diffractive and the inclusive cross sections are governed by a universal pomeron [84], the remaining weak dependence of the ratio arises due to the deviations from unity of the pomeron trajectory.
The ratio defined in equation 20 is shown in figure 19 as a function of in bins of fixed , and hence . In order to simplify the interpretation, data points are excluded if, according to the QCD fit in section 5, the sub-leading exchange contribution is larger than 10% or differs by more than 10% from due to the influence of . Only and values for which there are at least two remaining data points are shown. The ratio in equation 20 is indeed approximately constant throughout the full kinematic range, except at large values (the low “non-triple-Regge” region in which [85] is not applicable). In particular, the (and hence the ) dependence at fixed , and is strikingly flat, substantiating the conclusions of [8, 11, 9].
Expressed in terms of Regge trajectories, the ratio of cross sections shown in figure 19 is proportional to , where . Here is the effective pomeron trajectory for diffractive DIS and is the effective pomeron intercept governing inclusive scattering. Analysis of inclusive DIS data has shown that is not universal, but varies with according to [87]. A prediction is overlaid in figure 19, where it is assumed that the diffractive depends on in the same way as and that (see section 5.2). Similar results are obtained with or . The normalisation of the prediction is obtained from separate fits to the data for each pair of and values. The description of the data is poor ( based on statistical and uncorrelated systematic errors for degrees of freedom). The ratio shown in figure 19 is also compared with a prediction where the inclusive data are described by the same dependent of [87] and the diffractive dependence is determined by the flux factor defined in equation 14, such that (equation 16) independently of . A much improved description is obtained (), with an dependence of the ratio which changes slowly with , being approximately flat in the region of .
The ratio of cross sections shown in figure 19 is incompatible with a simple Regge approach to scattering, where both the diffractive and the inclusive cross sections are driven by the exchange of the same pomeron trajectory, even if that trajectory is allowed to change with . There is thus no simple relationship within a Regge model between the diffractive and inclusive cross sections. The flatness of the ratio of cross sections is natural if rapidity gap formation is a random process [15, 14] and has also been interpreted in colour dipole models [18].
8 Summary
The reduced semi-inclusive diffractive cross section is measured for the process under the conditions and for various fixed values of in the range . The data span nearly three orders of magnitude in from to and cover the range . In the best measured region, the statistical and point-to-point systematic uncertainties are at the level of each, with an additional normalisation uncertainty of . The kinematic dependences of the ratio of the diffractive to the inclusive reduced cross section are also studied.
Up to small deviations at large and low , which are consistent with expectations from the presence of a sub-leading exchange, the and dependences of the diffractive data change only in normalisation at different values. This remarkable feature is compatible with a factorisable proton vertex. The variation of with can be expressed in terms of an effective pomeron trajectory with intercept if is taken from H1 Forward Proton Spectrometer data. The (or ) dependence of the diffractive cross section at fixed and is similar to that of the inclusive cross section. The diffractive and inclusive dependences cannot be interpreted with a single dependent effective pomeron trajectory.
The and dependences of are interpreted in terms of diffractive parton distribution functions (DPDFs), obtained through an NLO DGLAP QCD fit. The DPDFs correspond to integrals over the measured and ranges and are valid in the region , and . At low , the diffractive data exhibit a rather fast rise with increasing at fixed and . This rise of the diffractive cross section is very similar to that of the inclusive cross section at the same values, implying that the ratio of quarks to gluons is similar in the diffractive and inclusive cases. The low data give good constraints on the diffractive quark singlet and gluon densities at low momentum fractions , with combined experimental and theoretical uncertainties of typically and , respectively. The gluon density dominates the DPDFs in this region. At larger , the diffractive quark density remains well constrained by the fit, whereas the sensitivity to the gluon density becomes increasingly poor.
At high , charged current scattering is used to test the assumptions on the quark flavour decomposition of the DPDFs. Total and single differential diffractive charged current cross sections are measured and are well described by predictions based on the DPDFs extracted from the neutral current data, though the current level of experimental precision ( for the total cross section) is low. The DPDFs will provide important input to future tests of the factorisation properties of diffraction and to the prediction of cross sections for diffractive processes at HERA, the LHC and elsewhere.
Acknowledgements
We are grateful to the HERA machine group whose outstanding efforts have made this experiment possible. We thank the engineers and technicians for their work in constructing and now maintaining the H1 detector, our funding agencies for financial support, the DESY technical staff for continual assistance and the DESY directorate for support and for the hospitality which they extend to the non DESY members of the collaboration.
References
- [1] A. Brandt et al. [UA8 Collaboration], Phys. Lett. B 297 (1992) 417.
-
[2]
M. Derrick et al. [ZEUS Collaboration],
Phys. Lett. B 315 (1993) 481;
T. Ahmed et al. [H1 Collaboration], Nucl. Phys. B 429 (1994) 477. - [3] T. Ahmed et al. [H1 Collaboration], Nucl. Phys. B 439 (1995) 471 [hep-ex/9503001].
- [4] T. Ahmed et al. [H1 Collaboration], Phys. Lett. B 348 (1995) 681 [hep-ex/9503005].
- [5] C. Adloff et al. [H1 Collaboration], Z. Phys. C 76 (1997) 613 [hep-ex/9708016].
- [6] H1 Collaboration, “Diffractive Deep-Inelastic Scattering with a Leading Proton at HERA”, DESY 06-048, submitted to Eur. Phys. J. C.
- [7] M. Derrick et al. [ZEUS Collaboration], Z. Phys. C 68 (1995) 569 [hep-ex/9505010].
- [8] J. Breitweg et al. [ZEUS Collaboration], Eur. Phys. J. C 6 (1999) 43 [hep-ex/9807010].
- [9] S. Chekanov et al. [ZEUS Collaboration], Eur. Phys. J. C 25 (2002) 169 [hep-ex/0203039].
- [10] S. Chekanov et al. [ZEUS Collaboration], Eur. Phys. J. C 38 (2004) 43 [hep-ex/0408009].
- [11] S. Chekanov et al. [ZEUS Collaboration], Nucl. Phys. B 713 (2005) 3 [hep-ex/0501060].
- [12] A. Hebecker, Phys. Rept. 331 (2000) 1 [hep-ph/9905226].
- [13] N. Nikolaev and B. Zakharov, Z. Phys. C 53 (1992) 331.
-
[14]
W. Buchmüller and A. Hebecker,
Phys. Lett. B 355 (1995) 573
[hep-ph/9504374];
W. Buchmüller, T. Gehrmann and A. Hebecker, Nucl. Phys. B 537 (1999) 477 [hep-ph/9808454]. -
[15]
A. Edin, G. Ingelman and J. Rathsman,
Phys. Lett. B 366 (1996) 371
[hep-ph/9508386];
A. Edin, G. Ingelman and J. Rathsman, Z. Phys. C 75 (1997) 57 [hep-ph/9605281];
J. Rathsman, Phys. Lett. B 452 (1999) 364 [hep-ph/9812423];
S. Brodsky, R. Enberg, P. Hoyer and G. Ingelman, Phys. Rev. D 71 (2005) 074020 [hep-ph/0409119]. -
[16]
F. Hautmann, Z. Kunszt and D. Soper,
Nucl. Phys. B 563 (1999) 153
[hep-ph/9906284];
F. Hautmann and D. Soper, Phys. Rev. D 63 (2000) 011501 [hep-ph/0008224]. - [17] J. Bartels, J. Ellis, H. Kowalski and M. Wüsthoff, Eur. Phys. J. C 7 (1999) 443 [hep-ph/9803497].
-
[18]
K. Golec-Biernat and M. Wüsthoff,
Phys. Rev. D 59 (1999) 014017
[hep-ph/9807513];
K. Golec-Biernat and M. Wüsthoff, Phys. Rev. D 60 (1999) 114023 [hep-ph/9903358];
J. Bartels, K. Golec-Biernat and H. Kowalski, Phys. Rev. D 66 (2002) 014001 [hep-ph/0203258]. - [19] A. Martin, M. Ryskin and G. Watt, Phys. Rev. D 70 (2004) 091502 [hep-ph/0406225]; G. Watt, A. Martin and M. Ryskin, Phys. Lett. B 627 (2005) 97 [hep-ph/0508093].
- [20] J. Collins, Phys. Rev. D 57 (1998) 3051 [Erratum-ibid. D 61 (2000) 019902] [hep-ph/9709499].
- [21] A. Berera and D. Soper, Phys. Rev. D 50 (1994) 4328 [hep-ph/9403276].
- [22] A. Berera and D. Soper, Phys. Rev. D 53 (1996) 6162 [hep-ph/9509239].
- [23] Z. Kunszt and W. J. Stirling, Proc. of the Workshop on Deep-Inelastic Scattering and Related Phenomena DIS96, eds. G. D’Agostini, A. Nigro, Rome (1996) 240 [hep-ph/9609245].
-
[24]
L. Trentadue and G. Veneziano,
Phys. Lett. B 323 (1994) 201;
M. Grazzini, L. Trentadue and G. Veneziano, Nucl. Phys. B 519 (1998) 394 [hep-ph/9709452]. -
[25]
E. Feinberg and I. Pomeranchuk, Suppl. Nuovo. Cimento. 3 (1956) 652;
V. Gribov, JETP Lett. 41 (1961) 667. -
[26]
G. Ingelman and P. Schlein,
Phys. Lett. B 152 (1985) 256;
A. Donnachie and P. Landshoff, Phys. Lett. B 191 (1987) 309 [Erratum-ibid. B 198 (1987) 590]. - [27] J. Breitweg et al. [ZEUS Collaboration], Eur. Phys. J. C 5 (1998) 41 [hep-ex/9804013].
- [28] K. Golec-Biernat and J. Kwiecinski, Phys. Lett. B 353 (1995) 329 [hep-ph/9504230].
- [29] T. Gehrmann and W. J. Stirling, Z. Phys. C 70 (1996) 89 [hep-ph/9503351].
- [30] L. Alvero, J. Collins, J. Terron and J. Whitmore, Phys. Rev. D 59 (1999) 074022 [hep-ph/9805268].
- [31] C. Royon et al., Phys. Rev. D 63 (2001) 074004 [hep-ph/0010015].
-
[32]
A. Martin, M. Ryskin and G. Watt,
Eur. Phys. J. C 37 (2004) 285
[hep-ph/0406224];
A. Martin, M. Ryskin and G. Watt, Eur. Phys. J. C 44 (2005) 69 [hep-ph/0504132];
G. Watt, Proc. of the Workshop on New Trends in HERA Physics, ed. G. Grindhammer et al., Ringberg Castle, Germany (2005) 303 [hep-ph/0511333]. -
[33]
C. Adloff et al. [H1 Collaboration],
Eur. Phys. J. C 6 (1999) 421
[hep-ex/9808013];
C. Adloff et al. [H1 Collaboration], Eur. Phys. J. C 20 (2001) 29 [hep-ex/0012051]. - [34] C. Adloff et al. [H1 Collaboration], Phys. Lett. B 520 (2001) 191 [hep-ex/0108047].
- [35] J. Collins, L. Frankfurt and M. Strikman, Phys. Lett. B 307 (1993) 161 [hep-ph/9212212].
-
[36]
F. Abe et al. [CDF Collaboration],
Phys. Rev. Lett. 79 (1997) 2636;
F. Abe et al. [CDF Collaboration], Phys. Rev. Lett. 78 (1997) 2698 [hep-ex/9703010];
B. Abbott et al. [D0 Collaboration], Phys. Lett. B 531 (2002) 52 [hep-ex/9912061];
T. Affolder et al. [CDF Collaboration], Phys. Rev. Lett. 84 (2000) 5043;
T. Affolder et al. [CDF Collaboration], Phys. Rev. Lett. 85 (2000) 4215;
V. Abazov et al. [D0 Collaboration], Phys. Lett. B 574 (2003) 169 [hep-ex/0308032]. -
[37]
J. Bjorken,
Phys. Rev. D 47 (1993) 101;
E. Gotsman, E. Levin and U. Maor, Phys. Lett. B 309 (1993) 199 [hep-ph/9302248];
E. Gotsman, E. Levin and U. Maor, Phys. Lett. B 438 (1998) 229 [hep-ph/9804404]; B. Cox, J. Forshaw and L. Lönnblad, JHEP 9910 (1999) 023 [hep-ph/9908464];
A. Kaidalov, V. Khoze, A. Martin and M. Ryskin, Phys. Lett. B 567 (2003) 61 [hep-ph/0306134]. - [38] M. Arneodo et al., Proc. of the HERA-LHC workshop, eds. A. De Roeck, H. Jung, CERN-2005-014 (2005) 417 [hep-ex/0601013].
-
[39]
V. Gribov and L. Lipatov,
Sov. J. Nucl. Phys. 15 (1972) 438
[Yad. Fiz. 15 (1972) 781];
V. Gribov and L. Lipatov, Sov. J. Nucl. Phys. 15 (1972) 675 [Yad. Fiz. 15 (1972) 1218];
Y. Dokshitzer, Sov. Phys. JETP 46 (1977) 641 [Zh. Eksp. Teor. Fiz. 73 (1977) 1216];
G. Altarelli and G. Parisi, Nucl. Phys. B 126 (1977) 298. - [40] W. Furmanski and R. Petronzio, Z. Phys. C 11 (1982) 293.
- [41] C. Adloff et al. [H1 Collaboration], Eur. Phys. J. C 30 (2003) 1 [hep-ex/0304003].
-
[42]
B. Andrieu et al. [H1 Calorimeter Group],
Nucl. Instrum. Meth. A 336 (1993) 499;
B. Andrieu et al. [H1 Calorimeter Group], Nucl. Instrum. Meth. A 350 (1994) 57. -
[43]
I. Abt et al. [H1 Collaboration],
Nucl. Instrum. Meth. A 386 (1997) 310;
I. Abt et al. [H1 Collaboration], Nucl. Instrum. Meth. A 386 (1997) 348. - [44] R. Appuhn et al. [H1 SPACAL Group], Nucl. Instrum. Meth. A 386 (1997) 397.
-
[45]
C. Johnson,
Ph.D. Thesis, University of Birmingham (2002), available from
http://www-h1.desy.de/publications/theses_list.html;
Y. Coppens, Ph.D. Thesis, University of Birmingham (2004), available from
http://www-h1.desy.de/publications/theses_list.html. -
[46]
P. Laycock,
Ph.D. Thesis, University of Liverpool (2003), available from
http://www-h1.desy.de/publications/theses_list.html. - [47] C. Adloff et al. [H1 Collaboration], Eur. Phys. J. C 21 (2001) 33 [hep-ex/0012053].
- [48] C. Adloff et al. [H1 Collaboration], Z. Phys. C 74 (1997) 221 [hep-ex/9702003].
- [49] A. Blondel and F. Jacquet, Proc. of the Study of an Facility for Europe, ed. U. Amaldi, DESY 79/48 (1979) 391.
- [50] S. Bentvelsen et al., Proceedings of the Workshop “Physics at HERA”, eds. W. Buchmüller, G. Ingelman, DESY (1992) 23; C. Hoeger, ibid. 43.
- [51] B. List, B. List and A. Mastroberardino, Proc. of the Workshop on Monte Carlo Generators for HERA Physics, eds. A. Doyle, G. Grindhammer, G. Ingelman, H. Jung, DESY-PROC-1999-02 (1999) 396.
- [52] S. Eidelman et al. [Particle Data Group], Phys. Lett. B 592 (2004) 1.
-
[53]
H. Jung,
Comput. Phys. Commun. 86 (1995) 147;
(see also http://www.desy.de/jung/rapgap.html). - [54] M. Bengtsson and T. Sjöstrand, Z. Phys. C 37 (1988) 465.
- [55] B. Andersson, G. Gustafson, G. Ingelman and T. Sjöstrand, Phys. Rept. 97 (1983) 31.
- [56] T. Sjöstrand, Comput. Phys. Commun. 82 (1994) 74.
- [57] A. Kwiatkowski, H. Spiesberger and H. Möhring, Comput. Phys. Commun. 69 (1992) 155.
- [58] G. Schüler and H. Spiesberger, Proc. of the Workshop on Physics at HERA, eds. W. Buchmüller, G. Ingelman, Hamburg, DESY (1992) 1419.
- [59] C. Adloff et al. [H1 Collaboration], Eur. Phys. J. C 13 (2000) 609 [hep-ex/9908059].
- [60] R. Engel and J. Ranft, Phys. Rev. D 54 (1996) 4244 [hep-ph/9509373].
- [61] A. Courau and P. Kessler, Phys. Rev. D 46 (1992) 117.
- [62] S. Baranov, O. Dünger, H. Shooshtari and J. Vermaseren, Proc. of the Workshop on Physics at HERA, eds. W. Buchmüller, G. Ingelman, Hamburg, DESY (1992) 1478.
- [63] U. Baur, J. Vermaseren and D. Zeppenfeld, Nucl. Phys. B 375 (1992) 3.
- [64] G. Gustafson, Phys. Lett. B 175 (1986) 453.
- [65] L. Lönnblad, Comput. Phys. Commun. 71 (1992) 15.
-
[66]
Data tables and detailed fit results can be found at
http://www-h1.desy.de/h1/www/publications/htmlsplit/DESY-06-049.long.html. - [67] R. Nisius, Phys. Rept. 332 (2000) 165 [hep-ex/9912049].
-
[68]
M. Gay Ducati, V. Goncalves and M. Machado,
Phys. Lett. B 506 (2001) 52
[hep-ph/0010059];
M. Gay Ducati, V. Goncalves and M. Machado, Nucl. Phys. A 697 (2002) 767 [hep-ph/0103245];
M. Gay Ducati, E. Ferreiro, M. Machado and C. Salgado, Eur. Phys. J. C 24 (2002) 109 [hep-ph/0110184]. - [69] M. Wüsthoff, Phys. Rev. D 56 (1997) 4311 [hep-ph/9702201].
-
[70]
F. Low,
Phys. Rev. D 12 (1975) 163;
S. Nussinov, Phys. Rev. Lett. 34 (1975) 1286. - [71] A. Hebecker and T. Teubner, Phys. Lett. B 498 (2001) 16 [hep-ph/0010273].
- [72] P. Newman and F.-P. Schilling, Proc. of the HERA-LHC workshop, eds. A. De Roeck, H. Jung, CERN-2005-014 (2005) 482 [hep-ex/0511032].
-
[73]
M. Ryskin,
Sov. J. Nucl. Phys. 52 (1990) 529
[Yad. Fiz. 52 (1990) 828,
Nucl. Phys. Proc. Suppl. 18C (1990) 162];
E. Levin and M. Wüsthoff, Phys. Rev. D 50 (1994) 4306. - [74] W. Bardeen, A. Buras, D. Duke and T. Muta, Phys. Rev. D 18 (1978) 3998.
-
[75]
E. Laenen, S. Riemersma, J. Smith and W. van Neerven,
Nucl. Phys. B 392 (1993) 162;
E. Laenen, S. Riemersma, J. Smith and W. van Neerven, Nucl. Phys. B 392 (1993) 229. - [76] A. Martin, W. Stirling and R. Thorne, Phys. Lett. B 636 (2006) 259 [hep-ph/0603143].
- [77] A. Buras and K. Gaemers, Nucl. Phys. B 132 (1978) 249.
- [78] A. Martin, R. Roberts, W. J. Stirling and R. Thorne, Eur. Phys. J. C 23 (2002) 73 [hep-ph/0110215].
- [79] J. Pumplin et al., JHEP 0207 (2002) 012 [hep-ph/0201195].
- [80] J. Owens, Phys. Rev. D 30 (1984) 943.
- [81] M. Glück, E. Reya and A. Vogt, Z. Phys. C 53 (1992) 651.
- [82] C. Pascaud and F. Zomer, LAL-95-05.
- [83] P. Newman, Proc. of International Europhysics Conference on High Energy Physics, Budapest, Hungary, July 2001, ed Horváth, Lévai, Patkós, JHEP PRHEP-hep2001/048, [hep-ex/0112034].
-
[84]
A. Donnachie and P. Landshoff,
Phys. Lett. B 296 (1992) 227
[hep-ph/9209205];
J. Cudell, K. Kang and S. Kim, Phys. Lett. B 395 (1997) 311 [hep-ph/9601336]. - [85] A. Mueller, Phys. Rev. D 2 (1970) 2963.
-
[86]
P. Johnson and W. K. Tung,
Phys. Rev. D 16 (1977) 2769;
K. Prytz, Phys. Lett. B 311 (1993) 286. - [87] C. Adloff et al. [H1 Collaboration], Phys. Lett. B 520 (2001) 183 [hep-ex/0108035].
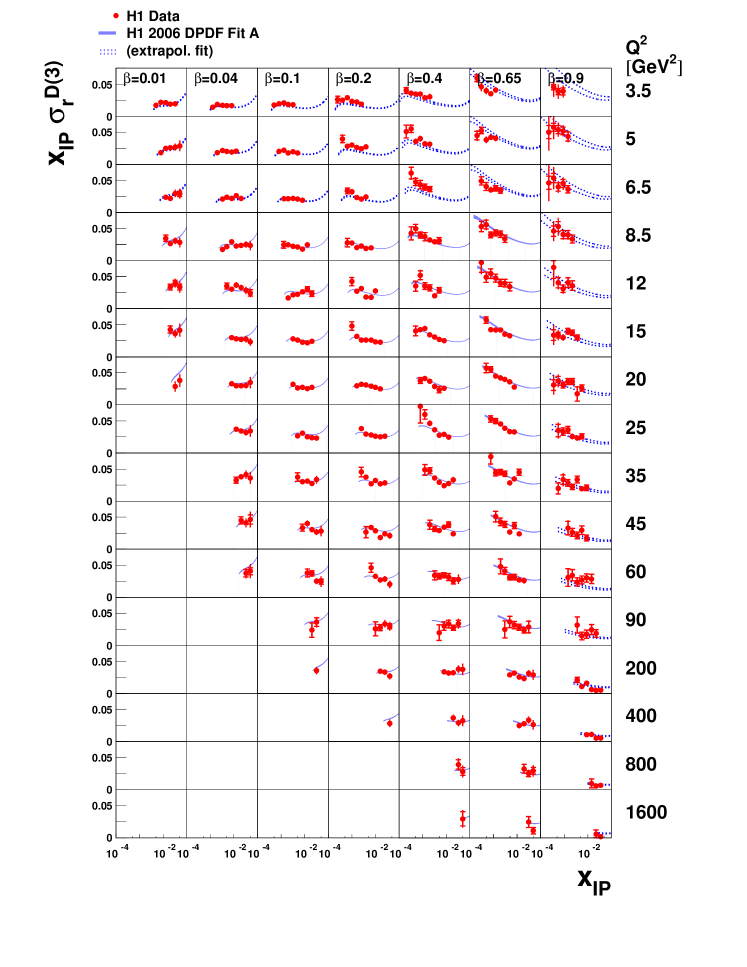
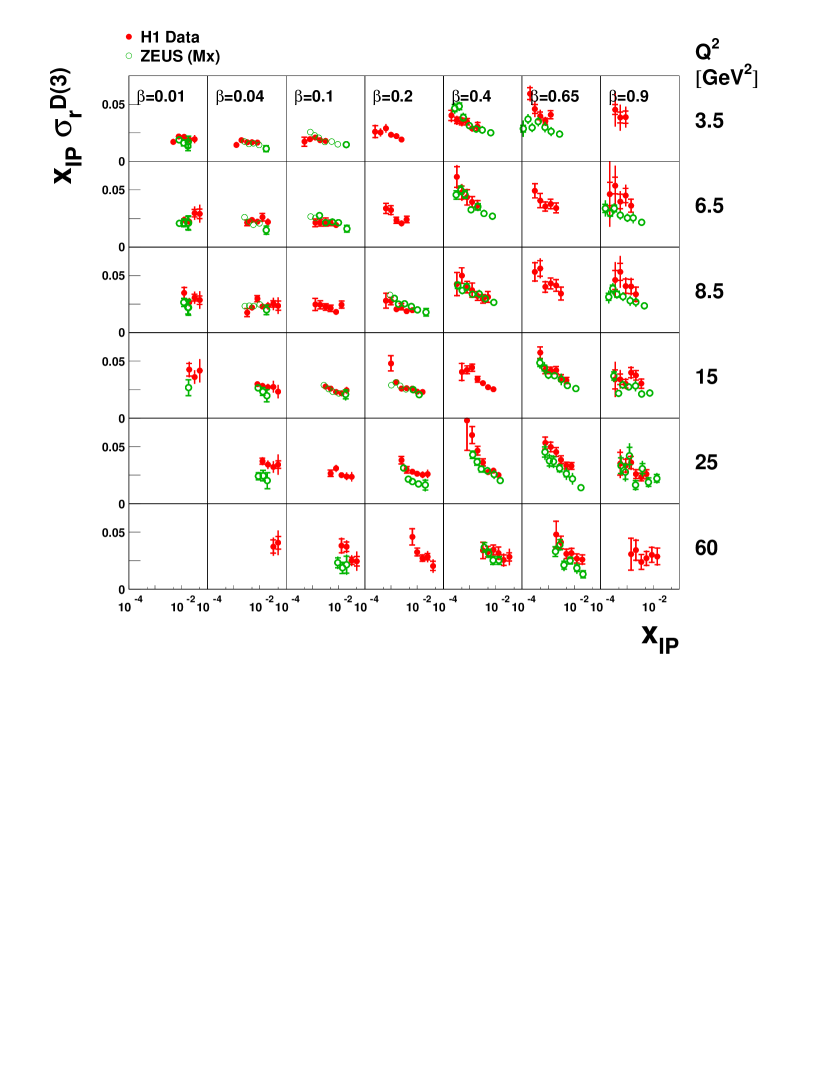
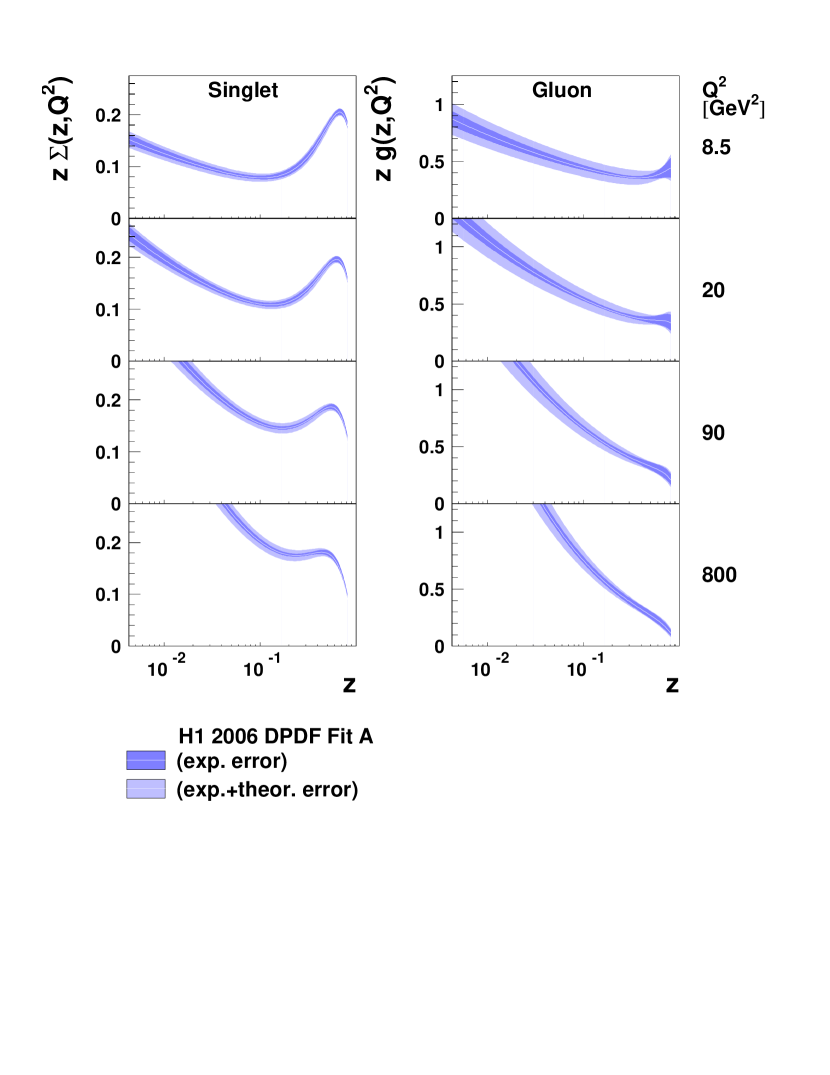
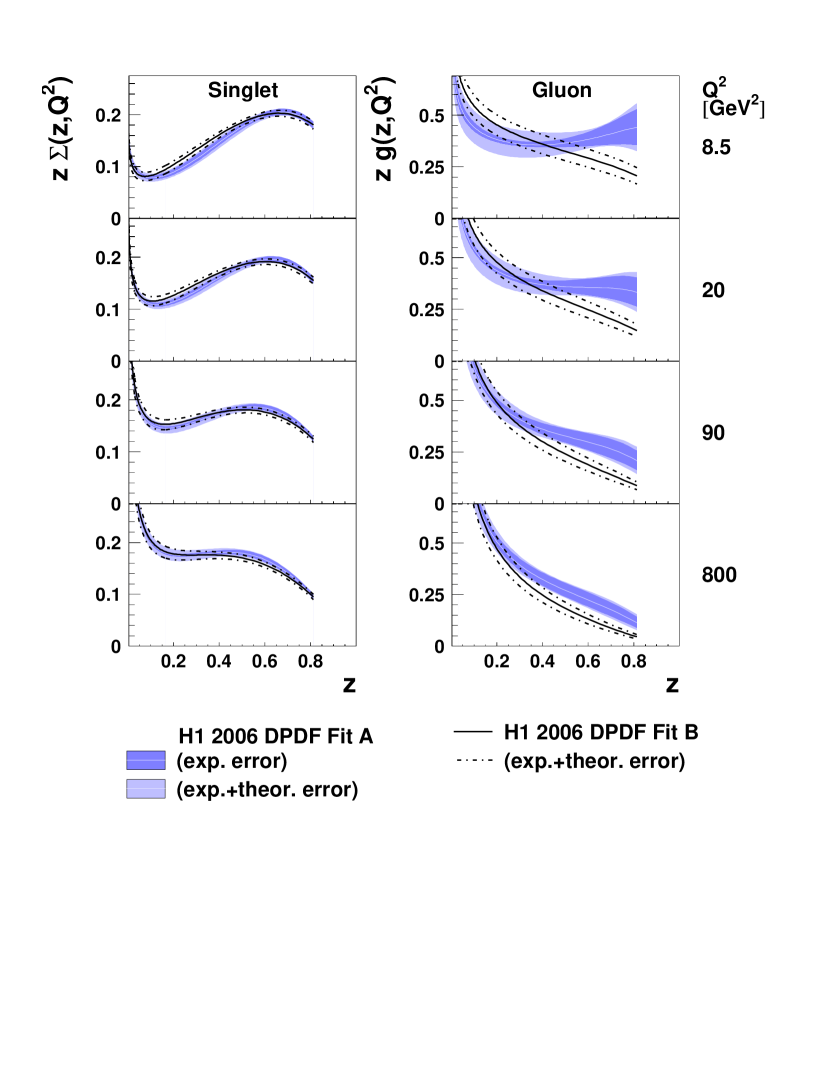
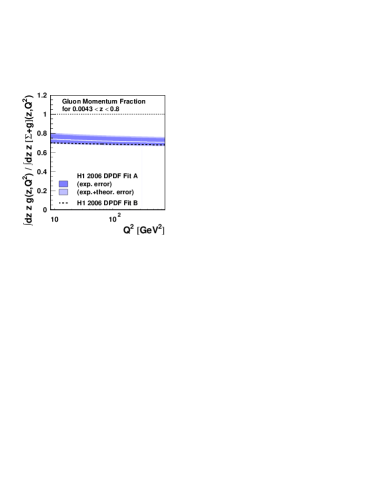
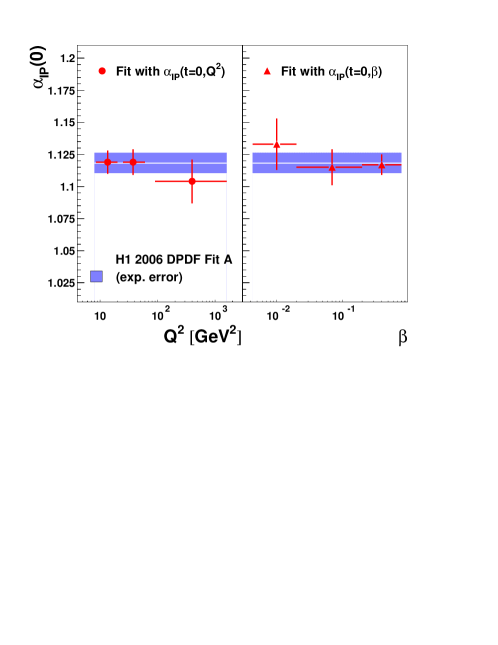
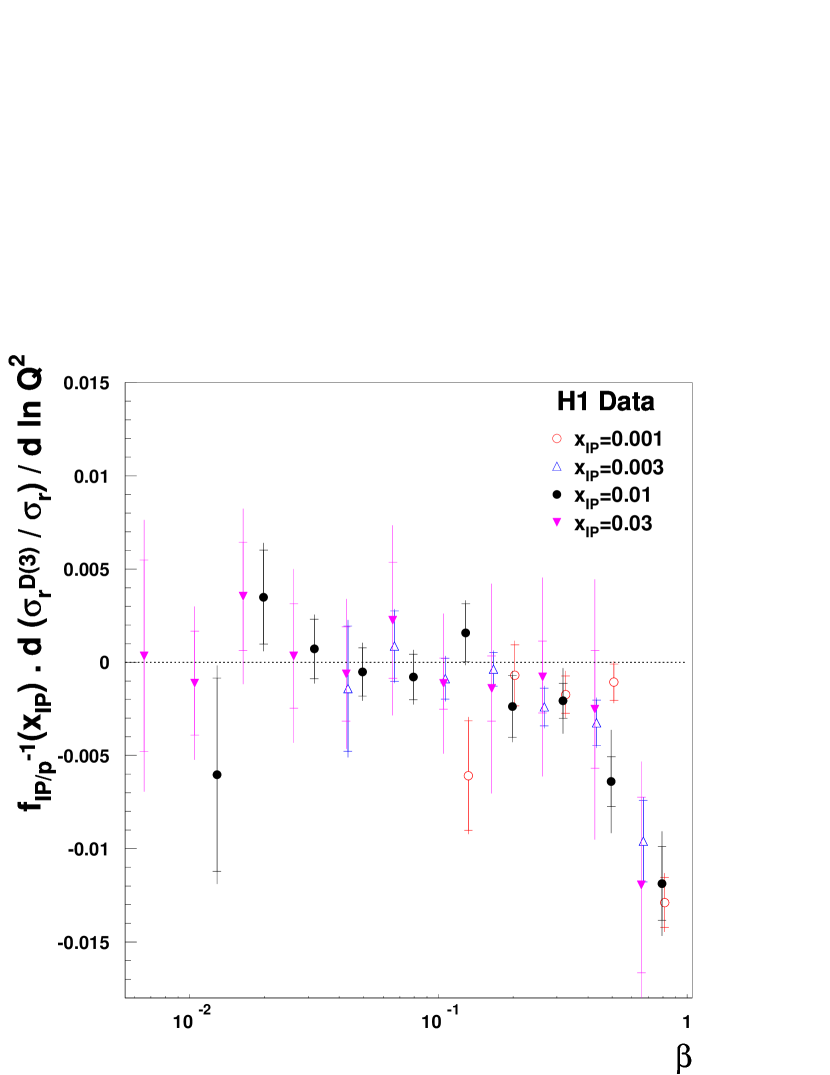
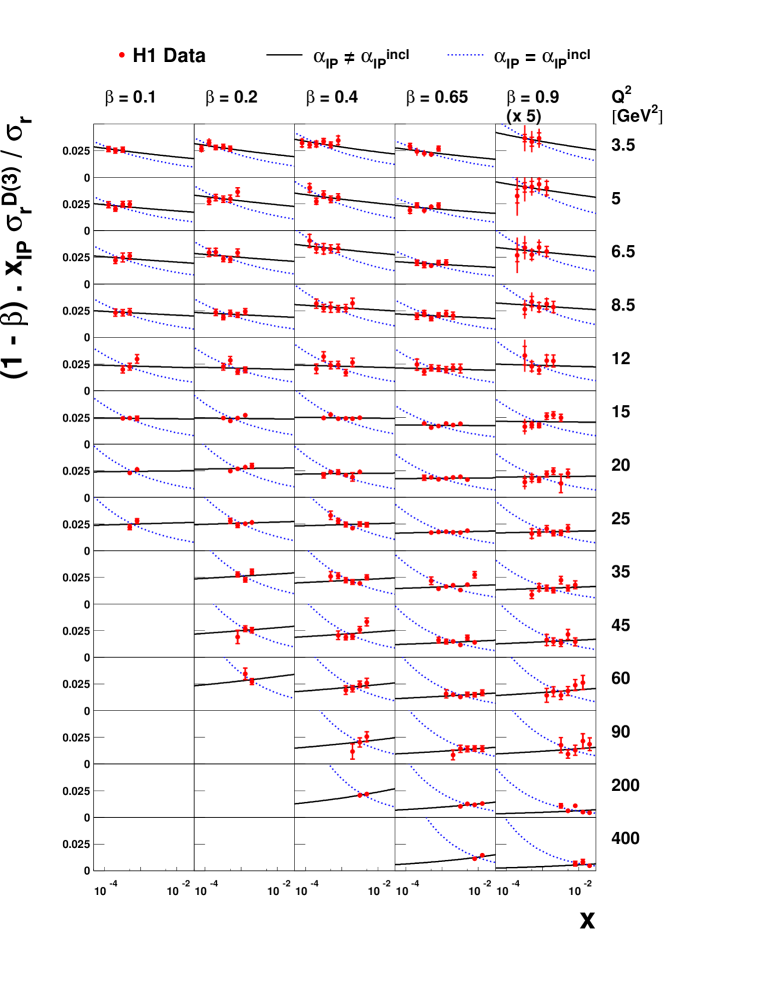
| [%] | [%] | [%] | [%] | [%] | [%] | [%] | [%] | [%] | [%] | [%] | [%] | [%] | [%] | ||||
|---|---|---|---|---|---|---|---|---|---|---|---|---|---|---|---|---|---|
| 0.0003 | 3.5 | 0.17 | 0.0224 | 17.2 | 10.8 | 20.3 | 1.6 | 0.2 | 5.3 | -1.7 | -4.7 | -0.6 | -0.8 | 0.0 | -0.0 | 3.0 | 1.7 |
| 0.0003 | 3.5 | 0.27 | 0.0262 | 7.6 | 6.4 | 9.9 | 1.6 | 0.2 | 1.3 | 2.7 | -4.6 | -0.4 | -0.5 | -0.1 | -0.1 | 1.0 | 1.8 |
| 0.0003 | 3.5 | 0.43 | 0.0351 | 5.5 | 6.2 | 8.3 | 1.6 | 0.2 | 0.2 | 1.6 | 4.6 | -1.6 | -0.2 | 0.0 | -0.1 | 1.2 | 0.7 |
| 0.0003 | 3.5 | 0.67 | 0.0443 | 5.5 | 11.7 | 13.0 | 1.6 | 0.3 | -1.0 | 1.9 | 11.2 | -0.3 | 0.7 | -0.1 | 0.1 | 0.9 | 0.8 |
| 0.0003 | 5.0 | 0.27 | 0.0392 | 11.9 | 7.7 | 14.2 | 1.6 | 0.4 | 3.8 | 1.4 | 4.7 | -0.3 | -0.8 | 0.0 | 0.1 | 1.0 | 2.4 |
| 0.0003 | 5.0 | 0.43 | 0.0422 | 7.7 | 7.0 | 10.4 | 1.6 | 0.4 | -0.8 | 1.5 | 4.9 | -1.7 | -0.1 | 0.0 | -0.2 | 1.1 | 3.0 |
| 0.0003 | 5.0 | 0.67 | 0.0528 | 7.9 | 9.8 | 12.6 | 1.6 | -0.2 | -0.6 | 2.6 | 9.0 | -0.2 | 0.7 | 0.0 | -0.0 | 1.0 | 1.4 |
| 0.0003 | 6.5 | 0.43 | 0.0452 | 11.0 | 7.8 | 13.5 | 1.6 | -0.8 | -2.7 | 1.9 | 5.3 | -1.2 | 0.1 | 0.0 | -0.4 | 0.9 | 3.4 |
| 0.0003 | 6.5 | 0.67 | 0.0580 | 9.5 | 8.9 | 13.0 | 1.6 | 0.1 | 1.2 | 0.9 | 7.6 | -0.8 | 0.9 | 0.0 | 0.3 | 0.7 | 2.6 |
| 0.0003 | 8.5 | 0.43 | 0.0353 | 18.2 | 11.0 | 21.3 | 1.6 | -0.5 | 6.5 | 1.3 | 5.5 | -0.7 | 0.0 | 0.0 | -0.5 | 0.3 | 5.8 |
| 0.0003 | 8.5 | 0.67 | 0.0570 | 11.7 | 9.5 | 15.0 | 1.6 | 0.2 | -0.5 | 0.6 | 6.9 | -1.6 | 0.8 | 0.0 | -0.2 | 0.4 | 4.6 |
| 0.0003 | 12.0 | 0.67 | 0.0670 | 18.1 | 10.0 | 20.7 | 1.6 | 0.2 | 0.3 | -1.4 | 8.5 | -0.8 | 1.2 | 0.0 | 0.0 | 0.6 | 3.6 |
| 0.001 | 3.5 | 0.05 | 0.0167 | 15.5 | 6.5 | 16.8 | 1.7 | -0.7 | 1.0 | -1.6 | -2.6 | -1.0 | -2.2 | 0.0 | 0.4 | -0.1 | 0.5 |
| 0.001 | 3.5 | 0.08 | 0.0189 | 8.2 | 6.9 | 10.7 | 1.7 | 0.5 | 2.5 | 1.8 | -5.3 | -0.9 | -1.3 | 0.0 | -0.3 | 0.8 | -0.8 |
| 0.001 | 3.5 | 0.13 | 0.0239 | 6.6 | 6.9 | 9.5 | 1.7 | 0.7 | 0.3 | 2.0 | -5.8 | -1.1 | -1.2 | 0.0 | 0.4 | 0.6 | -0.8 |
| 0.001 | 3.5 | 0.2 | 0.0239 | 6.2 | 6.9 | 9.3 | 1.7 | 0.5 | 0.7 | 0.7 | -6.2 | -1.2 | -1.1 | 0.0 | 0.2 | 0.5 | -0.9 |
| 0.001 | 3.5 | 0.32 | 0.0243 | 5.6 | 6.8 | 8.8 | 1.7 | -0.1 | -2.1 | 1.7 | -5.7 | -0.9 | -0.9 | 0.0 | -0.2 | 0.2 | 0.3 |
| 0.001 | 3.5 | 0.5 | 0.0281 | 5.5 | 4.5 | 7.1 | 1.7 | 0.2 | -1.2 | 2.1 | 2.1 | -0.2 | -0.7 | 0.0 | -0.2 | 0.1 | 0.6 |
| 0.001 | 3.5 | 0.8 | 0.0456 | 7.4 | 4.9 | 8.9 | 1.7 | 0.3 | -1.4 | 1.3 | 3.0 | 1.5 | 0.8 | -0.2 | 0.1 | -0.8 | 0.7 |
| 0.001 | 5.0 | 0.08 | 0.0213 | 13.2 | 6.3 | 14.6 | 1.7 | 0.3 | 4.0 | -1.4 | -2.1 | -1.1 | -1.8 | 0.0 | 0.2 | 0.8 | 1.8 |
| 0.001 | 5.0 | 0.13 | 0.0238 | 8.6 | 7.0 | 11.0 | 1.7 | 1.0 | 1.1 | 1.4 | -5.9 | -0.7 | -1.3 | 0.0 | 0.5 | 0.8 | 1.5 |
| 0.001 | 5.0 | 0.2 | 0.0277 | 7.4 | 6.9 | 10.1 | 1.7 | -0.3 | -1.3 | 2.7 | -5.4 | -1.0 | -1.1 | 0.0 | -0.2 | 0.8 | -1.0 |
| 0.001 | 5.0 | 0.32 | 0.0317 | 6.5 | 6.5 | 9.2 | 1.7 | 0.4 | -1.2 | 1.7 | -5.5 | -0.8 | -0.9 | 0.0 | 0.1 | 0.6 | 0.7 |
| 0.001 | 5.0 | 0.5 | 0.0350 | 6.0 | 3.9 | 7.2 | 1.7 | 0.6 | -1.1 | 1.5 | 1.6 | -0.4 | -0.5 | 0.0 | 0.0 | 0.7 | 0.5 |
| 0.001 | 5.0 | 0.8 | 0.0467 | 7.5 | 6.1 | 9.6 | 1.7 | 0.2 | -2.3 | 2.8 | 3.7 | 1.2 | 1.0 | 0.0 | 0.3 | 0.5 | 0.7 |
| 0.001 | 6.5 | 0.13 | 0.0264 | 11.7 | 6.5 | 13.4 | 1.7 | -0.7 | 1.8 | 0.5 | -5.0 | -0.7 | -1.1 | 0.0 | -0.1 | 0.7 | 2.0 |
| [%] | [%] | [%] | [%] | [%] | [%] | [%] | [%] | [%] | [%] | [%] | [%] | [%] | [%] | ||||
|---|---|---|---|---|---|---|---|---|---|---|---|---|---|---|---|---|---|
| 0.001 | 6.5 | 0.2 | 0.0294 | 9.2 | 7.2 | 11.7 | 1.7 | 0.2 | -1.7 | 1.5 | -6.1 | -1.1 | -1.3 | 0.0 | 0.1 | 0.4 | 1.1 |
| 0.001 | 6.5 | 0.32 | 0.0295 | 10.6 | 6.3 | 12.4 | 1.7 | 0.3 | 0.8 | 1.6 | -5.4 | -0.9 | -1.0 | 0.0 | 0.3 | 0.3 | 0.9 |
| 0.001 | 6.5 | 0.5 | 0.0321 | 7.5 | 4.6 | 8.8 | 1.7 | 0.5 | -1.1 | 1.2 | 2.9 | -0.7 | -0.5 | 0.0 | 0.2 | 0.3 | 0.7 |
| 0.001 | 6.5 | 0.8 | 0.0461 | 8.7 | 5.3 | 10.2 | 1.7 | 0.8 | -1.7 | 1.4 | 3.8 | 0.6 | 0.9 | 0.0 | -0.2 | 0.3 | 0.9 |
| 0.001 | 8.5 | 0.13 | 0.0232 | 18.6 | 8.6 | 20.5 | 1.7 | 0.9 | -3.0 | 2.6 | -6.5 | -0.8 | -1.6 | 0.0 | -0.2 | 0.6 | 2.4 |
| 0.001 | 8.5 | 0.2 | 0.0298 | 9.6 | 5.2 | 10.9 | 1.7 | -0.6 | 1.2 | 1.0 | -4.0 | -0.6 | -1.2 | 0.0 | -0.2 | 0.2 | -1.3 |
| 0.001 | 8.5 | 0.32 | 0.0341 | 8.4 | 5.6 | 10.1 | 1.7 | 0.5 | -1.7 | 2.4 | -4.0 | -0.7 | -0.9 | 0.0 | 0.3 | 0.2 | -0.6 |
| 0.001 | 8.5 | 0.5 | 0.0372 | 8.8 | 5.1 | 10.2 | 1.7 | 0.3 | -2.8 | 1.9 | -2.4 | -0.5 | -0.5 | 0.0 | 0.1 | 0.2 | 0.8 |
| 0.001 | 8.5 | 0.8 | 0.0457 | 9.1 | 4.8 | 10.2 | 1.7 | -0.3 | -1.3 | 2.6 | 2.4 | 0.9 | 1.0 | 0.0 | -0.0 | 0.1 | 0.6 |
| 0.001 | 12.0 | 0.2 | 0.0349 | 13.0 | 6.0 | 14.3 | 1.7 | 1.4 | -1.7 | 1.1 | -2.9 | -0.5 | -1.3 | 0.0 | 0.6 | 0.7 | 3.8 |
| 0.001 | 12.0 | 0.32 | 0.0385 | 9.6 | 5.6 | 11.1 | 1.7 | 0.6 | -1.7 | 1.2 | -3.8 | -0.8 | -1.0 | 0.0 | -0.2 | 0.6 | -0.3 |
| 0.001 | 12.0 | 0.5 | 0.0426 | 9.0 | 5.4 | 10.5 | 1.7 | 0.5 | -1.0 | 2.9 | 3.3 | -0.3 | -0.4 | 0.0 | 0.2 | 0.5 | 1.2 |
| 0.001 | 12.0 | 0.8 | 0.0445 | 11.0 | 5.6 | 12.4 | 1.7 | 0.3 | -2.0 | -0.7 | 3.7 | 1.1 | 0.9 | 0.0 | 0.2 | 0.4 | 1.2 |
| 0.001 | 15.0 | 0.2 | 0.0395 | 11.6 | 6.3 | 13.2 | 1.7 | 0.3 | 4.0 | -0.9 | -3.3 | -0.3 | -1.9 | 0.0 | 0.2 | 0.1 | 1.9 |
| 0.001 | 15.0 | 0.32 | 0.0384 | 5.3 | 4.5 | 7.0 | 1.7 | 0.4 | 0.7 | 0.8 | -3.4 | -0.6 | -1.0 | 0.0 | -0.1 | 0.1 | 1.3 |
| 0.001 | 15.0 | 0.5 | 0.0410 | 4.9 | 5.3 | 7.2 | 1.7 | 0.5 | -3.1 | 1.7 | 2.9 | -0.3 | -0.5 | 0.0 | 0.0 | 0.0 | 0.5 |
| 0.001 | 15.0 | 0.8 | 0.0409 | 6.4 | 4.7 | 7.9 | 1.7 | 0.1 | -2.1 | 1.3 | 2.6 | 0.8 | 1.0 | 0.0 | -0.1 | -0.2 | 0.7 |
| 0.001 | 20.0 | 0.32 | 0.0379 | 8.0 | 4.9 | 9.4 | 1.7 | 0.4 | 1.1 | 0.5 | -2.8 | -0.4 | -1.1 | -0.4 | -0.1 | 0.4 | 2.7 |
| 0.001 | 20.0 | 0.5 | 0.0488 | 5.5 | 4.4 | 7.0 | 1.7 | 0.5 | -2.3 | 0.4 | 2.3 | -0.3 | -0.3 | 0.0 | 0.1 | 0.3 | 1.0 |
| 0.001 | 20.0 | 0.8 | 0.0431 | 6.9 | 5.8 | 9.0 | 1.7 | 0.3 | -2.9 | 1.5 | 3.3 | 0.9 | 1.0 | 0.0 | 0.1 | 0.2 | 1.1 |
| 0.001 | 25.0 | 0.32 | 0.0505 | 23.9 | 6.9 | 24.8 | 1.7 | 0.5 | 4.6 | 1.9 | -1.5 | -0.6 | -1.4 | 0.0 | -0.6 | 0.1 | 3.3 |
| 0.001 | 25.0 | 0.5 | 0.0562 | 8.4 | 4.6 | 9.6 | 1.7 | 0.5 | -1.8 | 1.0 | 0.9 | 0.1 | -0.4 | 0.0 | 0.2 | 0.1 | 2.8 |
| 0.001 | 25.0 | 0.8 | 0.0460 | 7.8 | 5.9 | 9.8 | 1.7 | 0.8 | -2.3 | 1.1 | 3.5 | 0.3 | 1.1 | -0.3 | -0.2 | -0.2 | 1.2 |
| 0.001 | 35.0 | 0.5 | 0.0534 | 12.4 | 7.1 | 14.3 | 1.7 | 0.6 | 2.2 | 1.0 | 2.4 | -0.5 | -0.5 | 0.0 | 0.7 | 0.5 | 5.3 |
| 0.001 | 35.0 | 0.8 | 0.0416 | 10.4 | 7.0 | 12.6 | 1.7 | 0.3 | -4.0 | 1.0 | 2.9 | 0.8 | 1.0 | 0.0 | 0.0 | 0.2 | 2.1 |
| 0.001 | 45.0 | 0.8 | 0.0297 | 22.1 | 8.8 | 23.8 | 1.7 | 0.5 | 2.1 | 1.8 | 3.9 | 1.3 | 0.8 | 0.0 | 0.0 | 0.3 | 4.5 |
| 0.003 | 3.5 | 0.017 | 0.0134 | 17.2 | 6.8 | 18.5 | 2.1 | 0.5 | 2.9 | 0.7 | 0.4 | -0.4 | -1.3 | 0.0 | -0.3 | 0.5 | 0.8 |
| 0.003 | 3.5 | 0.027 | 0.0194 | 8.4 | 4.6 | 9.5 | 2.1 | 0.7 | 1.4 | 1.5 | -2.2 | -0.6 | -1.2 | -0.2 | -0.1 | 0.8 | 0.6 |
| 0.003 | 3.5 | 0.043 | 0.0172 | 8.1 | 4.0 | 9.0 | 2.1 | 0.1 | 0.6 | 2.8 | -0.9 | -0.2 | -0.5 | -0.2 | 0.1 | 0.6 | 0.9 |
| 0.003 | 3.5 | 0.067 | 0.0172 | 7.4 | 3.7 | 8.3 | 2.1 | 0.3 | 0.7 | 1.2 | -1.1 | -0.9 | -1.0 | -0.2 | -0.3 | 0.5 | -1.0 |
| 0.003 | 3.5 | 0.11 | 0.0181 | 6.9 | 3.6 | 7.8 | 2.1 | 1.0 | -0.2 | 1.1 | -1.7 | -0.8 | -0.9 | -0.2 | 0.2 | 0.2 | -0.3 |
| 0.003 | 3.5 | 0.17 | 0.0166 | 7.1 | 4.3 | 8.3 | 2.1 | 0.7 | -0.8 | 1.2 | -2.2 | -1.0 | -1.0 | -0.3 | 0.2 | 0.3 | 0.5 |
| 0.003 | 3.5 | 0.27 | 0.0218 | 8.0 | 6.1 | 10.1 | 2.1 | 0.7 | -1.0 | 0.8 | -1.5 | -1.1 | -1.2 | -0.3 | 0.1 | -3.3 | -0.8 |
| 0.003 | 5.0 | 0.027 | 0.0173 | 13.9 | 7.5 | 15.8 | 2.1 | -0.3 | 5.3 | 1.2 | -2.7 | -0.5 | -1.3 | -0.3 | 0.2 | 0.5 | -1.4 |
| 0.003 | 5.0 | 0.043 | 0.0207 | 9.6 | 4.9 | 10.7 | 2.1 | 1.3 | 2.8 | 0.8 | -1.8 | -0.6 | -1.1 | -0.3 | 0.4 | 0.9 | 1.1 |
| 0.003 | 5.0 | 0.067 | 0.0175 | 8.4 | 4.2 | 9.4 | 2.1 | 0.7 | 0.9 | 1.7 | -1.9 | -0.6 | -1.1 | -0.4 | -0.2 | 0.7 | 0.9 |
| [%] | [%] | [%] | [%] | [%] | [%] | [%] | [%] | [%] | [%] | [%] | [%] | [%] | [%] | ||||
|---|---|---|---|---|---|---|---|---|---|---|---|---|---|---|---|---|---|
| 0.003 | 5.0 | 0.11 | 0.0193 | 8.4 | 5.2 | 9.9 | 2.1 | -0.3 | -1.5 | 2.0 | -3.2 | -0.9 | -0.9 | -0.1 | -0.6 | 0.6 | -0.3 |
| 0.003 | 5.0 | 0.17 | 0.0209 | 9.0 | 4.7 | 10.2 | 2.1 | -0.4 | -0.7 | 2.0 | -2.8 | -1.0 | -1.0 | -0.7 | -0.4 | 0.7 | -0.3 |
| 0.003 | 5.0 | 0.27 | 0.0268 | 7.3 | 4.2 | 8.4 | 2.1 | 1.1 | -0.9 | 1.3 | -1.4 | -1.0 | -0.9 | -0.2 | 0.2 | 0.2 | 0.1 |
| 0.003 | 5.0 | 0.43 | 0.0290 | 9.9 | 7.3 | 12.3 | 2.1 | 0.3 | 0.4 | 0.8 | -1.1 | -0.9 | -0.7 | 0.0 | 0.1 | -4.8 | -0.2 |
| 0.003 | 6.5 | 0.043 | 0.0226 | 12.1 | 4.9 | 13.0 | 2.1 | 0.4 | 2.6 | 1.2 | -2.3 | -0.5 | -0.9 | -0.2 | 0.3 | 0.3 | -0.9 |
| 0.003 | 6.5 | 0.067 | 0.0215 | 10.9 | 5.1 | 12.1 | 2.1 | 0.4 | -2.6 | 2.9 | -1.0 | -0.7 | -1.2 | -0.2 | -0.3 | 0.3 | -1.0 |
| 0.003 | 6.5 | 0.11 | 0.0191 | 12.2 | 4.6 | 13.1 | 2.1 | 0.6 | 2.6 | 2.2 | -0.9 | -0.6 | -0.7 | 0.0 | 0.3 | 0.5 | -1.2 |
| 0.003 | 6.5 | 0.17 | 0.0215 | 9.4 | 3.9 | 10.2 | 2.1 | 0.4 | -1.3 | 2.3 | -0.9 | -0.5 | -0.8 | -0.2 | 0.2 | 0.3 | 0.5 |
| 0.003 | 6.5 | 0.27 | 0.0247 | 8.7 | 5.0 | 10.1 | 2.1 | 0.6 | -1.2 | 3.1 | -2.5 | -0.3 | -0.7 | -0.1 | -0.1 | 0.4 | 0.8 |
| 0.003 | 6.5 | 0.43 | 0.0238 | 8.2 | 4.3 | 9.2 | 2.1 | 1.3 | -1.3 | 2.4 | -1.0 | 0.4 | -0.3 | 0.0 | 0.3 | 0.2 | 0.2 |
| 0.003 | 8.5 | 0.043 | 0.0201 | 19.2 | 8.2 | 20.9 | 2.1 | 1.9 | 5.3 | 2.1 | 2.8 | -0.1 | -1.2 | -0.9 | 0.6 | 0.4 | 1.7 |
| 0.003 | 8.5 | 0.067 | 0.0226 | 11.8 | 4.7 | 12.7 | 2.1 | -0.6 | 1.8 | -1.6 | -2.4 | -0.6 | -1.2 | -0.5 | -0.2 | 0.2 | 1.0 |
| 0.003 | 8.5 | 0.11 | 0.0201 | 10.2 | 5.0 | 11.3 | 2.1 | -1.8 | -1.9 | 1.3 | -2.3 | -0.7 | -1.1 | -0.2 | -0.0 | 0.2 | -1.9 |
| 0.003 | 8.5 | 0.17 | 0.0218 | 10.1 | 3.9 | 10.8 | 2.1 | 0.3 | -0.5 | 1.3 | -1.5 | -0.6 | -0.9 | -0.4 | -0.4 | 0.2 | 0.5 |
| 0.003 | 8.5 | 0.27 | 0.0236 | 8.2 | 3.8 | 9.1 | 2.1 | -0.2 | -0.6 | 1.7 | -1.8 | -0.6 | -0.9 | -0.2 | 0.4 | 0.1 | -0.3 |
| 0.003 | 8.5 | 0.43 | 0.0305 | 8.0 | 3.6 | 8.8 | 2.1 | 0.9 | -0.9 | 0.7 | -1.4 | -0.1 | -0.6 | -0.2 | -0.1 | 0.1 | -0.3 |
| 0.003 | 8.5 | 0.67 | 0.0397 | 10.9 | 5.7 | 12.4 | 2.1 | 0.5 | -2.4 | 1.9 | 3.1 | 1.5 | 0.5 | -0.4 | 0.4 | 0.0 | 0.9 |
| 0.003 | 12.0 | 0.067 | 0.0247 | 15.0 | 4.9 | 15.8 | 2.1 | 0.2 | -0.8 | 1.4 | -2.6 | -0.5 | -1.3 | -0.5 | -0.5 | 0.5 | 1.4 |
| 0.003 | 12.0 | 0.11 | 0.0242 | 12.1 | 4.2 | 12.8 | 2.1 | 1.5 | 1.7 | 0.5 | 0.2 | -0.4 | -1.1 | -0.4 | 0.4 | 0.6 | 0.4 |
| 0.003 | 12.0 | 0.17 | 0.0266 | 10.4 | 4.3 | 11.3 | 2.1 | -0.3 | -2.4 | 1.7 | -1.6 | -0.4 | -0.9 | -0.2 | 0.5 | 0.4 | 0.5 |
| 0.003 | 12.0 | 0.27 | 0.0226 | 10.5 | 3.1 | 11.0 | 2.1 | 0.3 | -1.0 | -0.4 | -1.3 | -0.6 | -0.8 | 0.0 | -0.2 | 0.4 | 0.5 |
| 0.003 | 12.0 | 0.43 | 0.0260 | 9.9 | 5.2 | 11.2 | 2.1 | 1.5 | -2.3 | 3.1 | -1.3 | -0.3 | -0.5 | 0.0 | 0.2 | 0.5 | 0.7 |
| 0.003 | 12.0 | 0.67 | 0.0392 | 10.8 | 4.6 | 11.7 | 2.1 | 0.9 | 0.7 | 1.4 | 1.2 | 1.5 | 0.4 | 0.0 | -0.4 | 0.5 | 1.1 |
| 0.003 | 15.0 | 0.067 | 0.0338 | 14.4 | 5.0 | 15.3 | 2.1 | 1.5 | 1.7 | 1.4 | 1.1 | -0.4 | -1.7 | 0.0 | 0.7 | -0.1 | 2.2 |
| 0.003 | 15.0 | 0.11 | 0.0282 | 6.3 | 3.6 | 7.3 | 2.1 | 0.7 | 1.3 | 1.0 | -1.0 | -0.4 | -1.0 | -0.5 | -0.0 | 0.2 | 0.5 |
| 0.003 | 15.0 | 0.17 | 0.0245 | 5.5 | 3.5 | 6.5 | 2.1 | 0.4 | -2.1 | 0.6 | -0.6 | -0.6 | -1.0 | 0.0 | 0.2 | 0.2 | 0.2 |
| 0.003 | 15.0 | 0.27 | 0.0273 | 4.9 | 3.5 | 6.0 | 2.1 | 0.3 | -1.0 | 1.1 | -1.6 | -0.5 | -0.8 | -0.2 | 0.2 | -0.0 | 0.2 |
| 0.003 | 15.0 | 0.43 | 0.0331 | 4.9 | 3.6 | 6.1 | 2.1 | 0.5 | -1.2 | 1.9 | 0.7 | -0.4 | -0.5 | -0.2 | -0.1 | 0.1 | 0.4 |
| 0.003 | 15.0 | 0.67 | 0.0381 | 5.8 | 4.0 | 7.1 | 2.1 | 0.5 | -1.5 | 1.6 | 1.7 | 1.0 | 0.5 | -0.1 | 0.7 | 0.1 | 0.6 |
| 0.003 | 20.0 | 0.11 | 0.0276 | 9.0 | 4.1 | 9.9 | 2.1 | 0.2 | 2.5 | 0.4 | -1.5 | -0.4 | -1.2 | -0.4 | 0.2 | 0.4 | 1.3 |
| 0.003 | 20.0 | 0.17 | 0.0281 | 6.3 | 3.5 | 7.2 | 2.1 | 0.5 | -1.5 | 1.0 | -0.7 | -0.2 | -1.1 | -0.9 | 0.2 | 0.4 | -0.3 |
| 0.003 | 20.0 | 0.27 | 0.0321 | 5.9 | 3.6 | 6.9 | 2.1 | -0.1 | -1.4 | 0.8 | -1.8 | -0.4 | -0.9 | -0.1 | -0.1 | 0.3 | -0.3 |
| 0.003 | 20.0 | 0.43 | 0.0324 | 5.2 | 3.5 | 6.3 | 2.1 | 0.4 | -1.7 | 1.2 | -0.6 | -0.2 | -0.4 | -0.2 | -0.1 | 0.3 | 0.4 |
| 0.003 | 20.0 | 0.67 | 0.0411 | 6.3 | 3.6 | 7.3 | 2.1 | 0.7 | -1.6 | 1.1 | 1.4 | 0.8 | 0.5 | -0.1 | 0.1 | 0.3 | 0.3 |
| 0.003 | 25.0 | 0.11 | 0.0343 | 20.2 | 6.3 | 21.2 | 2.1 | -1.3 | -4.2 | 1.4 | -2.1 | -0.3 | -1.6 | 0.0 | -0.0 | 0.1 | 2.0 |
| 0.003 | 25.0 | 0.17 | 0.0335 | 7.2 | 3.1 | 7.8 | 2.1 | -0.0 | 0.8 | 0.4 | 0.9 | -0.5 | -1.0 | 0.0 | 0.5 | 0.1 | 1.1 |
| [%] | [%] | [%] | [%] | [%] | [%] | [%] | [%] | [%] | [%] | [%] | [%] | [%] | [%] | ||||
|---|---|---|---|---|---|---|---|---|---|---|---|---|---|---|---|---|---|
| 0.003 | 25.0 | 0.27 | 0.0338 | 6.8 | 3.7 | 7.7 | 2.1 | 0.3 | -1.9 | 1.1 | -1.3 | -0.3 | -0.9 | -0.2 | -0.3 | -0.0 | -0.4 |
| 0.003 | 25.0 | 0.43 | 0.0354 | 5.8 | 3.7 | 6.8 | 2.1 | 0.8 | -2.0 | 0.8 | 1.1 | -0.3 | -0.4 | -0.2 | 0.4 | -0.0 | 0.3 |
| 0.003 | 25.0 | 0.67 | 0.0349 | 6.7 | 3.9 | 7.7 | 2.1 | 0.6 | -1.8 | 1.2 | 1.4 | 0.9 | 0.5 | 0.0 | -0.2 | 0.0 | 0.4 |
| 0.003 | 35.0 | 0.17 | 0.0423 | 13.2 | 4.8 | 14.1 | 2.1 | 0.6 | 1.1 | 0.8 | -0.9 | -0.5 | -1.5 | -0.7 | 0.2 | 0.7 | 3.1 |
| 0.003 | 35.0 | 0.27 | 0.0387 | 6.9 | 3.0 | 7.5 | 2.1 | 0.6 | -1.1 | 0.2 | -0.2 | -0.4 | -1.0 | -0.4 | -0.3 | 0.4 | 0.7 |
| 0.003 | 35.0 | 0.43 | 0.0353 | 6.7 | 3.8 | 7.6 | 2.1 | 0.6 | -2.3 | 1.0 | -0.6 | -0.2 | -0.5 | -0.4 | 0.3 | 0.3 | 0.1 |
| 0.003 | 35.0 | 0.67 | 0.0371 | 7.7 | 3.7 | 8.5 | 2.1 | 0.5 | -1.9 | 0.9 | 0.9 | 0.9 | 0.5 | -0.2 | 0.3 | 0.3 | 0.8 |
| 0.003 | 45.0 | 0.27 | 0.0326 | 19.7 | 3.9 | 20.1 | 2.1 | -0.3 | -0.8 | 0.8 | -1.3 | -0.4 | -1.2 | 0.0 | -0.0 | 0.3 | 1.8 |
| 0.003 | 45.0 | 0.43 | 0.0365 | 9.1 | 3.9 | 9.9 | 2.1 | 0.7 | -1.6 | 1.3 | 0.4 | 0.2 | -0.4 | -0.6 | 0.1 | 0.2 | 0.9 |
| 0.003 | 45.0 | 0.67 | 0.0383 | 9.5 | 4.7 | 10.6 | 2.1 | 0.6 | -3.4 | 0.9 | 1.2 | 0.7 | 0.5 | -0.3 | 0.2 | 0.0 | 0.7 |
| 0.003 | 60.0 | 0.43 | 0.0406 | 14.5 | 5.6 | 15.5 | 2.1 | 1.2 | -3.8 | 1.0 | 1.3 | 0.1 | -0.7 | 0.0 | -0.6 | 0.5 | 1.6 |
| 0.003 | 60.0 | 0.67 | 0.0429 | 10.6 | 4.0 | 11.3 | 2.1 | 0.4 | -2.2 | 0.6 | 1.4 | 0.6 | 0.5 | 0.0 | 0.1 | 0.1 | 0.8 |
| 0.003 | 90.0 | 0.67 | 0.0366 | 40.9 | 10.0 | 42.1 | 2.1 | 1.0 | 3.8 | 4.8 | 4.2 | -0.9 | 0.7 | 0.0 | 0.0 | -0.4 | 1.3 |
| 0.01 | 3.5 | 0.005 | 0.0237 | 15.3 | 8.8 | 17.6 | 3.6 | 1.1 | 1.7 | 3.4 | -0.6 | -0.9 | -2.4 | -1.2 | 0.2 | 0.6 | -3.2 |
| 0.01 | 3.5 | 0.008 | 0.0233 | 8.7 | 6.4 | 10.8 | 3.6 | 0.9 | 1.8 | 0.8 | 0.5 | -0.1 | -2.0 | -2.7 | 0.5 | 0.6 | 1.8 |
| 0.01 | 3.5 | 0.013 | 0.0213 | 8.7 | 6.5 | 10.8 | 3.6 | 0.7 | 3.3 | 0.9 | 0.2 | -0.5 | -1.6 | -2.3 | 0.5 | 0.7 | -2.1 |
| 0.01 | 3.5 | 0.02 | 0.0173 | 7.2 | 5.3 | 9.0 | 3.6 | 1.2 | 1.8 | 0.7 | 1.2 | -0.2 | -1.2 | -1.7 | -0.6 | 0.3 | 1.4 |
| 0.01 | 3.5 | 0.032 | 0.0172 | 8.4 | 6.0 | 10.3 | 3.6 | 2.5 | 0.7 | 2.4 | 1.0 | -0.6 | -0.9 | -1.3 | 0.2 | 0.1 | -0.5 |
| 0.01 | 3.5 | 0.05 | 0.0153 | 8.7 | 6.2 | 10.7 | 3.6 | 0.8 | -2.2 | 1.3 | 0.4 | 0.1 | -0.8 | -2.9 | 0.9 | -0.2 | 0.1 |
| 0.01 | 3.5 | 0.08 | 0.0167 | 9.9 | 7.2 | 12.3 | 3.6 | 2.4 | 0.5 | 2.6 | 1.6 | 0.2 | -1.3 | -2.4 | 0.3 | -0.6 | -1.1 |
| 0.01 | 5.0 | 0.008 | 0.0183 | 13.1 | 8.5 | 15.6 | 3.6 | 2.4 | 3.8 | 2.3 | -2.3 | -0.1 | -1.7 | -1.6 | 0.9 | 2.0 | 0.3 |
| 0.01 | 5.0 | 0.013 | 0.0234 | 9.4 | 5.5 | 10.9 | 3.6 | -1.0 | 2.6 | 1.4 | 0.6 | -0.1 | -1.1 | -1.6 | 0.4 | 1.3 | -0.3 |
| 0.01 | 5.0 | 0.02 | 0.0226 | 8.6 | 5.5 | 10.2 | 3.6 | 1.7 | -1.3 | 1.9 | -0.4 | -0.1 | -1.2 | -2.1 | 0.4 | 0.3 | 0.7 |
| 0.01 | 5.0 | 0.032 | 0.0208 | 9.9 | 5.6 | 11.4 | 3.6 | 1.4 | 1.2 | 1.2 | 1.9 | -0.1 | -0.8 | -1.9 | 1.3 | 0.5 | -1.6 |
| 0.01 | 5.0 | 0.05 | 0.0235 | 9.5 | 6.3 | 11.4 | 3.6 | -0.8 | -2.7 | 2.2 | -0.7 | -0.3 | -0.9 | -2.4 | 0.4 | 0.2 | 0.5 |
| 0.01 | 5.0 | 0.08 | 0.0245 | 12.5 | 7.8 | 14.7 | 3.6 | 0.8 | -1.7 | 2.1 | -1.2 | -1.3 | -1.1 | -2.2 | 0.9 | -1.1 | -0.5 |
| 0.01 | 6.5 | 0.013 | 0.0209 | 11.7 | 5.5 | 12.9 | 3.6 | 1.7 | 2.1 | -0.6 | 0.5 | -0.3 | -1.5 | -1.8 | 0.5 | 0.3 | 0.3 |
| 0.01 | 6.5 | 0.02 | 0.0232 | 9.5 | 5.1 | 10.8 | 3.6 | 0.9 | -1.0 | 0.8 | 1.2 | -0.1 | -1.1 | -1.5 | 0.5 | 0.3 | -0.2 |
| 0.01 | 6.5 | 0.032 | 0.0253 | 9.1 | 5.8 | 10.8 | 3.6 | 1.1 | -2.2 | 1.3 | -2.2 | -0.2 | -1.0 | -1.5 | 0.8 | 0.3 | -1.1 |
| 0.01 | 6.5 | 0.05 | 0.0272 | 12.5 | 6.7 | 14.2 | 3.6 | 0.3 | 0.5 | 0.5 | -1.0 | -1.0 | -1.5 | -1.7 | 0.9 | -1.2 | 0.6 |
| 0.01 | 6.5 | 0.08 | 0.0225 | 8.6 | 6.1 | 10.6 | 3.6 | -1.7 | -1.0 | 2.5 | 1.1 | 0.2 | -0.8 | -2.7 | -0.1 | 0.3 | -0.2 |
| 0.01 | 6.5 | 0.13 | 0.0203 | 11.2 | 6.1 | 12.8 | 3.6 | 1.1 | 1.6 | -2.0 | 1.0 | 0.3 | -1.0 | -1.8 | 0.6 | 0.1 | 1.2 |
| 0.01 | 8.5 | 0.013 | 0.0293 | 16.6 | 7.8 | 18.3 | 3.6 | 1.0 | 4.4 | -2.7 | -1.1 | -0.4 | -1.6 | -1.0 | 1.8 | 0.4 | -1.1 |
| 0.01 | 8.5 | 0.02 | 0.0244 | 10.2 | 5.9 | 11.8 | 3.6 | -0.9 | 0.4 | 2.8 | -1.3 | -0.4 | -1.6 | -1.7 | 0.5 | 0.1 | 0.9 |
| 0.01 | 8.5 | 0.032 | 0.0300 | 8.7 | 5.3 | 10.2 | 3.6 | 0.7 | 1.3 | 1.3 | 1.7 | 0.2 | -1.1 | -2.3 | 0.8 | 0.0 | 0.5 |
| 0.01 | 8.5 | 0.05 | 0.0227 | 9.0 | 5.3 | 10.5 | 3.6 | 0.8 | -1.4 | 2.4 | 1.4 | -0.2 | -0.7 | -0.9 | 0.6 | 0.2 | 0.8 |
| [%] | [%] | [%] | [%] | [%] | [%] | [%] | [%] | [%] | [%] | [%] | [%] | [%] | [%] | ||||
|---|---|---|---|---|---|---|---|---|---|---|---|---|---|---|---|---|---|
| 0.01 | 8.5 | 0.08 | 0.0182 | 9.4 | 5.2 | 10.8 | 3.6 | 0.9 | 1.6 | 0.9 | -1.5 | -0.2 | -1.0 | -2.0 | 0.7 | -0.1 | 0.3 |
| 0.01 | 8.5 | 0.13 | 0.0200 | 9.1 | 6.7 | 11.3 | 3.6 | -0.2 | -1.9 | 1.6 | -1.0 | 0.6 | -0.9 | -2.9 | 0.8 | 0.3 | -0.5 |
| 0.01 | 8.5 | 0.2 | 0.0220 | 10.2 | 6.4 | 12.0 | 3.6 | 1.5 | -1.3 | -1.2 | -2.1 | -0.2 | -1.0 | -0.7 | 0.3 | -0.4 | -0.6 |
| 0.01 | 12.0 | 0.02 | 0.0370 | 12.7 | 5.4 | 13.8 | 3.6 | 0.5 | 1.8 | -1.1 | -0.9 | -0.2 | -1.6 | -1.8 | 0.1 | 0.4 | 0.4 |
| 0.01 | 12.0 | 0.032 | 0.0340 | 10.3 | 5.1 | 11.4 | 3.6 | 1.0 | -1.4 | -0.5 | 1.2 | -0.3 | -1.4 | -1.3 | 0.3 | 0.5 | -0.8 |
| 0.01 | 12.0 | 0.05 | 0.0345 | 9.6 | 5.2 | 10.9 | 3.6 | 0.6 | -1.2 | 1.6 | -1.0 | 0.1 | -1.1 | -2.3 | 0.6 | 0.5 | 0.4 |
| 0.01 | 12.0 | 0.08 | 0.0259 | 10.1 | 5.6 | 11.6 | 3.6 | 0.7 | 1.4 | 1.0 | -1.9 | -0.2 | -1.1 | -1.8 | 0.4 | 0.5 | -1.7 |
| 0.01 | 12.0 | 0.13 | 0.0217 | 10.2 | 5.2 | 11.4 | 3.6 | 0.9 | -1.9 | 0.4 | 1.7 | -0.1 | -0.9 | -1.6 | 0.2 | 0.6 | 0.2 |
| 0.01 | 12.0 | 0.2 | 0.0258 | 11.9 | 5.2 | 13.0 | 3.6 | -1.2 | -0.6 | 2.5 | -0.8 | 0.4 | -1.1 | 0.0 | -0.5 | 0.8 | 0.7 |
| 0.01 | 12.0 | 0.32 | 0.0240 | 14.0 | 5.3 | 14.9 | 3.6 | -0.5 | -1.3 | 1.5 | -1.1 | 0.8 | -0.0 | -0.4 | -0.4 | 0.4 | -2.3 |
| 0.01 | 15.0 | 0.02 | 0.0329 | 14.2 | 6.2 | 15.4 | 3.6 | 1.3 | -2.0 | 0.4 | -1.9 | -0.4 | -2.0 | -0.7 | -1.8 | -0.2 | 1.5 |
| 0.01 | 15.0 | 0.032 | 0.0306 | 6.0 | 5.3 | 8.0 | 3.6 | 0.3 | 1.7 | 1.0 | -0.5 | -0.1 | -1.3 | -1.8 | 0.2 | 0.2 | 1.0 |
| 0.01 | 15.0 | 0.05 | 0.0291 | 5.3 | 4.8 | 7.1 | 3.6 | -0.5 | -1.3 | 0.7 | -0.9 | -0.2 | -1.4 | -1.7 | 0.5 | 0.1 | -0.7 |
| 0.01 | 15.0 | 0.08 | 0.0232 | 6.8 | 4.9 | 8.4 | 3.6 | 0.1 | 0.6 | 0.7 | -0.6 | 0.1 | -1.2 | -2.6 | 0.7 | 0.1 | 0.3 |
| 0.01 | 15.0 | 0.13 | 0.0230 | 5.1 | 5.0 | 7.2 | 3.6 | 0.5 | -0.4 | 0.9 | -1.1 | -0.1 | -1.1 | -2.7 | 0.3 | 0.1 | 0.3 |
| 0.01 | 15.0 | 0.2 | 0.0224 | 5.0 | 4.9 | 7.0 | 3.6 | 0.7 | 0.7 | 0.6 | -1.0 | 0.5 | -1.2 | -2.5 | 0.4 | 0.2 | 0.3 |
| 0.01 | 15.0 | 0.32 | 0.0229 | 5.2 | 4.5 | 6.9 | 3.6 | 0.6 | -1.4 | -0.6 | -0.2 | 0.4 | -0.8 | -1.0 | 0.2 | 0.1 | 0.2 |
| 0.01 | 20.0 | 0.032 | 0.0337 | 8.8 | 5.7 | 10.5 | 3.6 | 1.2 | -2.1 | 1.3 | -0.9 | -0.1 | -1.5 | -2.1 | 0.9 | 0.4 | 1.3 |
| 0.01 | 20.0 | 0.05 | 0.0287 | 6.8 | 5.3 | 8.6 | 3.6 | 0.7 | -1.1 | 1.1 | -0.8 | 0.2 | -1.4 | -2.8 | 0.5 | 0.6 | -0.3 |
| 0.01 | 20.0 | 0.08 | 0.0274 | 5.8 | 4.7 | 7.4 | 3.6 | 0.3 | -1.2 | 1.1 | 0.2 | -0.1 | -1.1 | -1.5 | -0.6 | 0.4 | -0.3 |
| 0.01 | 20.0 | 0.13 | 0.0270 | 5.6 | 4.9 | 7.4 | 3.6 | 0.8 | -0.6 | 0.7 | -0.7 | -0.1 | -1.0 | -2.5 | 0.6 | 0.4 | -0.2 |
| 0.01 | 20.0 | 0.2 | 0.0241 | 9.3 | 5.0 | 10.5 | 3.6 | -0.4 | -1.2 | 1.5 | -0.6 | -0.1 | -1.1 | -2.0 | 0.3 | 0.4 | -0.7 |
| 0.01 | 20.0 | 0.32 | 0.0259 | 5.4 | 4.9 | 7.3 | 3.6 | 0.7 | 1.0 | 0.8 | 1.2 | 0.5 | -1.0 | -2.1 | 0.3 | 0.4 | 0.4 |
| 0.01 | 20.0 | 0.5 | 0.0294 | 6.9 | 5.4 | 8.8 | 3.6 | 0.3 | -2.2 | 1.0 | -0.9 | 0.8 | -0.2 | -2.1 | -0.5 | 0.3 | 0.8 |
| 0.01 | 25.0 | 0.032 | 0.0289 | 20.1 | 6.0 | 20.9 | 3.6 | -1.1 | -1.8 | -0.7 | 1.1 | -0.2 | -2.0 | -1.8 | 0.5 | 0.2 | -1.5 |
| 0.01 | 25.0 | 0.05 | 0.0335 | 7.5 | 5.2 | 9.1 | 3.6 | 1.1 | 1.4 | 0.6 | -0.7 | 0.1 | -1.4 | -2.6 | 0.4 | 0.3 | 0.6 |
| 0.01 | 25.0 | 0.08 | 0.0315 | 5.9 | 5.2 | 7.9 | 3.6 | 0.5 | -1.2 | 0.4 | -0.2 | -0.1 | -1.2 | -2.1 | 0.3 | 0.2 | 0.3 |
| 0.01 | 25.0 | 0.13 | 0.0270 | 6.0 | 4.4 | 7.4 | 3.6 | 0.4 | -0.8 | 0.7 | 0.7 | -0.2 | -1.0 | -1.5 | 0.5 | 0.1 | -0.5 |
| 0.01 | 25.0 | 0.2 | 0.0253 | 5.7 | 5.0 | 7.6 | 3.6 | 0.5 | 1.1 | 1.3 | -0.3 | -0.1 | -1.2 | -2.3 | 0.4 | 0.2 | 0.9 |
| 0.01 | 25.0 | 0.32 | 0.0242 | 5.8 | 5.0 | 7.7 | 3.6 | 1.2 | -0.9 | 1.2 | 0.4 | 0.4 | -1.0 | -2.1 | 0.7 | 0.2 | -0.1 |
| 0.01 | 25.0 | 0.5 | 0.0289 | 6.2 | 5.2 | 8.1 | 3.6 | 1.1 | -2.0 | 1.1 | 1.5 | 0.9 | -0.2 | -1.6 | 0.4 | 0.2 | 1.0 |
| 0.01 | 35.0 | 0.05 | 0.0299 | 14.1 | 6.1 | 15.4 | 3.6 | 0.9 | 1.3 | 1.6 | -0.5 | 0.1 | -1.7 | -2.7 | 0.3 | 0.8 | 1.5 |
| 0.01 | 35.0 | 0.08 | 0.0324 | 7.1 | 5.1 | 8.7 | 3.6 | 0.5 | -3.0 | 0.3 | 0.4 | -0.2 | -1.0 | -0.9 | 0.6 | 0.5 | 0.2 |
| 0.01 | 35.0 | 0.13 | 0.0294 | 7.0 | 4.7 | 8.4 | 3.6 | 0.4 | -1.1 | 0.4 | 0.4 | -0.1 | -1.1 | -2.3 | -0.3 | 0.4 | 0.3 |
| 0.01 | 35.0 | 0.2 | 0.0302 | 6.7 | 4.8 | 8.2 | 3.6 | 0.1 | -0.9 | 1.2 | 0.4 | -0.1 | -1.0 | -1.8 | 0.2 | 0.4 | -0.6 |
| 0.01 | 35.0 | 0.32 | 0.0232 | 6.7 | 6.6 | 9.4 | 3.6 | 0.5 | -0.5 | 0.8 | 1.2 | 0.8 | -1.1 | -4.9 | 0.6 | 0.7 | 0.7 |
| [%] | [%] | [%] | [%] | [%] | [%] | [%] | [%] | [%] | [%] | [%] | [%] | [%] | [%] | ||||
|---|---|---|---|---|---|---|---|---|---|---|---|---|---|---|---|---|---|
| 0.01 | 35.0 | 0.5 | 0.0305 | 6.6 | 4.8 | 8.2 | 3.6 | 0.6 | -1.5 | 0.9 | 0.8 | 0.8 | -0.3 | -1.2 | -0.2 | 0.6 | 0.3 |
| 0.01 | 35.0 | 0.8 | 0.0362 | 9.2 | 7.0 | 11.6 | 3.6 | 1.0 | -1.1 | 1.7 | 2.4 | 2.4 | 1.2 | -1.9 | -1.3 | 0.6 | 1.6 |
| 0.01 | 45.0 | 0.08 | 0.0329 | 13.5 | 5.3 | 14.5 | 3.6 | 1.6 | 0.8 | 1.3 | -0.7 | -0.1 | -1.4 | -1.3 | -0.6 | 0.4 | 1.9 |
| 0.01 | 45.0 | 0.13 | 0.0377 | 7.7 | 6.0 | 9.7 | 3.6 | -0.8 | -2.5 | 0.9 | -1.3 | 0.1 | -1.0 | -2.4 | -0.4 | 0.3 | -1.5 |
| 0.01 | 45.0 | 0.2 | 0.0264 | 8.2 | 4.7 | 9.5 | 3.6 | 0.9 | -1.5 | 0.6 | -0.5 | -0.2 | -1.0 | -1.3 | -0.9 | 0.2 | -0.7 |
| 0.01 | 45.0 | 0.32 | 0.0237 | 10.6 | 6.1 | 12.2 | 3.6 | 1.5 | -1.6 | 0.9 | 0.4 | 0.6 | -1.0 | -3.6 | 0.1 | 0.5 | -0.4 |
| 0.01 | 45.0 | 0.5 | 0.0373 | 8.3 | 4.9 | 9.7 | 3.6 | -0.7 | -1.1 | -0.3 | 0.9 | 0.6 | -0.4 | -1.5 | -0.2 | 0.3 | -0.8 |
| 0.01 | 45.0 | 0.8 | 0.0245 | 11.2 | 5.9 | 12.7 | 3.6 | 1.2 | -1.4 | 1.1 | 2.3 | 1.8 | 1.0 | -0.9 | 0.4 | 0.3 | 0.4 |
| 0.01 | 60.0 | 0.13 | 0.0379 | 13.3 | 6.5 | 14.8 | 3.6 | 1.5 | -2.6 | 0.9 | 2.9 | -0.1 | -1.2 | -1.5 | 0.9 | 0.5 | 0.8 |
| 0.01 | 60.0 | 0.2 | 0.0318 | 8.9 | 5.4 | 10.4 | 3.6 | 1.1 | -1.3 | 1.2 | -0.5 | 0.1 | -1.2 | -2.7 | -0.2 | 0.3 | 0.7 |
| 0.01 | 60.0 | 0.32 | 0.0319 | 8.0 | 4.9 | 9.4 | 3.6 | 0.8 | -2.1 | 0.5 | 0.6 | 0.1 | -0.8 | -1.6 | 0.5 | 0.2 | 0.1 |
| 0.01 | 60.0 | 0.5 | 0.0335 | 10.8 | 6.9 | 12.8 | 3.6 | 0.8 | -1.5 | 0.9 | 0.5 | 1.6 | -0.2 | -5.0 | 0.2 | 0.7 | 0.8 |
| 0.01 | 60.0 | 0.8 | 0.0277 | 12.3 | 7.0 | 14.2 | 3.6 | 0.9 | -3.5 | 0.5 | 1.5 | 1.7 | 1.0 | -2.9 | 0.3 | 0.3 | 1.5 |
| 0.01 | 90.0 | 0.2 | 0.0259 | 35.3 | 8.9 | 36.4 | 3.6 | 0.6 | -5.4 | 3.8 | 1.2 | -0.6 | -1.6 | 0.0 | -1.2 | 0.8 | -2.3 |
| 0.01 | 90.0 | 0.32 | 0.0292 | 14.4 | 5.5 | 15.5 | 3.6 | 1.1 | 2.3 | 1.7 | 1.5 | -0.0 | -0.7 | -0.6 | -0.5 | 0.6 | 0.8 |
| 0.01 | 90.0 | 0.5 | 0.0326 | 12.9 | 7.3 | 14.8 | 3.6 | 1.2 | -2.7 | 1.7 | 1.8 | 0.6 | -0.2 | -2.0 | 0.8 | 0.6 | 1.6 |
| 0.01 | 90.0 | 0.8 | 0.0240 | 16.5 | 6.2 | 17.6 | 3.6 | 0.9 | -0.3 | 0.3 | 1.7 | 2.1 | 0.8 | -2.4 | -0.9 | 0.9 | 1.5 |
| 0.03 | 3.5 | 0.0017 | 0.0188 | 25.3 | 17.0 | 30.5 | 11.2 | -6.2 | 4.6 | -2.1 | -2.9 | 0.8 | -2.3 | -4.2 | -2.4 | 0.7 | 0.9 |
| 0.03 | 3.5 | 0.0027 | 0.0263 | 12.7 | 16.3 | 20.7 | 11.2 | -2.1 | -1.3 | 4.4 | -2.9 | 0.7 | -2.8 | -7.1 | 4.8 | -0.7 | 1.3 |
| 0.03 | 3.5 | 0.0043 | 0.0254 | 10.8 | 17.3 | 20.3 | 11.2 | -1.3 | 7.5 | 2.5 | -3.4 | 0.9 | -2.2 | -7.0 | 2.7 | -0.4 | 1.2 |
| 0.03 | 3.5 | 0.0067 | 0.0214 | 11.6 | 14.5 | 18.6 | 11.2 | -2.8 | -2.2 | -1.1 | -3.3 | 1.2 | -2.2 | -6.3 | 2.2 | 0.8 | 1.1 |
| 0.03 | 3.5 | 0.011 | 0.0190 | 12.5 | 14.6 | 19.2 | 11.2 | -2.3 | -1.9 | 3.0 | -2.8 | 1.1 | -1.1 | -6.0 | -2.9 | -1.2 | -1.2 |
| 0.03 | 5.0 | 0.0027 | 0.0366 | 16.2 | 26.1 | 30.7 | 11.2 | -4.6 | -17.1 | -2.4 | -3.4 | 1.2 | -3.2 | -8.2 | 4.3 | -0.2 | -8.6 |
| 0.03 | 5.0 | 0.0043 | 0.0325 | 12.9 | 15.9 | 20.5 | 11.2 | -0.7 | 8.5 | -2.4 | -2.6 | 0.6 | -1.2 | -3.9 | 1.7 | 0.4 | -1.2 |
| 0.03 | 5.0 | 0.0067 | 0.0302 | 11.0 | 15.2 | 18.7 | 11.2 | 1.9 | -2.7 | 0.5 | -2.4 | 1.2 | -2.7 | -7.7 | 3.2 | 0.5 | 0.4 |
| 0.03 | 5.0 | 0.011 | 0.0233 | 13.3 | 14.4 | 19.6 | 11.2 | -1.8 | 4.3 | -0.5 | -1.5 | 1.0 | -1.3 | -6.0 | 2.5 | -1.0 | -2.7 |
| 0.03 | 5.0 | 0.017 | 0.0225 | 11.0 | 15.6 | 19.1 | 11.2 | 0.2 | -4.6 | 1.8 | -2.3 | 2.1 | -1.1 | -6.6 | 3.8 | 0.7 | 2.6 |
| 0.03 | 6.5 | 0.0027 | 0.0366 | 33.5 | 17.5 | 37.8 | 11.2 | 0.9 | -8.9 | -1.4 | 2.7 | -0.1 | -3.4 | -3.4 | 0.1 | -0.4 | -3.5 |
| 0.03 | 6.5 | 0.0043 | 0.0211 | 14.6 | 16.0 | 21.7 | 11.2 | 3.1 | 2.1 | 3.6 | 2.5 | 1.5 | -1.6 | -6.2 | 5.5 | 0.1 | 3.3 |
| 0.03 | 6.5 | 0.0067 | 0.0261 | 12.0 | 15.3 | 19.4 | 11.2 | -1.7 | -2.0 | 1.5 | -3.4 | 1.3 | -2.6 | -7.5 | 1.6 | 0.3 | -1.9 |
| 0.03 | 6.5 | 0.011 | 0.0263 | 12.0 | 14.4 | 18.7 | 11.2 | -2.3 | 0.4 | 2.4 | -2.1 | 1.0 | -0.7 | -3.9 | 5.2 | 0.2 | 2.1 |
| 0.03 | 6.5 | 0.017 | 0.0266 | 11.6 | 13.8 | 18.0 | 11.2 | -0.8 | 0.7 | -2.0 | -1.3 | 1.3 | -0.8 | -5.7 | -1.6 | -0.1 | 0.2 |
| 0.03 | 6.5 | 0.027 | 0.0262 | 10.3 | 15.0 | 18.2 | 11.2 | -1.6 | 0.5 | 1.2 | -2.1 | 1.5 | -1.7 | -7.4 | 2.6 | 0.5 | -0.3 |
| 0.03 | 6.5 | 0.043 | 0.0225 | 12.1 | 14.7 | 19.1 | 11.2 | 1.3 | 2.3 | 3.8 | 2.6 | 1.4 | -0.8 | -6.9 | 0.5 | 0.0 | 1.0 |
| 0.03 | 8.5 | 0.0043 | 0.0331 | 18.8 | 16.9 | 25.2 | 11.2 | -5.5 | -2.0 | 2.4 | -3.4 | 0.7 | -1.8 | -4.2 | 1.8 | 0.4 | -6.0 |
| 0.03 | 8.5 | 0.0067 | 0.0250 | 13.1 | 14.7 | 19.7 | 11.2 | 0.8 | 2.8 | -0.1 | -2.6 | 1.4 | -0.9 | -4.8 | 1.8 | 0.4 | 2.8 |
| [%] | [%] | [%] | [%] | [%] | [%] | [%] | [%] | [%] | [%] | [%] | [%] | [%] | [%] | ||||
|---|---|---|---|---|---|---|---|---|---|---|---|---|---|---|---|---|---|
| 0.03 | 8.5 | 0.011 | 0.0313 | 10.4 | 13.8 | 17.3 | 11.2 | -2.1 | 1.2 | -1.5 | -3.0 | 0.8 | -1.3 | -4.1 | 3.0 | 0.2 | -1.0 |
| 0.03 | 8.5 | 0.017 | 0.0270 | 10.4 | 14.3 | 17.7 | 11.2 | -1.2 | -1.5 | 4.0 | -2.0 | 1.5 | -1.1 | -6.3 | 2.1 | 0.1 | -1.0 |
| 0.03 | 8.5 | 0.027 | 0.0276 | 9.4 | 14.6 | 17.3 | 11.2 | -1.4 | 1.3 | -0.1 | -2.9 | 1.5 | -1.5 | -7.5 | 1.8 | 0.2 | -0.8 |
| 0.03 | 8.5 | 0.043 | 0.0277 | 10.5 | 15.6 | 18.8 | 11.2 | 0.7 | -3.8 | 3.8 | 0.6 | 0.8 | -0.4 | -4.1 | 3.9 | 0.1 | 1.8 |
| 0.03 | 12.0 | 0.0067 | 0.0325 | 17.1 | 16.0 | 23.5 | 11.2 | 2.5 | 1.8 | 0.5 | -5.4 | 0.9 | -1.7 | -5.2 | -0.9 | 0.7 | 0.4 |
| 0.03 | 12.0 | 0.011 | 0.0368 | 12.0 | 12.8 | 17.5 | 11.2 | -0.7 | -1.9 | 2.3 | -2.3 | 0.7 | -1.6 | -3.9 | 1.6 | 0.6 | 1.3 |
| 0.03 | 12.0 | 0.017 | 0.0336 | 11.0 | 14.5 | 18.2 | 11.2 | -2.1 | 0.9 | 2.0 | -3.0 | 1.4 | -1.7 | -6.6 | 3.2 | 0.6 | -0.9 |
| 0.03 | 12.0 | 0.027 | 0.0375 | 11.1 | 14.3 | 18.1 | 11.2 | -1.5 | -3.5 | 2.5 | -1.9 | 1.3 | -1.7 | -6.5 | 2.5 | 0.5 | -0.4 |
| 0.03 | 12.0 | 0.043 | 0.0303 | 11.9 | 14.1 | 18.5 | 11.2 | -1.3 | -0.9 | 1.4 | -2.3 | 1.5 | -0.7 | -5.3 | 2.4 | 0.8 | 1.0 |
| 0.03 | 12.0 | 0.067 | 0.0251 | 12.7 | 13.2 | 18.3 | 11.2 | -1.4 | -1.3 | 1.9 | -2.0 | 1.6 | -0.7 | -4.9 | 1.6 | 0.5 | 0.3 |
| 0.03 | 15.0 | 0.0067 | 0.0462 | 15.6 | 14.6 | 21.4 | 11.2 | -2.1 | 6.5 | 0.9 | -3.6 | 0.6 | -2.3 | -3.6 | 1.3 | -0.2 | -1.7 |
| 0.03 | 15.0 | 0.011 | 0.0354 | 6.6 | 14.7 | 16.1 | 11.2 | -0.9 | -1.7 | -1.3 | -1.7 | 1.4 | -2.0 | -7.5 | 2.1 | 0.4 | -0.8 |
| 0.03 | 15.0 | 0.017 | 0.0360 | 5.4 | 14.1 | 15.1 | 11.2 | 0.4 | 1.2 | 1.5 | -1.6 | 1.4 | -1.9 | -7.2 | 3.0 | 0.3 | 0.6 |
| 0.03 | 15.0 | 0.027 | 0.0317 | 5.4 | 14.2 | 15.2 | 11.2 | -1.2 | -1.4 | 1.5 | -1.2 | 1.2 | -1.6 | -6.7 | 1.8 | 0.3 | 0.3 |
| 0.03 | 15.0 | 0.043 | 0.0271 | 6.7 | 15.1 | 16.5 | 11.2 | -0.7 | 2.3 | 1.2 | -2.2 | 1.5 | -1.6 | -8.7 | 2.6 | 0.1 | 0.5 |
| 0.03 | 15.0 | 0.067 | 0.0244 | 6.4 | 13.9 | 15.3 | 11.2 | -0.7 | 1.1 | 0.4 | -1.2 | 1.6 | -1.2 | -7.2 | 1.6 | 0.4 | -1.0 |
| 0.03 | 15.0 | 0.11 | 0.0239 | 6.1 | 14.9 | 16.1 | 11.2 | -1.1 | -0.7 | 0.7 | -2.8 | 1.6 | -1.3 | -7.8 | 1.8 | 0.2 | -0.2 |
| 0.03 | 20.0 | 0.011 | 0.0307 | 9.7 | 15.1 | 17.9 | 11.2 | -0.3 | -0.6 | 0.9 | -2.0 | 1.3 | -2.4 | -7.7 | 2.7 | 0.6 | 1.1 |
| 0.03 | 20.0 | 0.017 | 0.0391 | 7.3 | 14.4 | 16.1 | 11.2 | 0.4 | -1.1 | -1.2 | -2.5 | 1.1 | -2.0 | -6.7 | 2.6 | 0.6 | 1.3 |
| 0.03 | 20.0 | 0.027 | 0.0321 | 5.9 | 13.4 | 14.6 | 11.2 | -0.6 | -0.8 | 1.3 | -2.3 | 1.1 | -1.6 | -6.2 | 1.0 | 0.6 | 0.7 |
| 0.03 | 20.0 | 0.043 | 0.0292 | 6.2 | 13.5 | 14.9 | 11.2 | 0.7 | -2.2 | 1.3 | -0.1 | 1.1 | -1.3 | -6.4 | 2.1 | 0.6 | -0.8 |
| 0.03 | 20.0 | 0.067 | 0.0285 | 6.0 | 13.3 | 14.6 | 11.2 | -1.1 | -0.8 | 0.6 | -1.9 | 1.1 | -1.2 | -5.8 | 2.5 | 0.6 | -0.7 |
| 0.03 | 20.0 | 0.11 | 0.0235 | 7.0 | 13.7 | 15.4 | 11.2 | -0.5 | -0.4 | -0.8 | -0.9 | 1.6 | -1.1 | -7.0 | 2.1 | 0.6 | -0.5 |
| 0.03 | 25.0 | 0.011 | 0.0348 | 25.7 | 14.1 | 29.3 | 11.2 | -1.3 | 3.1 | 1.5 | -2.9 | 0.3 | -2.1 | -2.9 | 4.8 | 0.2 | 3.3 |
| 0.03 | 25.0 | 0.017 | 0.0385 | 8.3 | 14.3 | 16.5 | 11.2 | 0.6 | 0.8 | 1.3 | -0.8 | 1.4 | -2.0 | -7.6 | 2.0 | 0.6 | 1.2 |
| 0.03 | 25.0 | 0.027 | 0.0384 | 6.4 | 13.5 | 14.9 | 11.2 | -0.1 | -1.5 | 1.7 | -2.4 | 1.3 | -1.5 | -6.1 | 1.8 | 0.5 | 0.1 |
| 0.03 | 25.0 | 0.043 | 0.0305 | 6.5 | 12.5 | 14.1 | 11.2 | -0.6 | -0.6 | 1.1 | -2.2 | 0.9 | -0.8 | -4.0 | 2.4 | 0.3 | 0.6 |
| 0.03 | 25.0 | 0.067 | 0.0274 | 6.7 | 14.8 | 16.2 | 11.2 | -1.0 | -1.1 | 0.9 | -1.7 | 1.4 | -1.5 | -7.9 | 2.4 | 0.7 | -1.1 |
| 0.03 | 25.0 | 0.11 | 0.0258 | 6.2 | 14.1 | 15.4 | 11.2 | -1.4 | -0.8 | 0.9 | -1.1 | 1.7 | -1.2 | -7.6 | 2.2 | 0.6 | -0.5 |
| 0.03 | 25.0 | 0.17 | 0.0265 | 6.4 | 14.6 | 16.0 | 11.2 | 0.5 | 1.0 | 1.0 | -2.2 | 1.7 | -1.4 | -8.2 | 1.6 | 0.5 | -1.1 |
| 0.03 | 35.0 | 0.017 | 0.0533 | 14.7 | 13.7 | 20.1 | 11.2 | -2.7 | 3.8 | 1.2 | -2.9 | 0.4 | -1.7 | -3.2 | -2.7 | 0.7 | 1.9 |
| 0.03 | 35.0 | 0.027 | 0.0415 | 7.7 | 13.0 | 15.1 | 11.2 | 1.3 | 1.6 | 0.5 | -0.7 | 0.8 | -1.3 | -4.7 | 2.9 | 0.8 | 0.4 |
| 0.03 | 35.0 | 0.043 | 0.0411 | 6.9 | 13.1 | 14.8 | 11.2 | -1.1 | -1.7 | 0.3 | -1.5 | 0.7 | -1.0 | -3.8 | 2.0 | 0.6 | -0.6 |
| 0.03 | 35.0 | 0.067 | 0.0312 | 7.1 | 13.9 | 15.6 | 11.2 | 0.9 | -1.2 | 1.1 | -1.2 | 1.3 | -1.3 | -6.7 | 2.9 | 0.9 | 1.2 |
| 0.03 | 35.0 | 0.11 | 0.0311 | 6.7 | 14.3 | 15.8 | 11.2 | -0.9 | -0.6 | 0.6 | -2.2 | 1.6 | -1.2 | -7.8 | 1.7 | 1.0 | -0.9 |
| 0.03 | 35.0 | 0.17 | 0.0258 | 7.0 | 14.3 | 15.9 | 11.2 | -0.6 | 0.9 | 1.4 | -1.3 | 1.8 | -1.0 | -7.3 | 2.6 | 0.9 | -0.3 |
| [%] | [%] | [%] | [%] | [%] | [%] | [%] | [%] | [%] | [%] | [%] | [%] | [%] | [%] | ||||
|---|---|---|---|---|---|---|---|---|---|---|---|---|---|---|---|---|---|
| 0.03 | 35.0 | 0.27 | 0.0289 | 7.3 | 14.6 | 16.4 | 11.2 | 0.8 | -1.8 | 0.8 | 0.2 | 1.9 | -1.1 | -8.4 | 2.6 | 0.9 | 0.3 |
| 0.03 | 45.0 | 0.027 | 0.0504 | 11.7 | 13.3 | 17.7 | 11.2 | -1.0 | -1.8 | 1.1 | -2.4 | 0.6 | -1.3 | -3.6 | 2.0 | 0.7 | 0.9 |
| 0.03 | 45.0 | 0.043 | 0.0402 | 8.6 | 12.6 | 15.3 | 11.2 | 1.4 | -1.1 | 0.2 | -1.6 | 0.8 | -1.1 | -4.2 | 1.3 | 0.6 | -0.8 |
| 0.03 | 45.0 | 0.067 | 0.0390 | 10.1 | 13.7 | 17.0 | 11.2 | -1.7 | -0.3 | -1.5 | -0.7 | 1.4 | -1.2 | -6.6 | 2.4 | 0.7 | -1.0 |
| 0.03 | 45.0 | 0.11 | 0.0250 | 8.7 | 14.5 | 16.9 | 11.2 | -0.9 | -1.1 | 1.2 | -1.1 | 1.6 | -1.2 | -8.2 | 2.0 | 0.9 | -0.6 |
| 0.03 | 45.0 | 0.17 | 0.0260 | 8.2 | 15.3 | 17.4 | 11.2 | 2.1 | 0.5 | 1.4 | -2.3 | 1.9 | -1.3 | -9.2 | 1.5 | 1.0 | -0.1 |
| 0.03 | 45.0 | 0.27 | 0.0215 | 8.2 | 14.7 | 16.8 | 11.2 | 0.7 | -2.3 | 0.8 | -1.3 | 1.7 | -1.4 | -7.8 | 2.3 | 1.0 | 1.0 |
| 0.03 | 60.0 | 0.043 | 0.0382 | 13.7 | 13.6 | 19.3 | 11.2 | 1.4 | 1.8 | 2.2 | 1.1 | 1.1 | -1.5 | -5.7 | 2.6 | 1.0 | 2.3 |
| 0.03 | 60.0 | 0.067 | 0.0387 | 9.4 | 13.4 | 16.4 | 11.2 | 0.8 | -3.1 | 1.1 | 1.3 | 1.2 | -1.2 | -5.6 | 1.7 | 0.7 | 0.5 |
| 0.03 | 60.0 | 0.11 | 0.0265 | 9.2 | 13.5 | 16.3 | 11.2 | 0.8 | -0.3 | 0.9 | -1.0 | 1.4 | -1.0 | -6.8 | 1.9 | 0.7 | -0.8 |
| 0.03 | 60.0 | 0.17 | 0.0264 | 8.5 | 16.2 | 18.3 | 11.2 | 1.2 | -1.2 | 1.7 | -1.8 | 2.0 | -1.4 | -10.5 | 3.2 | 1.2 | 0.7 |
| 0.03 | 60.0 | 0.27 | 0.0222 | 13.6 | 17.0 | 21.8 | 11.2 | -0.5 | -1.0 | 1.0 | 1.8 | 2.3 | -1.3 | -11.6 | 2.3 | 1.3 | 0.3 |
| 0.03 | 60.0 | 0.43 | 0.0277 | 8.9 | 17.2 | 19.4 | 11.2 | 1.3 | -1.6 | -1.2 | 1.3 | 2.8 | -0.9 | -11.7 | 3.0 | 1.4 | 1.2 |
| 0.03 | 90.0 | 0.067 | 0.0341 | 33.7 | 19.9 | 39.1 | 11.2 | -0.5 | -4.3 | 1.2 | -5.7 | 1.3 | -1.7 | -5.6 | -3.1 | 1.5 | -0.8 |
| 0.03 | 90.0 | 0.11 | 0.0337 | 14.4 | 12.7 | 19.2 | 11.2 | 1.6 | -1.3 | -1.1 | -0.5 | 1.2 | -0.7 | -3.9 | 1.8 | 1.0 | 0.3 |
| 0.03 | 90.0 | 0.17 | 0.0368 | 10.4 | 14.1 | 17.5 | 11.2 | 2.0 | -2.3 | 1.5 | -1.9 | 1.4 | -1.1 | -6.7 | 2.1 | 1.2 | 0.7 |
| 0.03 | 90.0 | 0.27 | 0.0269 | 10.3 | 13.5 | 17.0 | 11.2 | -0.5 | -1.3 | 1.6 | 0.7 | 1.3 | -1.1 | -6.5 | 1.5 | 1.2 | -0.5 |
| 0.03 | 90.0 | 0.43 | 0.0328 | 10.6 | 14.0 | 17.5 | 11.2 | -0.3 | -1.6 | -1.5 | -1.3 | 1.4 | -0.6 | -6.2 | 2.2 | 1.1 | -1.3 |
| 0.03 | 90.0 | 0.67 | 0.0289 | 20.9 | 16.8 | 26.8 | 11.2 | 2.1 | 1.7 | 1.4 | 2.3 | 3.3 | 0.8 | -9.3 | 3.5 | 1.8 | 3.0 |
| [%] | [%] | [%] | [%] | [%] | [%] | [%] | [%] | [%] | [%] | [%] | [%] | [%] | [%] | ||||
|---|---|---|---|---|---|---|---|---|---|---|---|---|---|---|---|---|---|
| 0.01 | 200.0 | 0.32 | 0.0321 | 5.8 | 6.6 | 8.8 | 3.6 | -0.9 | -0.1 | -0.7 | -0.5 | 1.0 | -0.9 | 5.1 | -0.7 | 1.0 | -0.4 |
| 0.01 | 200.0 | 0.5 | 0.0315 | 5.3 | 7.0 | 8.8 | 3.6 | -1.3 | 0.9 | -0.8 | -1.6 | 0.9 | -0.8 | 5.1 | -0.6 | 0.6 | -1.2 |
| 0.01 | 200.0 | 0.8 | 0.0211 | 7.9 | 5.9 | 9.9 | 3.6 | -1.6 | 1.8 | -0.3 | -3.0 | 1.0 | -1.0 | 1.0 | -1.0 | 0.4 | -1.2 |
| 0.01 | 400.0 | 0.8 | 0.0196 | 13.3 | 7.9 | 15.4 | 3.6 | -1.5 | 0.6 | -0.7 | -3.0 | 0.4 | -1.1 | 5.5 | -1.0 | 0.3 | -0.8 |
| 0.03 | 200.0 | 0.11 | 0.0361 | 5.7 | 13.3 | 14.5 | 11.1 | 0.3 | 0.8 | -0.8 | 0.9 | 1.8 | -0.4 | 6.0 | -2.4 | 1.9 | 0.4 |
| 0.03 | 200.0 | 0.17 | 0.0331 | 4.8 | 13.1 | 14.0 | 11.1 | 0.2 | 0.4 | -0.7 | 0.9 | 1.8 | -0.6 | 5.8 | -2.3 | 1.7 | 0.6 |
| 0.03 | 200.0 | 0.27 | 0.0283 | 5.3 | 12.3 | 13.4 | 11.1 | 0.1 | 0.5 | -0.8 | 0.8 | 1.7 | -0.9 | 3.8 | -2.1 | 1.4 | 0.2 |
| 0.03 | 200.0 | 0.43 | 0.0309 | 5.5 | 12.2 | 13.4 | 11.1 | -0.5 | 1.2 | -0.7 | 0.1 | 1.5 | -1.0 | 3.7 | -2.1 | 0.9 | -0.1 |
| 0.03 | 200.0 | 0.67 | 0.0297 | 7.2 | 13.4 | 15.2 | 11.1 | -1.0 | 2.8 | -0.9 | -1.2 | 0.8 | -0.6 | 5.8 | -2.6 | 0.2 | 0.5 |
| 0.03 | 400.0 | 0.27 | 0.0322 | 7.6 | 13.4 | 15.4 | 11.1 | -0.4 | 0.6 | -0.2 | 0.1 | 1.2 | -0.8 | 6.9 | -1.8 | 1.3 | -0.3 |
| 0.03 | 400.0 | 0.43 | 0.0293 | 6.9 | 12.2 | 14.0 | 11.1 | -0.7 | -0.4 | -0.1 | -0.3 | 0.9 | -0.8 | 4.1 | -2.2 | 0.7 | -0.2 |
| 0.03 | 400.0 | 0.67 | 0.0289 | 8.0 | 13.5 | 15.6 | 11.1 | -0.9 | 1.2 | -0.7 | -0.9 | 1.1 | -0.9 | 6.6 | -2.1 | 0.5 | -0.4 |
| 0.03 | 800.0 | 0.43 | 0.0391 | 13.1 | 13.7 | 19.0 | 11.1 | -0.9 | 2.4 | -1.2 | -0.3 | 0.1 | -0.5 | 7.1 | -2.1 | 0.2 | -0.4 |
| 0.03 | 800.0 | 0.67 | 0.0228 | 14.6 | 14.6 | 20.6 | 11.1 | -0.1 | -0.9 | 0.3 | -0.5 | 0.2 | -0.5 | 9.1 | -2.1 | 0.1 | -0.2 |
| 0.03 | 1600.0 | 0.67 | 0.0214 | 27.9 | 15.5 | 31.9 | 11.1 | -1.6 | -5.7 | -3.2 | -1.7 | -0.4 | -0.1 | 7.5 | -2.6 | -0.2 | -0.3 |
| range | |||||
|---|---|---|---|---|---|
| (%) | (%) | (%) | |||
| 0.005 - 0.016 | 0.01 | 15 | 59 | 25 | 64 |
| 0.016 - 0.05 | 0.03 | 7.7 | 37 | 18 | 41 |
| range | [] | ||||
|---|---|---|---|---|---|
| (%) | (%) | (%) | |||
| 200 - 560 | 350 | 6.0 | 50 | 21 | 54 |
| 560 - 2240 | 1150 | 1.0 | 40 | 18 | 44 |
| range | [] | ||||
|---|---|---|---|---|---|
| (%) | (%) | (%) | |||
| 0.3 - 0.5 | 0.40 | 0.58 | 62 | 27 | 68 |
| 0.5 - 0.8 | 0.65 | 0.44 | 44 | 21 | 48 |
| 0.8 - 1.0 | 0.90 | 0.17 | 79 | 17 | 81 |