BEYOND THE STANDARD MODEL AT BELLE: AND SEARCH FOR LEPTONIC DECAYS
Abstract
We report the first measurement of the forward-backward asymmetry and the ratios of Wilson coefficients and in , obtained using 386M pairs that were collected at the resonance with the Belle detector at the KEKB asymmetric-energy collider. We also summarise the results obtained by Belle in searches for purely leptonic decays, with emphasis on their impact on models of physics beyond the Standard Model.
1 Introduction
The Belle detector[1], operating at the KEKB collider[2] at a centre-of-mass energy corresponding to the mass of the resonance, has accumulated as of May 2006 a data sample corresponding to more than 500M pairs. Such a large sample of mesons allows the study of rare decays, which are among the cleanest probes of the flavour sector of the Standard Model (SM) available to present experiments. In particular, these decays have the potential of revealing the existence of new particles and couplings not present in the SM, but predicted by several models of physics Beyond the SM (BSM).
In the last few years Belle has reported several measurements that constrain the parameter space of BSM theories. In particular, this review will concentrate on the measurement of forward-backward asymmetry and of ratios of Wilson coefficients in [3], described in Section 2, and on the searches for purely leptonic decays of the type , detailed in Section 3, and (Section 4).
2 Measurement of forward-backward asymmetry and ratios of Wilson coefficients in
Flavor-changing neutral current processes are forbidden at tree level and can only proceed via loop diagrams in the SM. Loops are sensitive to new physics effects via insertion of heavy particles in the internal lines; if new heavy particles can contribute to the decays, their amplitudes will interfere with the SM amplitudes and thereby modify the decay rate as well as differential distributions.
Such contributions would therefore change the Wilson coefficients[4] that parametrise the strength of the short distance interactions. The amplitude is described by the effective Wilson coefficients , and , whose terms have been calculated up to next-to-next-to-leading order (NNLO) in the SM[5]. A measurement of the forward-backward asymmetry and of the differential decay rate as functions of and for constrains the relative signs and magnitudes of these coefficients[6, 7]. Here is the squared invariant mass of the dilepton system, and is the angle between the momenta of the negatively (positively) charged lepton and the () meson in the dilepton rest frame. The forward-backward asymmetry is defined as
| (1) |
2.1 Selection of events
The analysis is based on a data sample containing 386M pairs; the mode is also studied, since it is expected to have a very small forward-backward asymmetry even in the presence of new physics[8] and can therefore be used as null test for the measurement.
The following final states are used to reconstruct candidates: , , and , with subdecays , and , , and . Hereafter, and are combined and called . Two variables defined in the centre-of-mass (CM) frame are used to select candidates: the beam-energy constrained mass and the energy difference , where and are the measured CM momentum and energy of the candidate, and is the CM beam energy.
The dominant background consists of events where both mesons decay semileptonically. This background is suppressed using missing energy and , where is the angle between the flight direction of the meson and the beam axis in the CM frame. The resonant contributions due to charmonia ( and ) are rejected using the dilepton invariant mass. The signal box is defined as MeV/ for both lepton modes and for the electron (muon) mode. An unbinned maximum-likelihood fit to the distribution is performed in order to determine the signal yield. The fit includes several event categories, i.e. signal, three types of cross-feeds and four background sources. In the fit, all background fractions except the dilepton background are fixed while the signal fraction is allowed to float.
The fit yields and signal events for the and modes, respectively. Data and fit results are shown in Figure 1.

2.2 Extraction of and Wilson coefficients
The candidates in the signal box are used to measure the normalised double differential decay width. For the evaluation of the Wilson coefficients, the NNLO Wilson coefficients of Ref.[5] are used. Since the full NNLO calculation only exists for , we adopt the so-called partial NNLO calculation[9] for . The higher order terms in the are fixed to the SM values while the leading terms , with the exception of , are allowed to float. Since the branching fraction measurement of is consistent with the prediction for within the SM, is fixed at the SM value, , or the sign-flipped value, . The fit parameters are therefore and ; the SM predictions for and are 4.069 and –4.213, respectively[9].
To extract these ratios, an unbinned maximum likelihood fit is performed to the events in the signal box with a probability density function that includes the normalised double differential decay width.
The -integrated asymmetry is measured by determining the yield in forward and backward regions from a fit to the distribution. After correcting for efficiency, the result is:
| (2) |
where the first uncertainty is statistical and the second is systematic. A large integrated asymmetry is observed for with a significance of . The result for is consistent with zero as expected.
The fit results of ratios of Wilson coefficients are summarised in Table 1. Figure 2 shows the fit results projected onto the background-subtracted forward-backward asymmetry distribution in bins of .
| Negative | Positive | |||
|---|---|---|---|---|

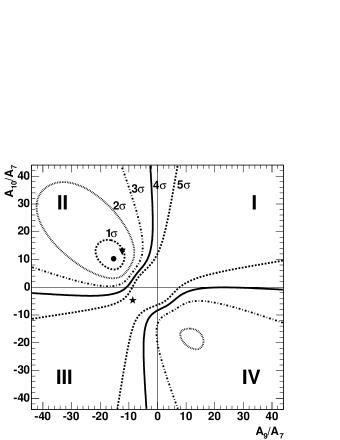
The fit results are consistent with the SM values and . In Figure 3, we show confidence level (CL) contours in the (, ) plane based on the fit likelihood smeared by the systematic uncertainty, which is assumed to have a Gaussian distribution. We also calculate an interval in at the 95% CL for the allowed region,
| (3) |
This result implies that the sign of must be negative, and the solutions in quadrants I and III of Figure 3 are excluded at 98.2% CL. Since solutions in both quadrants II and IV are allowed, we cannot determine the sign of .
3 Search for
Leptonic decays of charged mesons proceed in the SM via the -mediated annihilation tree diagram, with a branching fraction given by:
| (4) |
where is the meson lifetime, is the decay constant and an element of the CKM-matrix. These modes are thus very interesting because they give direct access to the product , from which one can extract a measurement of . The SM expectation for is around ; decays to lighter leptons are helicity suppressed, by factors of 223 for muons and 107 for electrons. Allowing for decay amplitudes BSM, measurements of these processes give stringent limits on important parameters of such SM extensions, e.g. the mass of the charged Higgs boson and (the ratio of vacuum expectation values of the two Higgs doublets) in the minimal supersymmetric SM (MSSM), or leptoquark masses in Pati-Salam models.
3.1
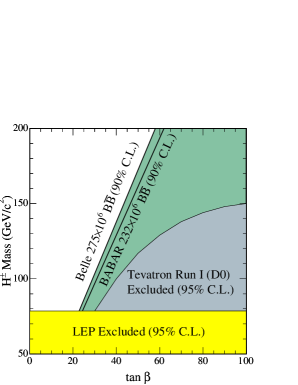
The search for 111A few weeks after this conference, the Belle collaboration has announced evidence for [10], thus providing the first evidence of a purely leptonic decay and the first direct determination of the decay constant . decays is based on the full reconstruction of one of the mesons in the event, in the modes and (), selected in a sample of 275M events[11]. Decays of the types , , , and are then searched for in the event remainders. The final event selection is based on the extra energy present in the electromagnetic calorimeter. So-called double-tag events (i.e. fully reconstructed decays) are used to validate the simulation of this quantity. The resulting upper limit on the branching fraction is at 90% CL. In the two-Higgs doublet model, this limit can be translated[12] in the exclusion of a region in the Higgs mass () versus plane. The Belle result is shown in Figure 4 together with constraints placed by other measurements[13, 14, 15].
3.2 and
The electron and muon channels are studied in Belle by requiring one highly energetic lepton in the event and large missing energy and missing momentum corresponding to the undetected neutrino. All other particles in the event are used to reconstruct the companion , which has to satisfy requirements on and . The final selection variable used to isolate the signal is the lepton momentum in the rest frame, defined by the momentum of the recoiling companion . The latest Belle results are at 90% CL, based on a data sample of [16] and at 90% CL, based on [17].
4 Search for
The decay of to pairs of charged leptons can proceed in the SM via box diagrams or via annihilation into boson or photon. Similarly to their counterparts, the predicted branching fractions are helicity suppressed for light leptons, down to about for muons and for electrons. Enhancements of these branching fractions are predicted by several BSM theories, such as high- MSSM and some SUSY scenarios. The lepton flavour violating mode is forbidden in the SM and so any signal in this mode would be an undeniable sign of new physics. Belle has set the following 90% CL upper limits based on a data sample of 78 [18]: , and . The latter result can be interpreted as a lower bound on the Pati-Salam leptoquark mass[19]: at 90% CL.
References
- 1 . A. Abashian et al. (Belle Collaboration), Nucl. Instr. and Meth. A 479, 117 (2002).
- 2 . S. Kurokawa and E. Kikutani, Nucl. Instr. and Meth. A 499, 1 (2003), and other papers included in this volume.
- 3 . A. Ishikawa et al. (Belle Collaboration), hep-ex/0603018, submitted to Phys. Rev. Lett.
- 4 . See, for example, G. Buchalla et al., Rev. Mod. Phys. 68, 1125 (1996).
- 5 . H. H. Asatryan et al., Phys. Lett. B 507, 162 (2001).
- 6 . E. Lunghi et al., Nucl. Phys. B 568, 120 (2000).
- 7 . J. L. Hewett and J. D. Wells, Phys. Rev. D 55, 5549 (1997); A. Ali et al., Z. Phys. C 67, 417 (1995); N. G. Deshpande et al., Phys. Lett. B 308, 322 (1993); B. Grinstein et al., Nucl. Phys. B 319, 271 (1991); W. S. Hou et al., Phys. Rev. Lett. 58, 1608 (1987).
- 8 . D. A. Demir et al., Phys. Rev. D 66, 034015 (2002).
- 9 . A. Ali et al., Phys. Rev. D 66, 034002 (2002).
- 10 . K. Ikado et al. (Belle Collaboration), hep-ex/0604018, submitted to Phys. Rev. Lett.
- 11 . K. Abe et al. (Belle Collaboration), hep-ex/0507034.
- 12 . W. S. Hou, Phys. Rev. D 48, 2342 (1993).
- 13 . P. Bock et al. (ALEPH, DELPHI, L3 and OPAL Collaborations), CERN-EP-2000-055.
- 14 . V. M. Abazov et al. (D0 Collaboration), Phys. Rev. Lett. 88, 151803 (2002).
- 15 . B. Aubert et al. (BaBar Collaboration), Phys. Rev. D 73, 057101 (2006).
- 16 . K. Abe et al. (Belle Collaboration), hep-ex/0408132.
- 17 . K. Abe et al. (Belle Collaboration), Belle-conf-0247, available on the server http://belle.kek.jp/.
- 18 . M.-C. Chang et al. (Belle Collaboration), Phys. Rev. D 68, 111101 (2003).
- 19 . J.C. Pati and A. Salam, Phys. Rev. D 10, 275 (1974); A.V. Kuznetsov and N.V. Mikheev, Phys. Lett. B 329, 295 (1994); G. Valencia and S. Willenbrock, Phys. Rev. D 50, 6843 (1994).