Study of the process with SND detector
at the VEPP-2M collider
Abstract
In experiment with the SND detector at the VEPP-2M collider the cross section was measured in the center-of-mass energy range =0.60–1.38 GeV with the integrated luminosity of 27.8 pb-1. The measured cross section is well described by the vector meson dominance model with contributions from the , , , resonances and agrees with results of previous measurements. The decay probabilities , and were measured with the accuracies better than or comparable to the world averages.
pacs:
13.66.Bc, 14.40.Aq, 13.40.GpI Introduction
Measurements of the vector mesons radiative decays were subject of experimental investigation in several tens of experiments during more than 40 years pdg . However, further improvement of accuracy of these branching ratios measurements is still important for development of various phenomenological models — quark models, SU(3) based linear and non-linear sigma models and vector meson dominance models, link1 ; link2 ; link3 .
The vector meson radiative decays give information on the underlying non-perturbative QCD dynamics and this is one reason why interest in such decays is still not exhausted. The meson is a member of the low-lying pseudoscalar octet and therefore is a would-be Goldstone boson associated with the spontaneous breaking of chiral symmetry in the QCD vacuum. Besides it is significantly connected to the meson which by itself is strongly affected by QCD axial anomaly. Therefore any information about the meson structure, and the vector mesons radiative decays are one of sources of such information, will give a clue about the QCD vacuum and mechanisms of the chiral symmetry breaking.
Theoretically radiative decays with the final state were investigated in the context of a quark-level linear sigma model QCD1 , using QCD sum rules QCD2 and in the framework of the non-relativistic quark model QCD3 .
Another interesting theoretical problem where the high precision experimental input from the vector meson radiative decays is welcome is the mixing problem. As the experimental data became more precise it turned out that the traditional one mixing angle scheme does not work properly and more sophisticated two mixing angle description was developed mixing1 . The physics underlying and mesons constitutes a vivid and fascinating research field today providing unexpected challenges and surprises mixing2 .
The best accuracy in measurement of the decay probabilities was achieved in the last storage ring experiments with CMD-2 exd3 ; exd2 ; exd23 and SND exd16 ; exd7 ; exd17 ; exd22 ; exd18 detectors through investigation of the processes. The reached accuracy is of the order of 10% for the decays and about 2% for the decay, and the last result has been obtained by averaging more than 10 measurements with accuracies of the order of 5% each.
In this paper we present results of our studies of the process
| (1) |
with the subsequent decays of the meson into the three-pion final states:
| (2) | |||
| (3) |
Experimental data with integrated luminosity of 27.8 pb-1 collected in experiments with the SND detector at the VEPP-2M collider in the center-of-mass energy range =0.60–1.38 GeV were analyzed.
The aim of the present work is to increase the accuracy of measurements of the decay probabilities , and also to measure the cross section in the non-resonant region, in particular, at energies above the -meson resonance.
II The SND detector
The general purpose non-magnetic detector SND SND was developed for experiments at VEPP-2M collider. The basic part of SND is a three layer electromagnetic calorimeter consisting of 1632 NaI(Tl) crystals. Total thickness of the calorimeter is 13.4 radiation lengths. The calorimeter covers nearly of the full solid angle: , where is the polar angle. Dependence of the energy resolution of the calorimeter on energy of the photon is given by the formula , while the angular resolution is degrees.
For determination of charged particles production angles, two coaxial cylindrical drift chambers are used. The angular resolution is in polar direction, and in the azimuthal direction.
Experiments were performed in 1995–2000 in the energy range =0.38– 1.38 GeV. The statistics was collected by repeated scanning of the energy range with variable step. Integrated luminosity was measured using elastic scattering and two-photon annihilation with 2% accuracy. In total the SND detector recorded about events. From them about are events with -meson production and decay, with the -meson production, and with the -meson production.
III Selection of events in the decay channel
Selection of events of the process under study (1) in the decay mode (2) was performed in several steps. At the first stage the events satisfying the following conditions were selected:
-
1.
, where is the number of reconstructed photons in an event;
-
2.
, where is the number of reconstructed charged particle tracks;
-
3.
, where is the total energy deposition in the calorimeter;
-
4.
, where is the total momentum of photons;
-
5.
.
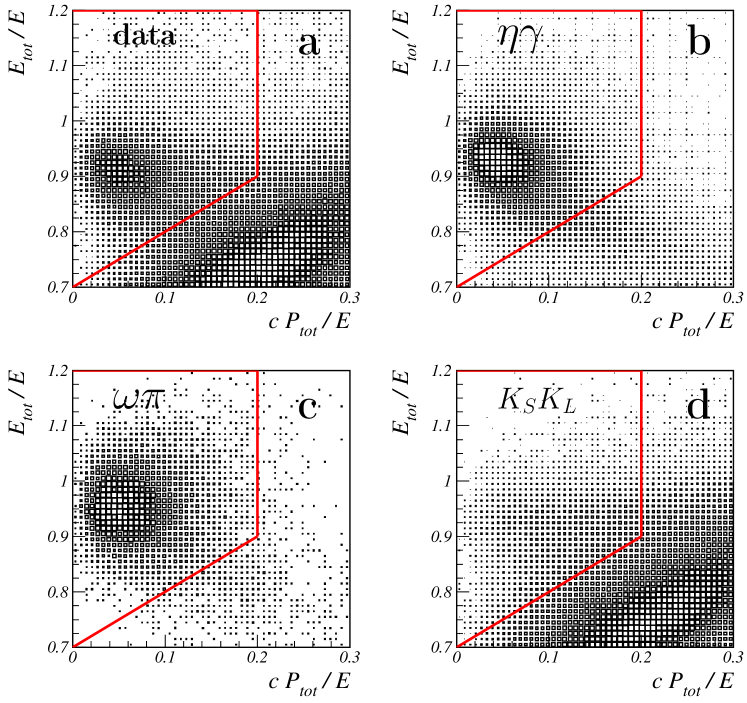
We allow a loss of one soft photon from 7 final photons of the reaction. Besides, we accept events with extra photons (). The extra photons appear as a result of shower splitting in the calorimeter or superimposed machine background. Since the final state of the process under study includes only photons, the energy deposition in the calorimeter and the total photon momentum (magnitude of the vector sum of photon momenta) are close to center-of-mass energy and zero, respectively. Fig.1 shows two-dimensional distribution of these parameters for data events, and Monte-Carlo (MC) simulated events of signal and background processes. The line indicates the selection cuts 3, 4 and 5. With the use of these criteria, 47676 events have been selected.
As the background sources one has the following processes
| (4) | |||
| (5) | |||
| (6) |
Analysis of the experimental data has shown that the quantum-electrodynamic events from processes with large cross sections, for example:
| (7) |
also can give the required event configuration when the machine background is superimposed on them. The contributions of other background processes are negligible.
For events selected at the first stage, kinematic fits using the measured photon angles and energies, and energy-momentum conservation laws, were performed. The quality of each kinematic fit is characterized by the parameter . Five kinematic hypotheses were checked:
-
1.
( – the corresponding parameter),
-
2.
(),
-
3.
(),
-
4.
().
-
5.
().
In hypotheses 2, 4, 5 additional constraints on invariant masses of the photon pairs and on the invariant mass of the system were applied. In case when the number of detected photons in the event exceeded the number of photons necessary for the given hypothesis, kinematic fit was performed for all possible photon combinations and the one with the lowest value was selected.
In the energy region below 1 GeV the process is the only process with a significant cross section and multi-photon final state. In the -meson region there is a contribution from the process (4). Since this energy region is above the production threshold, there is also a background from the process (5).
For separation of events of the process (1) at GeV and suppression of the background from processes (4), (5) and (7), the following cuts on the parameters were imposed:
-
1.
;
-
2.
;
-
3.
.
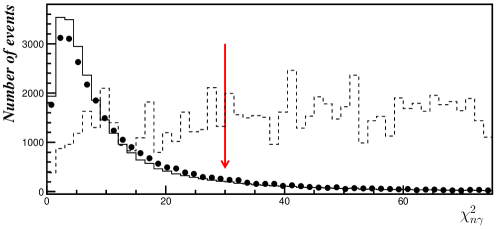
The distributions of for data events and simulated signal and background events are shown in Fig. 2.
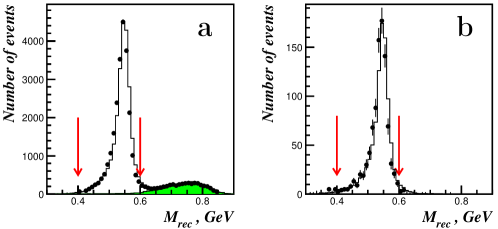
After applying these selections criteria about events were left for further analysis. The recoil mass distribution of the most energetic photon is presented in Fig. 3 for energies close to the and resonances. Events in Fig.3b with GeV are attributed to the process (4). Final selection of events was carried out with the cut GeV.
The contribution of the background process (4) for each energy point in the -meson region was determined as follows:
| (8) |
where and are number of MC simulated events of the process (4) with recoil mass of the most energetic photon in intervals 0.4–0.6 GeV and 0.6–0.8 GeV, respectively. is the number of data events with GeV. The contribution of the background process (4) for the energy points in the range 1.00 – 1.03 GeV is about 1.2% of the total number of selected events at each point. The systematic error on the background event number from the process (4) is 40%. It was estimated as a difference between the calculation with the formula (8) and direct estimation by simulation.
In the energy range from 1.06 GeV (the production threshold) up to 1.40 GeV the contribution of the background process (6) is comparable to that of signal process (1). The kinematics of events (6) closely resembles the kinematics of events (1), which complicates the suppression of the background related to the process (6). Therefore, additional selection criteria were applied to events in the energy region GeV:
-
1.
,
-
2.
,
-
3.
.
With these conditions 47 events with energy GeV were selected (Tables 3, 4).
IV Selection of events in the decay mode
For selection of events of the signal process (1) in the decay mode (3), the following selection criteria were applied at the first stage:
-
1.
,
-
2.
,
-
3.
cm, where is the distance between the -th charged particle track and the beam axis,
-
4.
cm, where is the coordinate of the charged particle production point along the beam axis.
The main background process at energies near and below the resonance is the process
| (9) |
with an extra photon from beam background, photon radiation by initial or final particles or nuclear interaction of the charged pions with the detector material. In the energy region above the meson, the main background contribution is expected from the process
| (10) |
For energies above 1.06 GeV this background significantly exceeds the signal, thus the process (1) in the mode (3) was not studied at energies above 1.06 GeV.
For about events selected with the above-stated criteria in the energy range GeV, the kinematic fit was performed in two hypotheses:
-
1.
(),
-
2.
().
For selection of events of the process and suppression of the background from the process (9) the following cuts were used:
-
1.
,
-
2.
.
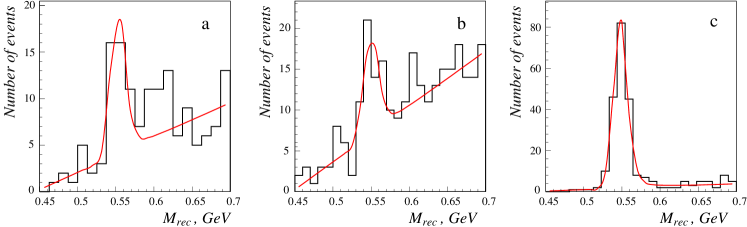
Distributions of the selected events over the recoil mass of the photon, which is not included into the reconstructed -meson, are shown in Fig. 4 for three energy points. Events of the process (1) form a narrow peak near the -meson mass. Events of the background process (9) have the distribution which is well described by a linear function in the recoil mass interval 0.45–0.7 GeV.
The number of events of the process in each energy point was determined by approximating the recoil mass spectra by a sum of the signal and background distributions. For the description of the shape of the signal spectrum so called Novosibirsk function nfun was used which parameters (the width and asymmetry) were taken from simulation. Comparison of the line-shapes for the simulated and data events was performed in the energy range close to the -meson resonance (Fig. 4c) and it was shown that the simulation reproduces the data shape with sufficient accuracy. The recoil photon spectrum for the background events was approximated either by a linear function or by a parabola. The difference between the results of approximations with two different shapes of the background was used for the estimation of the associated systematic error. The obtained numbers of events for different energy points are listed in the Table 5. The quoted errors are statistical and systematic, respectively. For a part of the data points the statistics of neighboring energy points were summed together. In this case the boundaries of the energy interval are shown in the Table 5.
V Detection efficiency
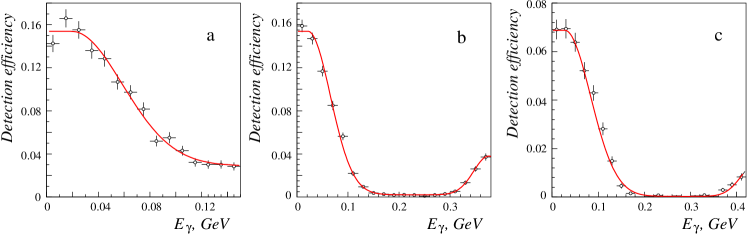
Detection efficiency for the process under study was determined from Monte-Carlo simulation which takes into account the radiative corrections due to photon radiation by initial particles kuraev . Angular distribution of these photons was modeled according to the work martin . The detection efficiency was evaluated as a function of two parameters: the center-of-mass energy and the energy of the additional photon . Fig.5 shows the dependence of the detection efficiency of the process , on . When the “lost energy” increases, the efficiency falls at first and then increases again. Such behavior is due to the presence of two different photons in an event: one from the vector meson decay and the another from the initial state radiation. As the initial state radiation photon reaches its highest allowed energy, it starts to substitute the decay photon, which becomes soft. In fact the number of events from this kinematic region is negligible due to low probability of hard photon emission and very low cross section at threshold.
Detection efficiency values were calculated in each energy point for both decay channels of the -meson (2) and (3). The efficiency obtained from the simulation was corrected to take into account the difference of the detector response simulation from reality. The evaluation of correction factors is described in the section VII.
The visible cross section of the process can be written as
| (11) |
where is the Born cross section, which one needs to extract from the experiment, is a function describing a probability distribution of the energy fraction kuraev taken away by the additional photon. Equation (11) can be rewritten in the traditional form:
| (12) |
where the parameter is defined as follows:
| (13) |
and is the radiative correction.
Technically the determination of the Born cross sections is performed as follows. With the use of formula (11) the energy dependence of the measured visible cross section is approximated. For that the Born cross section is parametrized by some theoretical model describing the data well. With the use of the obtained parameters of the model, the radiative correction is determined and then with the formula (12) the experimental Born cross section is calculated. To estimate the model dependence of the radiative correction due to the choice of cross section approximation function, several models of the Born cross section parametrization are used.
VI Cross section parameterization
Energy dependence of the Born cross section was parameterized according to the vector meson dominance model:
| (14) |
Here is the resonance mass, is its full width which depends on energy (, and are Born cross sections of the and processes at , and are branching fractions of the corresponding decays, are interference phases ().
At approximations of the data, the free parameters were , , and the phases , . In the energy region above the -meson resonance it is necessary to take into account contributions from decays of the radial excitations of the , and mesons. As the experimental statistics in this energy region is scarce, we restricted ourselves to introduction of just one additional resonance with the mass GeV and width GeV. The cross section at the resonance and the phase were also free parameters.
VII Systematic uncertainties
The systematic errors on the measured Born cross section include the contributions of uncertainties in the detection efficiency, the luminosity measurement, and systematic errors of the background subtraction which were discussed above.
To take into account imperfect modeling of the detector response, the detection efficiency determined from simulation was multiplied by a correction factor. It was evaluated using events from the energy interval in the vicinity of the -meson resonance where the process (1) can be extracted with low background by application of the selection criteria less stringent than those described in Section III. In particular, we can exclude the condition and calculate the corresponding correction factor (connected with the application of this condition) as follows:
where , are event numbers in the data and simulation, respectively, without the cut on , , are numbers of events with . For data events the preliminary subtraction of the background from the process was performed. Analogous corrections were calculated for all other selection conditions used in the analysis. The overall correction factors for the mode (2) were and for selection criteria used for energies GeV and GeV, respectively. Since the fraction of events rejected by the selection cuts is practically independent on energy, the correction found at -meson was applied to all energies. The uncertainty of the correction factor was included into the detection efficiency uncertainty.
As it was discussed earlier, additional “false” photons appear in the SND calorimeter because of beam-background pile-up. To take into account this effect in the Monte-Carlo simulation, actual events recorded with special random trigger were merged with simulated events in proper proportion. Unaccounted difference in photon multiplicities between data and simulation can lead to an additional uncertainty in the detection efficiency. Another effect which is not compensated by the correction factor considered above is a possible inaccuracy of the calorimeter response modeling near the calorimeter edges.
To estimate the influence of these effects we analyzed events with additional conditions and , where is a polar angle of the detected photon. The following ratios have been calculated:
Although both ratios are compatible with unity, we use their deviations from unity as estimates of the systematic uncertainties connected with discrepancies of the photon multiplicity and edge effects modeling.
Thus the total systematic error of the detection efficiency for the mode (2) is estimated to be 1.9%.
For the decay mode (3), the total correction factor for the detection efficiency turned out to be . The uncertainty due to the “edge effect” was taken from the analysis of the channel (2). The total systematic error for the decay mode (3) is 1.8%.
The integrated luminosity was determined by using two QED processes and which cross sections are known with accuracy better than 1%. The difference between these two luminosity measurements was used as an estimate of the systematic uncertainty of the luminosity determination. It is 2% and practically independent of the beam energy.
The uncertainty in the the radiative correction calculation includes the theoretical uncertainty which does not exceed 0.1% kuraev , and the model uncertainty, which is also 0.1%.
VIII Results of the cross section approximation
Before carrying out approximation of the cross section energy dependence, the ratio of the -meson decay probabilities in two decay modes was calculated from the corresponding event numbers and detection efficiencies. It was found that the ratio does not depend on the beam energy. Therefore combined approximation of the visible cross sections measured in two decay modes was performed. For the decay probabilities and the world-average values pdg were used, the ratio of the decay probabilities and was a free parameter. As a result of the approximation the following value of this ratio has been obtained
The systematic error includes uncertainties in the detection efficiency, the luminosity measurement, and the systematic error in the number of selected events. Our result is in a good agreement with the world-average value pdg , . Further approximation was performed with this ratio fixed at the world-average value but with its uncertainty taken into account.
| nb | |
| nb | |
| nb | |
| nb | |
Values of the cross sections at the resonance maximums and the interference phases obtained as a result of approximation are presented in the Table 1.

IX Conclusion
In the present work the cross section of the process was measured in the decay modes and in the energy range 0.60–1.38 GeV. The obtained data agree with the results of previous measurements exd3 ; exd2 ; exd23 ; exd16 ; exd7 ; exd17 ; exd22 ; exd18 .
| This work | Previous measurements | PDG pdg | |
|---|---|---|---|
| exd2 | |||
| exd2 | |||
| exd17 |
The measured cross section is well described by the vector meson dominance model with contributions from , , , and their excitations, represented in our fit to data by . As a result of the data approximation we obtained the decay probabilities listed in Table 2 together with the world-average values and most precise results of previous measurements. The quoted PDG values include SND measurements in and modes exd7 ; exd18 based on a part of collected statistics. The present work uses full SND statistics and supersede the results of the measurements exd7 ; exd18 .
In contrast to previous measurements, the approximation of the cross section was performed with free interference phases and therefore the obtained values of the decay probabilities do not depend on model assumptions on these phases. The following values of the phases were obtained:
From the ratio of the cross sections in two decay modes, the ratio of the meson decay probabilities was measured:
The work is supported in part by grants Sci.School-905.2006.2 and RFBR 04-02-16181-a, 04-02-16184-a, 05-02-16250-a, 06-02-16292-a, 03-02-16292-a.
References
- (1) Review of Particle Physics, S. Eidelman et al., Phys. Lett. B 592, 1 (2004).
- (2) P. O’Donnel, Rev. Mod. Phys. 53, 673 (1981).
- (3) G. Morpurgo, Phys. Rev. D 42, 1497 (1990).
- (4) M. Benayoun et al., Phys. Rev. D 59, 114027 (1999).
- (5) M. Napsuciale, S. Rodriguez and E. Alvarado-Anell, Phys. Rev. D 67, 036007 (2003).
- (6) C. Aydin and A. H. Yilmaz, Acta Phys. Polon. B 34, 4145 (2003).
- (7) R. Bonnaz, B. Silvestre-Brac and C. Gignoux, Eur. Phys. J. A 13, 363 (2002).
- (8) R. Escribano, arXiv:hep-ph/0510206; R. Escribano and J. M. Frere, JHEP 0506, 029 (2005); T. Feldmann, P. Kroll and B. Stech, Phys. Rev. D 58, 114006 (1998); T. Feldmann and P. Kroll, Phys. Scripta T99, 13 (2002).
- (9) F. Kleefeld, arXiv:nucl-th/0510017.
- (10) R.R.Akhmetshin et al., Phys. Lett. B 460, 242 (1999).
- (11) R.R.Akhmetshin et al., Phys. Lett. B 509, 217 (2001).
- (12) R.R.Akhmetshin et al., Phys. Lett. B 605, 26 (2005).
- (13) M.N.Achasov et al., JETP Lett. 68, 573 (1998).
- (14) M.N.Achasov et al., JETP Lett. 72, 282 (2000).
- (15) M.N.Achasov et al., Eur. Phys. J. C 12, 25 (2000).
- (16) M.N.Achasov et al., Nucl. Phys. A 675, 213 (2000).
- (17) M.N.Achasov et al., J. Exp. Theor. Phys. 90, 17 (2000).
- (18) M.N.Achasov et al., Nucl. Instrum. Methods Phys. Res. A 449, 125 (2000).
- (19) R.R.Akhmetshin et al., Phys. Lett. B 489, 125 (2000)
- (20) The “Novosibirsk” function is defined as , where , is the peak position, is the width of the distribution, is the asymmetry parameter.
- (21) E.A. Kuraev and V.S. Fadin, Sov. J. Nucl. Phys. 41, 466 (1985).
- (22) G. Bonneau and F .Martin, Nucl. Phys. B 27 381 (1971).
| , MeV | , MeV | , nb-1 | , nb | |||
|---|---|---|---|---|---|---|
| 599.94 | 0.16 | 88.22 | 0.0 | 0.091 | 0.8424 | |
| 629.96 | 0.18 | 117.47 | 0.0 | 0.129 | 0.8586 | |
| 660.00 | 0.18 | 274.29 | 2.0 | 0.142 | 0.8671 | 0.059 |
| 689.98 | 0.20 | 170.46 | 0.0 | 0.159 | 0.8712 | |
| 720.00 | 0.21 | 575.44 | 17.0 | 0.152 | 0.8754 | 0.22 |
| 749.98 | 0.23 | 225.20 | 10.0 | 0.152 | 0.8837 | 0.33 |
| 760.00 | 0.24 | 246.09 | 12.0 | 0.152 | 0.8848 | 0.36 |
| 764.00 | 0.26 | 258.70 | 11.0 | 0.152 | 0.8825 | 0.32 |
| 770.00 | 0.25 | 291.87 | 21.0 | 0.152 | 0.8689 | 0.54 |
| 773.98 | 0.25 | 220.07 | 22.0 | 0.152 | 0.8452 | 0.78 |
| 778.00 | 0.30 | 259.50 | 48.0 6.9 | 0.152 | 0.8068 | 1.50 0.22 |
| 780.00 | 0.25 | 315.38 | 60.0 7.7 | 0.152 | 0.7922 | 1.58 0.21 |
| 780.98 | 0.24 | 346.63 | 91.0 9.5 | 0.152 | 0.7913 | 2.18 0.23 |
| 782.00 | 0.24 | 664.82 | 171.0 13.1 | 0.152 | 0.7976 | 2.13 0.17 |
| 783.00 | 0.24 | 483.13 | 119.0 10.9 | 0.152 | 0.8118 | 2.00 0.19 |
| 783.98 | 0.24 | 356.57 | 83.0 9.1 | 0.152 | 0.8324 | 1.84 0.21 |
| 785.02 | 0.24 | 221.39 | 44.0 6.6 | 0.152 | 0.8585 | 1.52 0.23 |
| 785.98 | 0.24 | 270.02 | 48.0 6.9 | 0.152 | 0.8835 | 1.32 0.19 |
| 789.96 | 0.25 | 193.41 | 24.0 | 0.152 | 0.9651 | 0.85 |
| 793.96 | 0.25 | 211.95 | 19.0 | 0.152 | 1.004 | 0.59 |
| 800.00 | 0.25 | 284.30 | 25.0 | 0.152 | 1.021 | 0.57 |
| 809.98 | 0.26 | 286.94 | 13.0 | 0.152 | 1.021 | 0.29 |
| 819.94 | 0.26 | 321.32 | 23.0 | 0.155 | 1.010 | 0.46 |
| 840.00 | 0.28 | 692.59 | 27.0 | 0.155 | 0.9923 | 0.25 |
| 879.92 | 0.31 | 384.26 | 11.0 | 0.155 | 0.9594 | 0.19 |
| 919.86 | 0.35 | 487.38 | 19.0 | 0.155 | 0.9312 | 0.27 |
| 939.88 | 0.34 | 488.74 | 19.0 | 0.155 | 0.9155 | 0.27 |
| 949.78 | 0.32 | 268.39 | 6.0 | 0.155 | 0.9065 | 0.16 |
| 957.80 | 0.32 | 241.85 | 13.0 | 0.155 | 0.8981 | 0.39 |
| 969.80 | 0.34 | 258.55 | 8.0 | 0.155 | 0.8833 | 0.23 |
| 980.00 | 0.21 | 124.62 | 4.0 | 0.152 | 0.8703 | 0.24 |
| 984.10 | 0.37 | 348.02 | 19.0 | 0.152 | 0.8624 | 0.42 |
| 1003.82 | 0.38 | 365.59 | 72.0 8.5 0.3 | 0.152 | 0.8061 | 1.60 0.19 |
| 1009.68 | 0.39 | 299.53 | 113.0 10.6 0.5 | 0.152 | 0.7771 | 3.18 0.31 |
| 1015.64 | 0.39 | 344.73 | 588.3 24.3 2.8 | 0.152 | 0.7324 | 15.10 0.89 |
| 1016.70 | 0.38 | 601.93 | 1680.7 41.0 8.1 | 0.152 | 0.7233 | 24.99 1.26 |
| 1017.66 | 0.38 | 937.42 | 3659.2 60.5 17.6 | 0.152 | 0.7182 | 35.44 1.79 |
| 1018.64 | 0.39 | 984.89 | 5691.5 75.4 27.3 | 0.152 | 0.7238 | 53.53 1.73 |
| 1019.62 | 0.42 | 1060.53 | 6365.2 79.8 30.6 | 0.152 | 0.7544 | 54.02 1.29 |
| 1020.58 | 0.40 | 628.02 | 3213.9 56.7 15.4 | 0.152 | 0.8136 | 41.31 1.70 |
| 1021.64 | 0.41 | 325.47 | 1056.3 32.5 5.1 | 0.152 | 0.9012 | 23.32 1.22 |
| 1022.78 | 0.39 | 353.27 | 672.4 25.9 3.2 | 0.152 | 1.009 | 12.24 0.70 |
| 1027.76 | 0.40 | 362.76 | 241.2 15.5 1.2 | 0.152 | 1.577 | 2.76 0.19 |
| 1033.70 | 0.39 | 327.43 | 98.8 9.9 0.5 | 0.152 | 2.468 | 0.80 0.08 |
| 1039.68 | 0.39 | 389.43 | 65.0 8.1 0.3 | 0.152 | 3.669 | 0.30 0.04 |
| 1049.76 | 0.39 | 441.28 | 39.3 6.3 0.2 | 0.152 | 6.584 | 0.089 0.014 |
| 1059.76 | 0.44 | 637.23 | 48.3 7.0 0.2 | 0.152 | 10.74 | 0.046 0.007 |
| , MeV | , MeV | , nb-1 | , nb | |||
|---|---|---|---|---|---|---|
| 1078.54 | 3.55 | 650.05 | 18.0 | 0.0789 | 24.65 | 0.014 |
| 1099.92 | 5.45 | 605.60 | 9.0 | 0.0769 | 35.73 | 0.005 |
| 1131.58 | 10.49 | 749.68 | 9.0 | 0.0739 | 16.39 | 0.010 |
| 1182.96 | 15.08 | 1292.02 | 4.0 | 0.0692 | 2.816 | 0.015 |
| 1227.34 | 11.14 | 959.07 | 1.0 | 0.0651 | 1.254 | 0.013 |
| 1271.68 | 14.33 | 1061.97 | 3.0 | 0.0610 | 0.9952 | 0.046 |
| 1315.44 | 11.72 | 954.60 | 1.0 | 0.0570 | 0.9465 | 0.019 |
| 1360.44 | 14.39 | 1958.92 | 2.0 | 0.0529 | 0.9335 | 0.021 |
| , MeV | , MeV | , nb-1 | , nb | |||
|---|---|---|---|---|---|---|
| 755.26 | 5.00 | 492.5 | 5.7 4.0 1.0 | 0.0695 | 0.8808 | 0.19 0.13 |
| 769.12 | 3.98 | 809.3 | 20.7 8.8 1.7 | 0.0695 | 0.8683 | 0.40 0.17 |
| 777.96 | 0.24 | 264.6 | 16.6 7.7 0.3 | 0.0695 | 0.8055 | 1.12 0.52 |
| 779.98 | 0.28 | 338.5 | 22.1 9.1 0.4 | 0.0640 | 0.7918 | 1.28 0.53 |
| 780.98 | 0.24 | 365.3 | 25.6 9.4 0.5 | 0.0640 | 0.7909 | 1.38 0.51 |
| 782.00 | 0.24 | 697.3 | 61.1 16.4 1.2 | 0.0640 | 0.7972 | 1.71 0.46 |
| 783.00 | 0.24 | 506.3 | 59.1 14.3 1.2 | 0.0640 | 0.8114 | 2.23 0.54 |
| 783.98 | 0.24 | 374.3 | 40.0 11.1 0.8 | 0.0640 | 0.8319 | 1.98 0.55 |
| 785.02 | 0.24 | 232.0 | 24.8 9.0 0.5 | 0.0640 | 0.8578 | 1.92 0.70 |
| 785.98 | 0.24 | 280.7 | 22.6 8.7 0.5 | 0.0640 | 0.8826 | 1.40 0.54 |
| 792.06 | 2.02 | 421.9 | 22.7 7.3 0.5 | 0.0640 | 0.9875 | 0.81 0.26 |
| 823.36 | 15.9 | 1658.6 | 33.4 15.6 0.7 | 0.0640 | 1.005 | 0.30 0.14 |
| 931.52 | 28.7 | 2273.1 | 36.7 14.9 0.7 | 0.0640 | 0.9319 | 0.25 0.10 |
| 992.14 | 10.4 | 907.2 | 25.8 10.9 0.5 | 0.0500 | 0.8480 | 0.54 0.23 |
| 1009.68 | 0.39 | 325.5 | 42.0 13.2 0.8 | 0.0500 | 0.7778 | 3.30 1.04 |
| 1015.64 | 0.39 | 374.7 | 209.9 21.9 4.2 | 0.0500 | 0.7325 | 15.07 1.74 |
| 1016.70 | 0.38 | 660.0 | 550.7 35.9 11.0 | 0.0500 | 0.7234 | 22.70 1.95 |
| 1017.66 | 0.38 | 1028.1 | 1383.3 54.1 27.7 | 0.0500 | 0.7182 | 37.14 2.42 |
| 1018.64 | 0.39 | 1080.9 | 1989.2 65.4 39.8 | 0.0500 | 0.7238 | 51.83 2.68 |
| 1019.62 | 0.42 | 1159.4 | 2357.6 72.6 47.2 | 0.0500 | 0.7544 | 55.63 2.46 |
| 1020.58 | 0.40 | 687.1 | 1144.3 49.3 22.9 | 0.0500 | 0.8136 | 40.87 2.54 |
| 1021.64 | 0.41 | 356.3 | 407.3 29.4 8.1 | 0.0500 | 0.9012 | 24.97 2.13 |
| 1022.78 | 0.39 | 386.9 | 237.9 24.3 4.8 | 0.0500 | 1.009 | 12.01 1.37 |
| 1027.76 | 0.40 | 392.2 | 86.9 14.5 1.7 | 0.0500 | 1.577 | 2.79 0.47 |
| 1036.96 | 3.00 | 777.5 | 52.1 12.2 1.0 | 0.0500 | 3.078 | 0.41 0.10 |
| 1055.64 | 4.94 | 1152.4 | 35.7 15.2 0.7 | 0.0500 | 9.139 | 0.064 0.027 |