Measurements of the cross sections for at 3.650, 3.6648, 3.773 GeV and the branching
fraction for
M. Ablikim1, J. Z. Bai1, Y. Ban11,
J. G. Bian1, X. Cai1, H. F. Chen15,
H. S. Chen1, H. X. Chen1, J. C. Chen1,
Jin Chen1, Y. B. Chen1, S. P. Chi2,
Y. P. Chu1, X. Z. Cui1, Y. S. Dai17,
Z. Y. Deng1, L. Y. Dong1a, Q. F. Dong14,
S. X. Du1, Z. Z. Du1, J. Fang1,
S. S. Fang2, C. D. Fu1, C. S. Gao1,
Y. N. Gao14, S. D. Gu1, Y. T. Gu4,
Y. N. Guo1, Y. Q. Guo1, K. L. He1,
M. He12, Y. K. Heng1, H. M. Hu1,
T. Hu1, X. P. Huang1, X. T. Huang12,
X. B. Ji1, X. S. Jiang1, J. B. Jiao12,
D. P. Jin1, S. Jin1, Yi Jin1,
Y. F. Lai1, G. Li2, H. B. Li1,
H. H. Li1, J. Li1, R. Y. Li1,
S. M. Li1, W. D. Li1, W. G. Li1,
X. L. Li8, X. Q. Li10, Y. L. Li4,
Y. F. Liang13, H. B. Liao6, C. X. Liu1,
F. Liu6, Fang Liu15, H. H. Liu1,
H. M. Liu1, J. Liu11, J. B. Liu1,
J. P. Liu16, R. G. Liu1, Z. A. Liu1,
F. Lu1, G. R. Lu5, H. J. Lu15,
J. G. Lu1, C. L. Luo9, F. C. Ma8,
H. L. Ma1, L. L. Ma1, Q. M. Ma1,
X. B. Ma5, Z. P. Mao1, X. H. Mo1,
J. Nie1, H. P. Peng15, N. D. Qi1,
H. Qin9, J. F. Qiu1, Z. Y. Ren1,
G. Rong1, L. Y. Shan1, L. Shang1,
D. L. Shen1, X. Y. Shen1, H. Y. Sheng1,
F. Shi1, X. Shi11b, H. S. Sun1,
J. F. Sun1, S. S. Sun1, Y. Z. Sun1,
Z. J. Sun1, Z. Q. Tan4, X. Tang1,
Y. R. Tian14, G. L. Tong1, D. Y. Wang1,
L. Wang1, L. S. Wang1, M. Wang1,
P. Wang1, P. L. Wang1, W. F. Wang1c,
Y. F. Wang1, Z. Wang1, Z. Y. Wang1,
Zhe Wang1, Zheng Wang2, C. L. Wei1,
D. H. Wei1, N. Wu1, X. M. Xia1,
X. X. Xie1, B. Xin8d, G. F. Xu1,
Y. Xu10, M. L. Yan15, F. Yang10,
H. X. Yang1, J. Yang15, Y. X. Yang3,
M. H. Ye2, Y. X. Ye15, Z. Y. Yi1,
G. W. Yu1, C. Z. Yuan1, J. M. Yuan1,
Y. Yuan1, S. L. Zang1, Y. Zeng7,
Yu Zeng1, B. X. Zhang1, B. Y. Zhang1,
C. C. Zhang1, D. H. Zhang1, H. Y. Zhang1,
J. W. Zhang1, J. Y. Zhang1, Q. J. Zhang1,
X. M. Zhang1, X. Y. Zhang12, Yiyun Zhang13,
Z. P. Zhang15, Z. Q. Zhang5, D. X. Zhao1,
J. W. Zhao1, M. G. Zhao1, P. P. Zhao1,
W. R. Zhao1, H. Q. Zheng11, J. P. Zheng1,
Z. P. Zheng1, L. Zhou1, N. F. Zhou1,
K. J. Zhu1, Q. M. Zhu1, Y. C. Zhu1,
Y. S. Zhu1, Yingchun Zhu1e, Z. A. Zhu1,
B. A. Zhuang1, X. A. Zhuang1, B. S. Zou1 (BES Collaboration)
1 Institute of High Energy Physics, Beijing 100049, People’s Republic
of China2 China Center for Advanced Science and Technology(CCAST), Beijing
100080,
People’s Republic of China3 Guangxi Normal University, Guilin 541004, People’s Republic of
China4 Guangxi University, Nanning 530004, People’s Republic of China5 Henan Normal University, Xinxiang 453002, People’s Republic of
China6 Huazhong Normal University, Wuhan 430079, People’s Republic of
China7 Hunan University, Changsha 410082, People’s Republic of China8 Liaoning University, Shenyang 110036, People’s Republic of China9 Nanjing Normal University, Nanjing 210097, People’s Republic of
China10 Nankai University, Tianjin 300071, People’s Republic of China11 Peking University, Beijing 100871, People’s Republic of China12 Shandong University, Jinan 250100, People’s Republic of China13 Sichuan University, Chengdu 610064, People’s Republic of China14 Tsinghua University, Beijing 100084, People’s Republic of China15 University of Science and Technology of China, Hefei 230026,
People’s Republic of China16 Wuhan University, Wuhan 430072, People’s Republic of China17 Zhejiang University, Hangzhou 310028, People’s Republic of Chinaa Current address: Iowa State University, Ames, IA 50011-3160, USAb Current address: Cornell University, Ithaca, NY 14853, USAc Current address: Laboratoire de l’Accélératear Linéaire,
Orsay, F-91898, Franced Current address: Purdue University, West Lafayette, IN 47907, USAe Current address: DESY, D-22607, Hamburg, Germany
Abstract
Using the BES-II detector at the BEPC Collider, we measured
the lowest order cross sections and the values
()
for inclusive hadronic event production
at the center-of-mass energies
of 3.650 GeV, 3.6648 GeV and 3.773 GeV.
The results lead to
which is the average of these measured
at 3.650 GeV and 3.6648 GeV,
and
at GeV.
We determined the lowest order cross section for production to be
at 3.773 GeV,
the branching fractions for decays to be
,
and
,
which result in the total non- branching fraction of decay to be
.
I Introduction
The established picture of hadron production
by annihilation in continuum region is that
the annihilation proceeds via quark-antiquark pair
production where the photon couples directly to the charge
of the pointlike quarks.
A consequence of this picture is that the total
lowest order cross section, ,
for inclusive hadron production in annihilation
must be proportional to the lowest order cross section,
,
for muon pair production, which results in the relation
(1)
where is the charge of the
i quark;
the factor of 3
accounts for three different colors of quarks;
the sum runs over all quark flavors, ,
involved, for which the quark pair production thresholds are below the
annihilation energy.
The Eq. (1) indicates the ratio
(2)
to be constant as long as the c.m. (center-of-mass) energy
does not overlap with resonances
or the threshold of the production of new quark flavors.
It also indicates that the value
for continuum light hadron (containing u, d and s quarks) production
should tend to be constant in the energy region above 2 GeV.
This naive theoretical prediction for the value has to be modified to
take into account the finite mass of the quarks and the emission
of the gluons by the quarks.
In principle, the values can be computed in the pQCD (perturbative QCD)
with these corrections.
So precise measurements of values at low energy region
are important for the test of
the prediction by the pQCD in this energy region.
Moreover the values at all energies are needed
to calculate the effects of vacuum polarization on the parameters
of the Standard Model.
For example,
the dominant uncertainties in the quantities ,
the QED running coupling constant
evaluated at the mass of ,
and , the anomalous magnetic moment of the muon,
are due to the calculation of hadronic vacuum polarizationdavier .
A large part of uncertainty in the calculation
arises from the uncertainties in the measured inclusive hadronic
cross sections in open charm threshold region, in which many resonances
overlap. To get credible measurements of
and various lowest order cross sections in this region,
the overlapping effects have to be clarified clearly.
On the other hand, the measurements of the values
below and above the threshold of production
can be used to determine the branching fractions for
,
and for
with the measured cross sections for the and
together.
The resonance is believed to decay predominantly into
Bacino .
However, there are discrepancies between the measurements of the
cross section and the measurements of cross section which
can be obtained from resonance parameters.
In recent days, there are some
publications to report the observation of decays
of
resonance bes_non_ddbar1 bes_non_ddbar2 cleo .
In this Letter, we present
more precise measurements of the values
at the c.m. energies of 3.650, 3.6648 and 3.773 GeV.
With the measured values and the previously measured cross sections
for production at 3.773 GeV xsct_ddbar_bes ,
we determine the branching fractions
for ,
and for
II BES-II Detector
The BES-II is a conventional cylindrical magnetic detector that is
described in detail in Ref. BES-II . A 12-layer Vertex Chamber
(VC) surrounding the beryllium beam pipe provides input to the event
trigger, as well as coordinate information. A forty-layer main drift
chamber (MDC) located just outside the VC yields precise measurements
of charged particle trajectories with a solid angle coverage of
of ; it also provides ionization energy loss ()
measurements which are used for particle identification. Momentum
resolution of ( in GeV/c) and
resolution of for Bhabha scattering electrons are obtained for
the data taken at GeV. An array of 48 scintillation
counters surrounding the MDC measures the time of flight (TOF) of
charged particles with a resolution of about 180 ps for electrons.
Outside the TOF, a 12 radiation length, lead-gas barrel shower counter
(BSC), operating in limited streamer mode, measures the energies of
electrons and photons over of the total solid angle with an
energy resolution of ( in GeV) and spatial
resolutions of
mrad and cm for
electrons. A solenoidal magnet outside the BSC provides a 0.4 T
magnetic field in the central tracking region of the detector. Three
double-layer muon counters instrument the magnet flux return and serve
to identify muons with momentum greater than 500 MeV/c. They cover
of the total solid angle.
III Measurement of the observed hadronic cross sections
For a sample of data taken at c.m. energy ,
the observed cross section for the inclusive hadronic event production
is obtained by
(3)
where is the i
energy point at which the data were collected,
is
the number of the inclusive hadronic events
observed at this energy;
is the integrated luminosity
of the data collected;
is the efficiency for detection
of the inclusive hadronic events, and
is the trigger efficiency
for collecting the hadronic events in on-line data acquisition.
III.1 Measurement of luminosity
The integrated luminosities of the data sets are determined by
(4)
where and are the number of the selected
Bhabha events and
the number of background events respectively,
is the efficiency for detection of the
Bhabha events,
is the trigger efficiency
for collecting the Bhabha events in on-line data acquisition.
For the data used in the analysis, the trigger efficiency is
(see subsection D).
To select the candidates for Bhabha scattering
, it is first
required that exactly two
charged tracks with total charge zero be well reconstructed. For each track,
the point of the closest approach to the beam line must have
the
and where is measured
along the beam line from the nominal beam crossing point.
Furthermore, each track is required to
satisfy , where is the polar angle
of the charged track, to ensure that it is contained within the barrel
region of the detector. Next, it is required that the energy deposited for
each charged track in BSC
be greater than 1.1 GeV (i.e. GeV)
and at least the magnitude of one charged
track momentum be greater than ,
where is the beam energy.
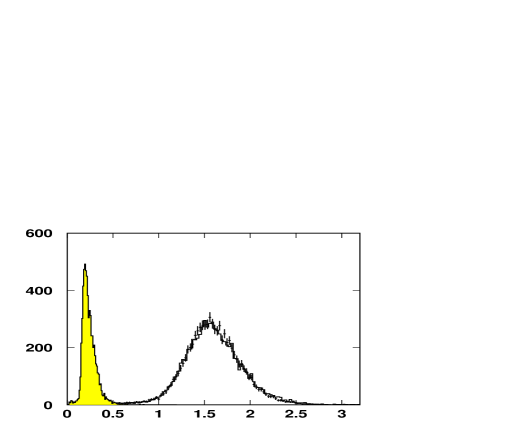
Figure 1 shows the
distribution of the energies deposited for muons (hatched histogram) and
electrons or positrons (points with error bars) in the BSC,
where the data sample of the muons and the
electrons or positrons are selected from the decays of
,
and .
From Fig. 1 one can see
that the criterion GeV separates the
from the Bhabha scattering
effectively.
In addition, because the Monte Carlo simulation does not
model the energy deposited well in the rib regions of the BSC,
any charged track from the selected Bhabha events is required
to hit one of the four regions of the BSC (selected regions in BSC):
(1) m,
(2) m,
(3) m,
(4) m.
The two oppositely charged tracks go in opposite directions
in the plane.
Because the tracks are bent in the magnetic field, the positions of the two shower
clusters
in the plane of the BSC are deviated from the back-to-back directions.
We define the angle difference of the two clusters by
in degrees, where the and
are the azimuthal angles of the two clusters in the BSC. Figure 2
shows the distribution for the events
which satisfy the selection criteria for the Bhabha events.
These events are from a portion of the data taken at 3.773 GeV.
Using a double Gaussian function
plus a second order polynomial to fit the distribution,
we obtain the number of the candidates for .
The accepted candidate events are examined
for background contaminations by visual scan.
The detailed scans for the accepted
events
show that about of the accepted events are due to background
contamination. After subtracting the background,
the pure number of events is retained.
The detection efficiency for the Bhabha scattering
is determined by analyzing the Monte Carlo events of
. These events are generated
with the
radiative Bhabha generator kleiss_radee
written by R. Kleiss et al.,
which includes hard photon emission and
radiative correction.
Using the pure number selected,
the visible cross section read from the generator,
the detection efficiency for
obtained by Monte Carlo simulation, and the trigger efficiency,
we can determine the integrated luminosity of the data from Eq. (4).
Applying the procedure to the data sets taken at the three
energy points, we get the measured
integrated luminosities
of the data sets.
The second column of table 1 lists the
integrated luminosities of the data sets, where the errors
are combined from statistical and systematic errors.
The systematic uncertainty in the measured values of the luminosities
arises mainly from the difference between the data and Monte Carlo
simulation.
Table 2 summarizes the systematic uncertainties
due to the event selection criteria.
The total uncertainty in the measured luminosity is estimated to be
about .
Figure 1: The distribution of energies deposited for muons (hatched histogram) and
electrons or positrons (points with error bars) in BSC,
where the sample of the muons and the
electrons or positrons is from the decays of
,
and ; the open histogram is
for the electrons or positrons from the Monte Carlo events of
, and .
Figure 2: The distribution of the
() of the
selected and tracks.
Table 1: Summary of the luminosities of the data sets,
the numbers of the selected candidates for
and
the estimated numbers of the events
of the processes
(),
and
which were misidentified as the events of
.
L
(GeV)
[]
3.650
2038
219
3.6648
19.2
382
40
3.773
8603
701
Table 2: The relative systematic uncertainties in the measured luminosity
due to the event selection criteria.
Criterion
[]
Selected regions in BSC
Total uncertainty in Bhabha event
III.2 Selection of hadronic events
In order to effectively remove the and
events from the selected hadronic
event sample, the hadronic events are required to have more than 2 good
charged tracks,
each of which is required to satisfy the following selection criteria:
•
the charged track must be with
a good helix fit and the number of hits per charged
track is required to be greater than 14;
•
the point of the closest approach to the beam line must have
radius cm;
•
, where is the polar angle
of the charged track;
•
, where is
the charged track momentum and is the beam energy in GeV;
•
, where
is the time-of-flight of the charged particle, and
is the expected time-of-flight of proton with
the given momentum;
•
the charged track must not be identified as a muon;
•
for the charged track, the energy deposited in BSC should be
less than 1.0 GeV.
In addition, the total energy deposited in BSC should be
greater than of the beam energy.
Furthermore, the selected tracks must not all point into the same hemisphere
in the direction.
No criterion for the number of the observed photons is
applied to the selected hadronic events.
Some beam-gas associated background events can also
satisfy above selection criteria.
However, the beam-gas associated background events
are produced at random positions, while the hadronic
events are produced around .
This characteristic can be used to distinguish the hadronic events from
the beam-gas associated background events.
To this end, the averaged
of the charged tracks in each event is calculated.
Figure 3
shows the distribution of the averaged .
These events are from a portion of the data taken at 3.773 GeV.
In Fig. 3, the points with
error bars
show the events from the Monte Carlo sample
which is generated with the generator zhangdh_gen
described in Section III.C
and simulated with the GEANT3-based Monte Carlo package bes2_mcpck ,
the histogram
shows the events from the data, and the shadowed histogram
shows the events from the separated beam data.
Using a Gaussian function plus a second
order polynomial to fit the averaged distribution of the events,
we obtain the number, , of the candidates for hadronic
events.
The third column of table 1 lists
obtained from the data sets
taken at each of the energy points, where the errors
are combined from statistical and systematic errors.
This number of candidates contains some contaminations
from some background events
such as ,
,
and two-photon exchange processes. The number of the background events
can be estimated by means of Monte Carlo simulation (see Section III.E).
The systematic uncertainty in measuring the produced hadronic events
due to the hadronic event selection criteria is estimated to be about .
Table 3 summarizes the relative systematic uncertainties
in
selecting
the produced hadronic events.
Table 3: The relative systematic uncertainties
in measuring the produced hadronic events
due to the event selection.
Criterion
[]
0.04
Same hemisphere cut
Fitting to averaged Z distribution
Total uncertainty
Figure 3: The distribution of the averaged of the charged tracks
which satisfy the hadronic event selection criteria,
where points with error bars show the events from the Monte Carlo sample,
the histogram shows the events from the data,
and the shadowed histogram shows the events from the separated beam data;
the curves give the best fit to the distribution.
III.3 Monte Carlo method and the efficiency
Due to ISR (Initial State Radiation),
the effective c.m. energy
for the annihilation is ,
where
is the total energy
of the emitted photons and is the nominal c.m. energy.
For a certain energy point in experiment,
the experimentally observed hadronic events are not only produced
at the , but produced in the full energy range
from the to GeV (for production of two pions).
To determine the efficiency for detection of hadronic events produced in the
full energy range, we developed a special Monte Carlo
generator zhangdh_gen
in which the initial state radiative correction to order
is taken into account.
Figure 4 shows the differential cross section
for the inclusive hadronic event production
when setting
the nominal c.m. energy to be at 3.80 GeV.
At an effective c.m. energy,
the final hadronic states are produced by calling the sub-generators
such as LUND model lund besii_r ,
and the resonance generators including , ,
cjcpaper , , ,
and etc.
according to the corresponding lowest order cross
sections of these processes, respectively.
The CMD-2 production data akhmetshin
with Gounaris-Sakurai parameterization gounaris
are used to simulate the spectrum of
and the - mixing
in the energy range below 1.2 GeV.
The resonances are set to decay into all
possible final states according to the known decay modes
and branching fractions.
These generated events are simulated with
the GEANT3-based Monte Carlo simulation package.
The reconstructed Monte Carlo events
are then fed into the analysis program to determine the efficiencies,
, for
measurements of the observed cross
sections for inclusive hadronic event production
at each of the three energy points.
For simulations of the inclusive hadron production,
parameters in the LUND generator are tuned using an inclusive hadronic event sample
of events from the data taken at 3.65 GeV with the BES-II
detector. The parameters are adjusted to reproduce
good agreeable distributions of some main kinematic variables between data
and Monte Carlo sample. The uncertainty in
due to the adjusted parameters is estimated
to be ,
while the uncertainties due to the errors of
the and resonance parameters are estimated
to be and , respectively.
Combining these uncertainties in quadrature
yields the systematic uncertainty in the efficiency
to be about .
The second column
of table 4 lists the efficiencies
for detection of the inclusive hadronic events
at three energy points
in the case of setting the continuum value
to be at 2.26 (see section IV).
Table 4: Summary of the efficiencies for detection of the inclusive
hadronic events and the observed cross sections for
at three energy points, where the error in
is statistical only; while the errors in
are statistical and point-to-point systematic,
respectively.
(GeV)
(nb)
3.650
3.6648
3.773
Figure 4: The differential cross section for the inclusive hadronic event
production when setting
the nominal c.m. energy to be at 3.80 GeV;
the histogram shows the resonances and continuum hadronic event production;
the dashed line shows the cross sections for pair production.
III.4 Trigger efficiency
The requirements of the trigger for recording the data on-line
are almost the same as those used in collecting the data for
the work bes2_r_prl88_y2002_p130 and
the work besii_psip_rsnc .
However, for the data acquisition, we slightly modified
the trigger requirements for the charged tracks, which results
in a little bit improvement in recording the two charged trak events.
The trigger efficiencies are obtained by comparing the responses to different
trigger requirements in the data taken at 3.097 GeV
during the time period taking the data at GeV.
The trigger efficiencies are measured to be
for both the and
events, with an uncertainty of
.
III.5 Observed hadronic event cross sections
The observed cross section for inclusive hadronic
event production can be obtained from Eq. (3) substituting
with ,
where is the number of the background events,
such as ,
,
and
two-photon exchange processes.
The number of the background events can be estimated by
using the theoretical cross sections of these processes,
the rates of misidentifying these processes as hadronic events
and the total integrated luminosities of the data sets, which is given by
(5)
where , ,
and
are the cross sections for
,
,
, and
processes, respectively; while
,
,
, and
are the corresponding misidentification rates.
In the calculation of the cross section,
we consider the contributions from
decay,
the QED production and their interference;
we also consider the effects of the initial and final state radiative
corrections and Coulomb interaction on
the cross section bestau .
For kleiss_radee ,
mark_radmumu and
two-photon processes
two_photon_berends ,
the cross sections are read from respective generator outputs.
As for the estimate of the total cross section for
, we employ the equivalent photon
approximation formalisms to deal with the - collision
sub-process Brodsky Morgan .
In the sub-process, the energy dependence of the total hadronic
cross section can be described well by the formula of Donnachie-Landshoff
parameterization Donnachie above the three pion threshold.
For the contribution
in the low energy region below the three pion threshold, it is good enough to use
the simple point-like production cross section in the
calculation Brodsky .
The rates of misidentifying the above processes as the hadronic events
are obtained from Monte Carlo simulation with the generators mentioned
above. For the two-photon process
,
we use the Monte Calro generator described in two_photon_berends
to simulate the process and determine
the rates of misidentifying the processes as the hadronic events.
The fourth and fifth columns of Table 1 give
the estimated numbers (, and )
of the background events from
the and the two-photon exchange processes,
which are misidentified as
the inclusive hadronic events.
Inserting , , ,
and
in Eq. (3), we obtain the observed cross sections
for the inclusive hadronic event production
at each of the three energy points,
which are summarized in table 4,
where the first error is statistical and second
point-to-point systematic error arising from the uncertainty in
(),
uncertainty in ())
and uncertainty in (). The common systematic
uncertainty is not included yet.
IV Lowest order cross section
IV.1 Radiative corrections
To get the lowest order cross section for the inclusive hadronic event
production in annihilation, the observed cross section has to be
corrected for the radiative effects including the initial state
radiative corrections and the vacuum polarization corrections.
The correction factor, , is given by
(6)
where is the expected cross section
and lowest order cross section
for the inclusive hadronic event production.
The expected cross section for hadronic event production
can be written as
(7)
where is the total lowest order cross section
in the energy range from 0.28 GeV to
(or from 3.729 GeV to in the case of considering the
production),
is a sampling function and
is the correction factor for the
effects of vacuum polarization
including both the leptonic and hadronic terms
in QED Kuraev , with
(8)
the effects of hadronic vacuum polarization can be
calculated via the dispersion integral berends
(9)
while
(10)
(11)
(12)
(13)
with , where is the lepton mass.
In the structure function approach by
Kuraev and Fadin Kuraev ,
(14)
where is the electron equivalent radiator thickness,
(15)
(16)
(17)
(18)
(19)
In above expressions, is the mass of electron and
is the fine structure constant.
For the resonances, such as
, , and ,
we use the Breit-Wigner formula
(20)
to calculate the lowest order cross section,
where and are the mass and the total width of the resonance,
and
and
are the partial widths
to the channel and to the inclusive hadronic final
state, respectively.
For the resonance, we use
(21)
to calculate the lowest order cross section,
where
is chosen to be energy dependent
and normalized to the total width
at the peak of the resonance.
The is defined as
(22)
where , and
are the partial widths for
,
and
, respectively,
which are taken in the form
and
(25)
where and are the momenta
of the mesons produced at the
peak of and
at the c.m. energy , respectively;
is the total width of
the at the peak,
and is the interaction radius of the ,
which is set to be 1.0 fm;
and are the branching fractions for
and
, respectively;
and
are the step
functions to account for the thresholds of the production.
In the calculation of the lowest order cross section, the
resonance parameters MeV, MeV
and keV
measured by BES Collaboration bes_psipp_prmt
are used.
Inserting the resonance parameters of ,
quoted from
PDG pdg04 and the
xsct_ddbar_bes bes2_r_prl88_y2002_p130
for the light hadron production
in the energy range from 2.0 to 3.0 GeV
measured by
BES Collaboration
in Eqs. (6)–(25), we obtain the radiative correction
factors at the three energy points,
which are summarized in table 5.
In determination of the value of , the input of value
in calculating the cross section for continuum hadronic event production
affects the value of . Varying the input
by causes a variation of in ,
which results in a variation of the product
by only .
The most uncontrolled cross sections in the calculation of
come from the hadronic cross sections in the energy range
from 1.2 to 2.0 GeV. However, the whole contribution
of the cross section from this energy range is less than
of the total observed cross section in our case. Since
the efficiency is quite low for detection of the hadronic events
from this energy range , the amount of the product
would also be rather stable with error less
than .
Taking into account the uncertainty in
the measured
hadronic event production and
the errors of the resonance parameters together,
the total uncertainty in measurement due to
the calculation of
is then estimated to be less than in this work.
IV.2 Lowest order cross sections and values
The lowest order cross section for inclusive hadronic event production
is obtained by
(26)
where
(27)
in which is
the cross section for inclusive hadronic event production
through one photon annihilation,
is the cross section for
the i resonance, such as , ,
etc. which decays into hadronic final states.
To obtain the lowest order cross section
for the hadronic event production through one photon annihilation
at the energies of 3.650 and 3.6648 GeV,
and the lowest order cross section
for both one photon annihilation and
production at 3.773 GeV,
the amount of the cross section due to the resonance production at
the energies of 3.650 and 3.6648 GeV, and
the amount of the cross section due to the resonance production but
at 3.773 GeV have to be subtracted out.
The third column of table 5 summarizes
the lowest order cross sections .
Dividing the by the lowest order
cross section for production at the same
c.m. energy, we obtain the values,
which are summarized in the fourth column of the table.
The first error in the measured lowest order cross section and the
value listed in table 5
is statistical, the second is the point-to-point
systematic and the third is common systematic error.
The common systematic error arises from the uncertainty in
luminosity (),
in selection of hadronic event (),
in Monte Carlo Modeling
(),
in radiative correction ()
for the measured cross sections
and values at the three energy points,
and the uncertainty in resonance
parameters ()
for those at 3.773 GeV only.
Adding these uncertainties in quadrature yields the total systematic
uncertainties to be and
for the measured hadronic cross sections and values
for the data taken below the threshold
and at 3.773 GeV, respectively.
Averaging the values measured at the first two
energy points (3.650 and 3.6648 GeV)
by weighting the combined statistical and point-to-point
systematic errors, we obtain
where the first error is combined from statistical and
point-to-point systematic errors, and the second is common systematic.
This
excludes the contribution from resonances and
reflects the lowest order cross section
for the inclusive light hadronic event
production through one photon annihilation of .
So it can be directly compared with those calculated based on the pQCD.
The value is consistent with
obtained by fitting those besii_r
measured in the energy region between 2.0 and 3.0 GeV xsct_ddbar_bes
and with
obtained from fitting to the
inclusive hadronic cross sections for both the
and resonances in the
energy region from 3.666 to 3.897 GeV bes_psipp_prmt .
Table 5: Summary of the radiative correction factors, the lowest order cross
sections and the values measured at three energy points.
Energy
(GeV)
(nb)
3.6500
3.6648
3.7730
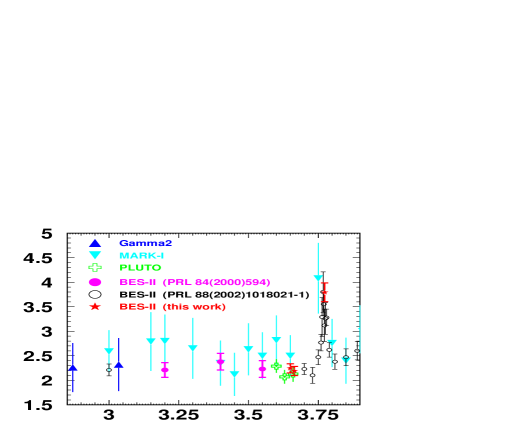
Figure 5 displays the values of from this measurement
and previous measurements by
BES Collaboration besii_r bes2_r_prl88_y2002_p130 ,
MARK-I Collaboration mark_i_r ,
Collaboration gamma2
and PLUTO Collaboration pluto_r in the energy region between
2.85 and 3.90 GeV. The error bars shown in the figure are obtained
by combining statistical and systematic errors in quadrature.
Figure 5: The values of measured by BES Collaboration, MARK-I
Collaboration, Collaboration and PLUTO Collaboration
in the energy region between
2.85 and 3.90 GeV, where the error bars show the combined statistical
and systematic errors in quadrature.
Using the measured value at 3.773 GeV listed in table 5
and the value for light hadron production
measured
below the threshold
we obtain the due to decays to be
(28)
where the first error is combined from statistical and point-to-point
systematic error and the second common systematic. In
estimation of the systematic uncertainty,
we assumed that the same amount of the systematic uncertainties
in the measured values of the and the is canceled
in subtracting the from the .
The corresponding lowest order cross section for production is
(29)
V Branching fractions for the decays and for
Assuming that there are no other new structure and effects
except the resonance and the continuum hadron
production in the energy region
from 3.70 GeV to 3.86 GeV,
the branching fraction for can be
determined by
(30)
where and
are the observed and lowest order
production cross sections for and inclusive hadronic events,
respectively; is the radiative correction factor
for production.
Inserting the resonance
parameters ( MeV;
MeV and
keV)
measured by BES Collaboration bes_psipp_prmt in Eqs. (6) and (7)
with combining the Eqs. (7)-(25) together,
we obtain the radiative correction factor
(31)
where the error is the uncertainty arising from the errors of the
resonance parameters, the uncertainty
in vacuum polarization correction and the uncertainty arising from
varying the branching fraction for from
to .
BES Collaboration measured the observed cross sections for
and production at c.m. energy GeV to be
nb and
nb xsct_ddbar_bes .
These observed cross sections
were obtained by analyzing the same data set
from which the
value at GeV is measured.
Inserting the , the observed cross sections
for , , production at 3.773 GeV
and the radiative correction factor, , in Eq. (30),
we obtain the branching fractions for the decays
to be
(32)
(33)
and
(34)
which results in the non- branching fraction of to be
(35)
where the first error is statistical and the second systematic arising
from uncanceled systematic uncertainties. The uncanceled relative
systematic uncertainties are
, and for the
,
and the , respectively.
The systematic error also includes the
common uncertainty of
arising from the statistical uncertainty
in the measured lowest order cross section for production and
the uncertainty () in radiative correction factor
.
Table 6 summarizes sources of the uncanceled systematic
uncertainties for the measured
and .
The uncertainties in luminosity (), in resonance
parameters () and in radiative correction () are
canceled out in the estimation of the systematic uncertainty in the
measured branching fractions.
Table 6: Sources of the uncanceled systematic uncertainties in the measured
cross sections for and production,
where upper N and upper C mean the uncertainties for
the neutral mode and
the charged mode , respectively;
for the uncertainties in the measured cross
section for production,
please refer to the reference xsct_ddbar_bes ;
we here re-estimate the uncertainty in the combined tracking and kinematic
fit in selection of events to be .
Source
Source
[]
[]
Particle ID
Monte Carlo Modeling
Tracking K.F.
Hadron selection
F. P.
MC Statistics
Br for
(Br for )
()
Total
N
Total
() C
VI Discussion about interference effects
The measured values discussed in above sections are obtained based on
the same treatment
on the measurements of inclusive hadronic cross sections
in which no interference between the inclusive hadronic
final states of the resonance decays and the inclusive hadronic final states
from non-resonance annihilation of
is taken into
account besii_r bes2_r_prl88_y2002_p130 r_and_prmts_no_intf .
However,
since the c.m. energies of 3.650 GeV, 3.6648 GeV and 3.773 GeV are close to
the resonance, there may be interference effects
between the final hadronic states from the
electromagnetic decays
and the continuum hadron production in annihilation of .
These interference effects distort the line shape of the
continuum hadron production cross section around the
peak.
With the definition of the given in Eq. (2), we can estimate the
destructive/constructive amount
of the cross section due to the interference effects,
which is given by
(36)
The destructive/constructive amounts of the cross sections given in
are estimated to be
, and
at 3.650 GeV, 3.6648 GeV and 3.773 GeV, respectively.
After correcting the cross section for
the destructive/constructive amounts due to the interference effects,
we obtained the lowest order cross section .
The third column of table 7 summarizes the
.
In the case of considering the interference effects,
the correction factor is also changed.
The second column of table 7 lists
the correction factor at the c.m. energies.
Dividing the by the lowest order
cross section for production at the same
c.m. energy, we obtain the values,
which are summarized in the fourth column of the table.
The errors are statistical, the point-to-point
systematic and the common systematic as discussed before.
Table 7: Summary of the radiative correction factors, the lowest order cross
sections and the values measured at three energy points, where
the interference effects between the
electromagnetic decays
and hadron production through
non-resonant annihilation of
are taken into account.
Energy
(GeV)
(nb)
3.6500
3.6648
3.7730
The weighted average of the values measured at the first two
energy points is
where the first error is combined from statistical and point-to-point
systematic errors, and the second is common systematic.
Following the same procedure as discussed in Sections IV and Section V,
we obtained the lowest order cross section for production
to be
(37)
and the branching fractions for decays to be
(38)
(39)
(40)
and
(41)
where the errors are statistical and the systematic arising
from some uncanceled systematic uncertainties.
VII Summary
From the analysis of the data taken at 3.650, 3.6648 and 3.773 GeV in
annihilation, we
measured the values at the energy points,
which are at 3.773 GeV and
at
below the threshold.
Based on the measured values,
we determined the lowest order cross section for production
at 3.773 GeV to be
,
the branching fractions
for decays to be
,
and
,
which result in the non- branching fraction of to be
.
These branching fractions for decays are measured for the first
time.
ACKNOWLEDGEMENTS
The BES collaboration thanks the staff of BEPC for their hard efforts.
This work is supported in part by the National Natural Science Foundation
of China under contracts
Nos. 19991480,10225524,10225525, the Chinese Academy
of Sciences under contract No. KJ 95T-03, the 100 Talents Program of CAS
under Contract Nos. U-11, U-24, U-25, and the Knowledge Innovation Project
of CAS under Contract Nos. U-602, U-34(IHEP); by the
National Natural Science
Foundation of China under Contract No.10175060(USTC),and
No.10225522(Tsinghua University).
References
(1) N. Cabibbo, R. Gatto, Phys. Rev. 124 (1961) 1577;
H. Burkhardt, F. Jegerlehner, G. Penso, C. Verzegnassi,
Z. Phys. C 43 (1989) 497;
G. Altarelli, CERN-TH73194/94;
A.D. Martin, D. Zeppenfeld, Phys. Lett. B 345 (1995) 558;
M. Davier, S Eidelman, A. Hocker, Z. Zhang, Eur. Phys. J.
C 27 (2003)497.
(2) W. Bacino et al. (DELCO Collaboration),
Phys. Rev. Lett. 40 (1978) 671.
(3) J.Z. Bai et al. (BES Collaboration),
HEPNP 28 (2004) 325.
(4) J.Z. Bai et al. (BES Collaboration),
Phys. Lett. B 605 (2005) 63.
(5) N.E. Adam et al. (CLEO Collaboration),
Phys. Rev. Lett. 96 (2006) 082004;
T.E. Coan et al. (CLEO Collaboration),
Phys. Rev. Lett. 96 (2006) 182002
(6) J.Z. Bai et al. (BES Collaboration),
Phys. Lett. B 603 (2004) 130.
(7) J.Z. Bai et al. (BES Collaboration),
Nucl. Instrum. Methods A 458 (2001) 627.
(8) The generator was written by
R. Kleiss et al.. based on:
F.A. Berends, et al, Nucl. Phys. B 228 (1983) 537
(9) D. Zhang, G. Rong and J.C. Chen, arXiv:hep-ph/0604264.
(10) M. Ablikim et al. (BES Collaboration),
Nucl. Instr. and Meth. A. 552 (2005) 344,
arXiv:physics/0503001.
(11) T. Sjostrand, Comput. Phys. Commun., 82 (1994) 74.
(12) J.Z. Bai et al. (BES Collaboration),
Phys. Rev. Lett. 84 (2000) 594.
(13) J.C. Chen et al.,
Phys. Rev. D 62 (2000) 034003.
(14) R.R. Akhmetshin, et al.,
(CMD-2 Collaboration), Phys. Lett. B 578 (2004) 285.
(15) G. Gounaris and J.Sakurai,
Phys. Rev. Lett. 21 (1968) 244.
(16) J.Z. Bai et al. (BES Collaboration),
Phys. Rev. Lett. 88 (2002) 101802.
(17) J.Z. Bai et al. (BES Collaboration),
Phys. Lett. B 550 (2002) 24.
(18) J.Z. Bai, et al. (BES Collaboration),
Phys. Rev. D 53 (1996) 20.
(19) The generator was written by S. Van der Mark based
on:
F.A. Berends et al., Nucl. Phys. B 57
(1973) 381.
(20) F.A. Berends, P.H. Daverveldt and R. Kleiss,
Comput. Phys. Commun., 40 (1986) 285.
(21) S.J. Brodsky, T. Kinoshita and H. Terazawa, Phys. Rev.
D 4 (1971) 1532.
(22) D. Morgan, M.R. Pennington and M.R. Whalley,
J. Phys. G20 Suppl. 8A (1994) A1.
(23) A. Donnachie and P.V. Landshoff,
Phys. Lett. B 296 (1992) 227.
(24) E. A. Kuraev and V. S. Fadin, Yad Fiz.
41, 733 (1985); [Sov. J. Nucl. Phys. 41 (1985) 466].
(25) F.A. Berends and G.J. Komen, Phys. Lett.
B 63 (1976) 432;
A.B. Arbuzov, E.A. Kuraev et al.,
JHEP10 (1997) 006.
(26) S. Eidelman et al. (Particle Data Group),
Phys. Lett. B 592 (2004) 1.
(27) J.L. Siegrist, et al. (MARK-I Collaboration),
Phys. Rev. D 26 (1982) 969.
(28) C. Bacci, et al. ( Collaboration),
Phys. Lett. B 86 (1979) 234.
(29) L. Criegee and G. Knies, Phys. Rep. 83 (1982) 151;
J. Burmester et al. (PLUTO Collaboration),
Phys. Lett. B 66 (1977) 395.
(30) M. Ablikim et al. (BES Collaboration),
Contribution paper to Lepton Photon 2005 (LP05-452);
Gang RONG (for BES Collaboration), Proceedings of the
32nd International Conference on High Energy Physics,
Beijing, China, 16-22 August 2004.
(31) A.M. Boyarski et al. (MARK-I Collaboration),
Phys. Rev. Lett. 34 (1975) 1357;
V. Luth et al. (MARK-I Collaboration),
Phys. Rev. Lett. 35 (1975) 1124;
J.Z. Bai et al. (BES Collaboration),
Phys. Lett. B 355 (1995) 374;
J.Z. Bai et al. (BES Collaboration),
Phys. Lett. B 550 (2004) 24.