Affiliated with: ]Univ. of Victoria, Victoria, BC.
Affiliated with: ]Kurchatov Institute, Moscow, Russia.
Present address: ]LBNL, Berkeley, CA.
Deceased.]
Present address: ]Arkansas Tech University, Russellville, AR.
Affiliated with: ]Univ. of Victoria, Victoria, BC.
Present address: ]Univ. of Manitoba, Winnipeg, MB.
Present address: ]VSM Medtech Ltd., Coquitlam, BC.
Deceased.]
Affiliated with: ]Univ. of Saskatchewan, Saskatoon, SK.
TWIST Collaboration
Measurement of in Polarized Muon Decay
Abstract
The quantity , where is one of the muon decay parameters and is the degree of muon polarization in pion decay, has been measured. The value was obtained. This result agrees with previous measurements but is over a factor of two more precise. It also agrees with the Standard Model prediction for and thus leads to restrictions on left-right symmetric models.
pacs:
13.35.Bv, 14.60.Ef, 12.60.CnI I. Introduction
In the Standard Model (SM) of particle physics, positive muons decay via the weak () interaction into positrons plus neutrinos: through a virtual state involving vector bosons. More generally, the amplitude for muon decay can be described in terms of a local decay matrix element, which is invariant under Lorentz transformations:
| (1) |
where the specify the scalar, vector, and tensor couplings between -handed muons and -handed positrons Fetscher . In the SM = 1, and all other coupling constants are zero.
The differential decay spectrum Michel of the emitted in the decay of a polarized can be described by four parameters – , , and – commonly referred to as the Michel parameters, which are bilinear combinations of the coupling constants. In the limit where the positron and neutrino masses are neglected, and radiative corrections Arbuzov are not explicitly included, this spectrum is given by:
| (2) |
where is the angle between the muon polarization and the outgoing positron direction, , MeV, and is the degree of muon polarization. The fourth parameter, , appears in the isotropic term when the positron mass is included in the analysis. In the SM, the Michel parameters take on the precise values , , and . The parameter expresses the level of parity violation in muon decay, while parametrizes its momentum dependence.
In this experiment is the magnitude of the polarization along the beam axis at the time of muon decay. Surface Pifer , which are muons produced from decays at rest, have a polarization of magnitude , with a direction antiparallel to their momentum, given by a generalization of Eq. 1 for semileptonic decays. In the SM with massless neutrinos . In this experiment is determined from the positron spectrum, and then is obtained using the measurements of the muon trajectories.
SM extensions involving right-handed interactions Herczeg require deviations from pure coupling that can alter . Four probabilities for the decay of a -handed muon into an -handed positron are given by:
| (3) |
where for and for . The probability:
| (4) | |||||
sets a model independent limit on any muon right-handed couplings Fetscher ; PDG . A recent review of muon decay is presented in Kuno .
A precision measurement of muon decay can place limits on left-right symmetric (LRS) models Herczeg . The LRS models contain four charged gauge bosons (, ), the photon, and two additional massive neutral gauge bosons. The and masses are and respectively, and the fields and are related to the mass eigenstates and through a mixing angle . In these models both and couplings are present, and parity violation appears because of the difference in the mass of the vector bosons. In the SM the weak interaction contains only two left handed vector bosons, .
In the general LRS model Herczeg ,
| (5) |
where and are the right- and left-handed gauge couplings. The manifest left-right symmetric model makes the additional assumptions that and that the left- and right-handed quark mixing matrices are identical. In this case, can also be expressed in terms of and , and one obtains Herczeg :
| (6) |
Prior to TWIST, the most precise direct measurement of was (stat.) (syst.) Beltrami , in agreement with the SM. A similar value has been measured using muons from kaon decay Imazato . Recently the TWIST collaboration reported new measurements of (stat.) (syst.) () Musser and (stat.) (syst.) Gaponenko . Using the result , at the confidence level Jodidio , along with the TWIST measurements of and , an indirect limit on was determined to be ( confidence level) Gaponenko . In this paper a new measurement of is reported.
II II. Experimental Procedures
In the present experiment, highly polarized surface muons Pifer were delivered, in vacuum, to the TWIST spectrometer Henderson by the M13 channel at TRIUMF Oram . The properties of the surface muon beam are a typical rate of 2.5 kHz, a momentum of 29.6 MeV/c, and a momentum bite, FWHM. Beam positrons with a typical rate of 22 kHz, and the same momentum as the muons are also a feature of the surface muon beam.
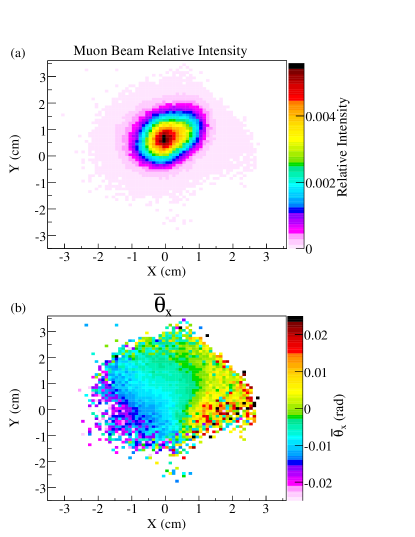
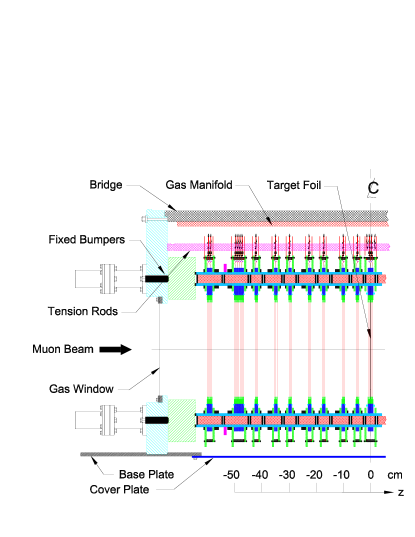
A low pressure (8 kPa dimethyl ether gas) removable beam monitoring chamber Sheffer provides information on the muon beam before it traverses the fringe field of the solenoid. The chamber consists of two 4 cm long modules, one to measure the position and direction of the muon beam in the horizontal () direction, and the other for measurements in the vertical () direction. The location of the final quadrupole of the M13 channel, the beam monitor, muon ranging gas degrader, trigger scintillator and the TWIST detector are shown in Fig. 1. The beam monitor is inserted for measurement of the beam properties, and removed during data collection.

Changing the angle of the muon beam relative to the magnetic field axis gives rise to a change in the polarization. The solenoid field is found to interact with the iron of the beamline magnets, such that the muon beam is deflected off axis. The available M13 channel magnets could only partially alleviate this deflection. Figure 2(a) shows that the beam is centered in , but not in . The measured muon beam distribution in position and angle at the beam monitor, as shown in Fig. 2, is input into a simulation to calculate the average depolarization of the muons from the location of the beam monitor to the high-purity Al muon stopping target at the center of the TWIST detector (Fig. 3). The angular distribution in is shown in the figure, but similar distributions are measured in and these are also included in the simulation Sheffer . The RMS size of the beam is 0.6 cm in both and , and the average angular spread of the beam is 10 mrad in and 12 mrad in .
The muon beam is transported in vacuum until it is inside the solenoid field, where it then passes through the gas degrader and trigger scintillator. The gas degrader is a 21.67 cm long (along ) chamber containing a mixture of He and CO2 that can be adjusted to stop the muons in the stopping target. The plastic (Bicron BC408) disk shaped trigger scintillator has a thickness of 195 m, a radius of 3 cm, and is located 80 cm upstream of the central stopping target.
The materials that the muons pass through, starting from the production target to the center of the stopping target, are summarized in Table 1.
| Material | Thickness (mg/cm2) |
|---|---|
| Degrader and vacuum foils | 11.91 |
| He/CO2 degrader | 1.95 to 42.80 |
| Air gap ( cm) | 3.65 |
| Muon scintillator | 20.12 |
| Scintillator wrap | 3.03 |
| Cradle window | 0.88 |
| PC module | 9.46 |
| Dense stack | 13.41 |
| Seven UV modules | 27.80 |
| He/N2 ( cm) | 12.25 |
| Half target module before target | 4.31 |
| Half of 71 m Al target | 9.59 |
| Total to center of Al target | 118.36 to 159.21 |
The TWIST spectrometer Henderson is designed to measure a broad range of the positron spectrum from muon decays in a stopping target, allowing the simultaneous extraction of the spectrum shape parameters. The spectrometer consists of 12 very thin high-precision proportional chamber (PC) planes and 44 drift chamber (DC) planes, perpendicular to the axis of a solenoid producing a magnetic field of 2 T. The upstream half of the spectrometer (22 DCs and 6 PCs) is shown in Fig. 3, and the downstream half of the detector is mirror symmetric with the upstream.
The gas particle detectors used by TWIST are mounted in a leak tight aluminum cradle that is filled with % N2 and % He gas. Helium, rather than air, is used to reduce the scattering between measurement points and to allow the low energy muons to reach the stopping target at the center of TWIST. The spacing of the PCs and DCs is maintained by precision ground spacers made of a Russian engineered material Sital CO-113M which has a very small thermal coefficient of expansion. The spacers are pushed together by four pneumatic cylinders with a force of N each to ensure they are touching and do not move.
The DCs are used to obtain a precise measurement of the position of the e+ as it traverses the chambers. To accomplish this a slow drift gas, dimethyl ether (DME), which has a small angle between the drift field and the electron drift direction in a non-zero magnetic field (Lorentz angle), is used. Each DC plane consists of 80 gold-plated tungsten anode sense wires of m diameter, spaced by 4 mm Davydov . The cathode foil walls are m of aluminized Mylar, nominally placed mm from the wires. The drift time for each signal is used along with a space-to-time relationship (STR) that is calculated by a GARFIELD simulation garfield to improve the determination of the momentum and angle of the decay positrons.
The purpose of the PCs is to have reasonably fast timing information to help with pattern recognition. The width of the time to digital converter (TDC) signal from the PCs is used to discriminate muons from positrons. The PCs are similar to the DCs, with the exception of the following: the PCs use CF4/isobutane gas, a wire spacing of 2mm, and 160 wires in each plane. The PC modules consist of four wire planes. One PC module is placed at either end of the detector stack, and the specialized target module in the center of the detector stack contains two PCs on either side of the muon stopping target.
Collection of an event is triggered by the muon scintillator whose threshold is set high enough to reduce the beam positron trigger rate but low enough to trigger on most beam muons. The fraction of triggers due to beam positrons is only %. Positrons in the beam are easily removed from the data since they leave signals through the full length of the detector.
Events in TWIST are recorded by LeCroy Model 1877 TDCs. The trigger and TDC read-out are set up to record signals in 500 ps time bins from s before to s after a muon passes through the trigger scintillator. For each wire signal, the TDC records a pulse start and stop, and thus can be used to calculate a pulse width. In this configuration up to eight wire signals can be recorded for each wire in any triggered event daq-renee . A fixed blanking time of 80 s was imposed after each accepted trigger. This blank is sufficiently long to allow each TDC to finish conversion. To insure that all TDCs have fully converted their hits, each one was required to produce a header specifying how many hits were converted even when zero hits were received.
For this measurement a m thick, % pure, Al target is used to stop muons. The tracks of the selected muons are required to have at least one signal in the PC immediately before the Al target and no signals in the PC immediately after the Al target. The average from the last chamber plane fired by the muons () is used in a feedback loop to control the fractions of He and CO2 in a gas degrader, in order to stop % of the selected muons in the Al target at the center of the solenoid. Some muons that stop in the CF4/isobutane or Mylar foils in the vicinity of the Al target could not be separated and wer included in the measurement.
III III. Data Analysis
TWIST determines the Michel parameters by fitting two-dimensional distributions of reconstructed experimental decay positron momenta and angles with distributions of reconstructed simulated data Gaponenko .
The nominal fiducial region adopted for this analysis requires MeV/c, MeV/c, MeV/c, and . The fiducial cuts, while intentionally chosen to be conservative, are related to physical limitations of the TWIST detector. The 50 MeV/c momentum cut rejects events that are near the region utilized in the energy calibration. It is also important to avoid the region very close to the end point to minimize the sensitivity of the Michel parameter fits to details of the simulation that may affect the momentum resolution. The longitudinal momentum constraint eliminates events with helix pitch near the 12.4 cm periodicity in the wire chamber spacing. The transverse momentum constraint ensures that all decays are well confined within the wire chamber volume. The angular constraint removes events at large that have worse resolution and events at small that experience large energy loss and multiple scattering. These limits were fixed early in the analysis. The value of was found to change by less than 0.0001 when the fiducial boundaries were moved by % in momentum cut values and % in cut values.
The decay positrons spiral through the chambers producing signals on the wires, which are recorded by the TDCs. These helical tracks are subsequently reconstructed and analyzed to determine the positron energy and angular distributions. Determining the positron momentum and angle is done with a -squared fit to a helical track that includes the drift time information from each cell. The helix fits also include positron multiple scattering in the calculation using the procedure from Lutz . The efficiency of the track fitting is 99.5% within the nominal fiducial region used for spectrum fitting Musser ; Gaponenko . The number of degrees of freedom (DOF) varies with track angle, since higher angle tracks will pass through more DC cells per plane. For the average DOF, the most probable is , but there is a long tail to larger values because the non-Gaussian tails of the multiple scattering distributions are not treated properly in the calculation and because we only use approximate STRs. The momentum resolution is typically 100 keV/c, and the resolution is about 0.005 Musser .
In event selection, the PC and DC signals are examined to identify events in which the muon stopped in the target, then decayed at least 1.05 s, and no more than 9 s, later. The delay insures that the PC and DC signals associated with the muon and decay positron do not overlap. Events are rejected if a second muon enters the spectrometer, or if a beam positron passes through the spectrometer within 1.05 s of either the muon arrival or decay time. Additional cuts include the muon flight time through the M13 beam line and a requirement that the muon stopping location be within 2.5 cm of the detector axis. All events that pass these cuts are analyzed to reconstruct the decay positron kinematics.
After track fitting, 2% of the events contain additional tracks in coincidence with the decay. Extra tracks can arise from beam particles that are not resolved in time, events that scatter within the detector leading to two reconstructed track segments, and events that include delta rays or decay positrons that backscatter from material outside the detector volume. Algorithms were developed to identify events with backscatters and reject coincident beam particles Gaponenko .
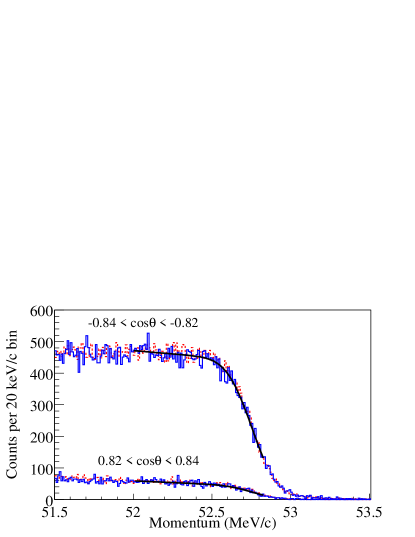
The energy calibration of the decay positrons is obtained from a fit to the endpoint of the spectrum. The fit for the endpoint is done separately from the fit for the muon decay parameters, and to avoid bias the data from the region of momentum used in the endpoint fit are excluded from the determination of the muon decay parameters. The endpoint fit function is a slope with an edge () convoluted with a Gaussian . The parameters , , and all depend on andrthesis . The end point of the muon decay spectrum and sections of the 2-dimensional end point fit function for the bins within the fiducial region with the smallest upstream and downstream angles are shown in Fig. 4. The difference in yield between upstream and downstream emphasizes the asymmetry of polarized muon decay. The corrected momentum is given by:
| (7) |
where is the reconstructed momentum, is the reconstructed cosine of the decay positron angle, is the maximum positron momentum, defines the momentum scale related to the magnitude of the spectrometer magnetic field, and is the zero angle energy loss for upstream () or downstream () decay positron tracks. This simple form was chosen because of the planar geometry of the wire chambers, such that the amount of material the positron passes through increases linearly as .
The endpoint fit parameter is highly correlated with . In the simulation the momentum is measured without bias at the few keV/c level, the magnetic field is measured with an NMR probe, and the magnetic field map has been determined to better than mT in the tracking region. For this reason the endpoint fits are done with the value of set to zero and assigned an uncertainty consistent with the momentum fit and field map accuracy. A 12 keV/c difference between the data and simulation values was observed, and this is corrected by applying the energy calibration.
The TWIST simulation is based on GEANT 3.21 Brun . The simulation contains virtually all the components of the spectrometer with which a muon or a decay positron could interact. The output exactly mimics the binary files generated by the data acquisition system. Details of the simulation have been presented previously Musser ; Gaponenko .
In bringing the muon beam to a stop in the Al target at the center of the TWIST spectrometer, the muons are depolarized by the combined effect of multiple scattering, interaction with the fringe field of the spectrometer, and interactions when stopped in the high purity Al target. Thus, the polarization of the muon with respect to the axis when it decays is lower than its polarization with respect to the muon momentum when it was produced in pion decay. To obtain an absolute measurement of , data are fit to a simulation that includes effects of fringe field depolarization and material depolarization.
The main factors that influence the difference between and are the transport of the muon spins in the various regions of magnetic field and models for the muon depolarization in materials. Transport of the muon spins from the beam measurement location to the muon stopping target is done using a classical fourth order Runge-Kutta using the Nystrom algorithm nystrom , of the Bargmann-Michel-Telegdi bargmann equation. The inherent accuracy of this numerical integration is excellent, but depends on the accuracy on the knowledge of the input beam parameters and the magnetic field map. For this reason, the beam monitoring chamber measurements were used to generate the muon beam for the simulation.
Ideally the magnetic field is meant to be uniform and aligned with the axis of the muon beam momentum (and anti-aligned with the muon spin), which is labeled as the coordinate in TWIST. The field shaping elements of the magnet were input into a finite element analysis which models the magnetic field in order to create a field map that included the radial components of the field as well as the longitudinal components at each of the positions at which the longitudinal component was measured.
The magnetic field of the solenoid was mapped using a specially constructed mapping tool which used Hall probes, and NMR magnetometers to measure the magnetic field. The component of the magnetic field along was mapped in the uniform field region and in the beam monitoring entrance region. A field map was generated that matches the measurements to mT in T in the uniform region, but deviates up to 4% in the entrance region at cm. The effects of the steel from the last two quadrupoles of the M13 beamline were studied using field maps from the finite element analysis that included or excluded the iron of the last three beamline elements. The map produced from this study was used to estimate a systematic error on due to the uncertainty in the magnetic field in the fringe field region.
A blind analysis was implemented by utilizing hidden Michel parameters , and to generate the simulated decay rate. The decay rate can be written as:
because the decay spectrum is linear in the shape parameters. The simulation spectrum was fit to the data spectrum by adjusting , , and .
An alternate analysis scheme, used only to compare relative polarizations, was developed using an integral asymmetry defined as the difference between the number of forward and the number of backward decays divided by their sum. To obtain a polarization estimate the forward and backward sums were done inside the fiducial region described earlier in this section and normalized using integrals of Eq. I with the SM values of the Michel parameters inserted.
IV IV. Evaluation of Systematics
The leading systematic uncertainties in this measurement of arise from the potential sources of muon depolarization. These include depolarization due to multiple scattering in the production target and a m beamline foil, fringe field depolarization, and interactions with material while the muon is propagating through the detector and after stopping.
The depolarization in the production target is due to multiple scattering of the muons while exiting the target. An estimate of the depolarization in the small angle approximation is , where is the width of the multiple scattering angular distribution PDG . The muons in the beam arise from a maximum depth of cm of graphite, which produces a depolarization of which is taken as the systematic uncertainty in due to multiple scattering in the production target.
The systematic uncertainty in the fringe field depolarization is estimated from the different settings used in data taking for the second dipole element (B2) in the M13 channel. The beam parameters were measured for two different B2 settings, both before and after the data collection. The relative changes in angle and position between the nominal B2 value (94.4 mT) and B2+0.5% settings are similar for the two periods, but the absolute numbers for the average beam angles are quite different. This could be due to changes in the performance of the beam monitoring chamber or to its alignment to the beamline. To determine the sensitivity of the polarization to beam position and angle, a simulated beam was scanned in position and angle and the polarization was found to depend quadratically on the input variables. Using this parameterization, the predicted polarizations for the four characterization runs are shown in Table 2. The beam for the third row of Table 2 is illustrated in Fig. 2. The larger of the differences in predicted polarization for a given B2 setting () is adopted as an estimate of the uncertainty due to limits of reproducibility.
| B2 | |||||
|---|---|---|---|---|---|
| (mT) | (cm) | (mrad) | (cm) | (mrad) | |
| 94.4 | 0.07 | -5.9 | 0.97 | 7.0 | 0.9929 |
| 94.9 | 0.85 | -1.1 | 0.87 | -5.0 | 0.9955 |
| 94.4 | 0.06 | -6.7 | 0.73 | -11.2 | 0.9941 |
| 94.9 | 0.94 | -1.5 | 0.64 | -19.2 | 0.9922 |
Uncertainties due to deconvolution of the beam angle measurement, modeling of the shape of the solenoid fringe field, and beam size reproduction also contribute to the final quoted systematic uncertainty of due to fringe field depolarization.
The depolarization of the muons while they propagate through the detector and interact with the detector materials is negligibly small for muons with kinetic energy between MeV and keV senba . Simulations show that greater than % of muons stopping in our Al target have more than keV kinetic energy. Muonium formation is thus suppressed by ensuring that the majority of the muons have sufficient energy entering the Al target. For those muons that do not stop in the Al target, the Paschen-Back effect minimizes but does not eliminate the depolarization due to muonium formation. Most of the muons stop in the high-purity Al target, where they can interact with conduction electrons. These electrons create a hyperfine magnetic field at the site of the muon, which can be considered as a fluctuating local field with a correlation time s in Al mudepol:abragam . This interaction results in a Korringa depolarization rate mudepol:korringa ; mudepol:cox that has an exponential form, and does not depend on the magnetic field. Significant depolarization rates of s-1 have been measured for muons in Cd, Sn, Pb, As, Sb, and Bi mudepol:cox . The authors explained the measured depolarization rates to be due to Korringa depolarization because the values increase with temperature as predicted.
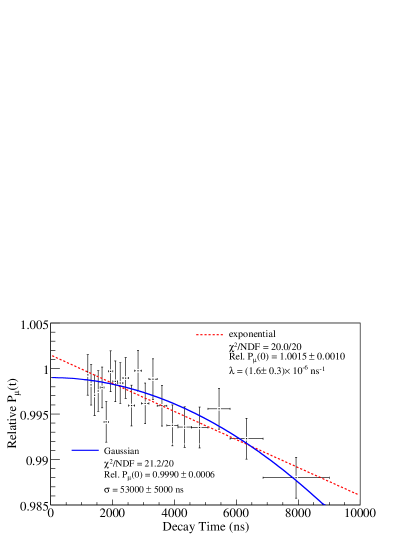
Jodidio et al. Jodidio measured a depolarization rate of s-1 for their Al target at T. This rate is about 2.5 smaller than the s-1 observed in this experiment. The difference could partly be due to the to % of the muons that stop in the gas before the stopping target. The functional form of the depolarization in gases is unknown, thus an assumption that there is no unseen rapid depolarization is made. The spin relaxation, with mean lattice-site residence time , is given approximately by the Kubo-Tomita expression kubo , which reduces to Gaussian (exponential) forms for .
The difference between Gaussian and exponential extrapolations of the integral asymmetry measurement, as shown in Fig. 5, is . Data before 1.05 s are not considered because of possible contamination of late TDC signals from muons for upstream decay positrons. Changing the cutoff between 900 ns and 1100 ns has negligible effect on the asymmetry measurement extrapolated to zero time. Half the difference between the two different extrapolations is the correction applied to the simulation to data fits, because the simulation was generated with a Gaussian form, while in reality the shape is most likely a linear combination of a Gaussian and exponential. An estimate of the extrapolation uncertainty is half the difference between the Gaussian and exponential extrapolations.
Other systematic uncertainties were studied by employing the fitting technique described in the data analysis section. In this case the fits are of experimental data (or simulation) samples, taken with a systematic parameter set at an exaggerated level, to data (or simulation) taken under ideal conditions. The difference measured, or sensitivity, expresses the changes in the spectrum shape caused by the systematic effect in terms of the changes in the Michel parameters. Systematic uncertainties in the measurement of are summarized in Table 3.
The chamber response systematic uncertainty in comes from the uncertainty due to the PC and DC response. Six sources of uncertainty, described in the following paragraphs, are: time variations in the wire-to-wire timing, changes to the space-to-time relations (STR) from density variations, chamber foil bulge due to changes in differential pressure between the chamber gas and cradle helium, the asymmetry of the wire positions relative to the foils due to construction, and a dead zone due to a recovery time after a muon passes through the chambers.
To estimate the possible time variation in the wire to wire time zero (), calibration runs are taken at the beginning and end of the run period. To measure the sensitivity of the muon decay parameters to variations, a calibration scaled by ten times the difference in the beginning and end of run time calibrations is used. The contribution to the chamber response systematic uncertainty in due to variations, obtained from fitting the exaggerated time shift analysis spectrum to a nominal spectrum, is . A second calibration scaled by 5 times the difference in beginning and end of run, shows that this systematic uncertainty scales linearly.
The shape of the chamber cathode foils depends on the differential pressure between the chamber gas and the He gas of the cradle holding all of the chambers. The differential pressure of the chambers is monitored and controlled by the gas system. To measure the level of foil bulge, several nominal data runs are taken at different differential pressures. The average helix fit drift time difference, for tracks that go through the center of the chambers, relative to the average helix fit drift times for tracks that go through the radially distant part of the chamber, is sensitive to the foil bulge. Run to run monitoring of this fit time difference shows that the variation in foil bulge is controlled to better than m. To measure the sensitivity of the muon decay parameters to the chamber foil bulge, a simulation generated with the STR calibration changed as if the foils were moved outward by m is used. The contribution to the chamber response systematic uncertainty, in , due to time variations in the foil bulge, is estimated to be .
Surveys of the constructed chambers show that the spacing between the wire plane and cathode foils is not the same on both sides of the wire. On average the cathodes are found to be shifted by about m from their nominal 2 mm spacing from the wire planes. With the solenoid field on, the position of the cathode foils was also determined using normal decay positron data. Using the bulge calibration data, from runs with different bulges, a relationship between a fit time difference to a foil shift is obtained. STR files were changed half plane by half plane to match the measured shifts. A fit of the muon decay distribution, from the shifted cathode foil simulation to a nominal simulation, results in a contribution to the chamber response systematic uncertainty in of .
History plots of the density variation for each data set show that the largest RMS change in density is %. To estimate the effect of density changes, a simulation was generated with the temperature changed by (from 300 K to 270 K). A scaled fit of the changed temperature simulation set to a nominal simulation set is used to estimate the addition to the chamber response systematic uncertainty in of .
As the muon passes through the upstream half of the detector, it deposits large ionization in the chambers. The resulting electron avalanches near the wires take time to recover as the positive ions drift back to the cathode planes. These dead zones produce an upstream-downstream efficiency difference for decay positrons. For each muon hit the wire efficiency versus distance away from the muon hit is estimated as a function of time after the muon track. A determination of the muon decay parameter sensitivities to the muon dead zone is made by introducing an exaggerated dead zone into the simulation which removes 11.4 times as many hits as are expected in normal data. A conservative estimate of the contribution to the chamber response systematic uncertainty in due to the muon dead zone is .
The systematic uncertainty in due to spectrometer alignment comes from how well the chamber translations in , , and angle are corrected to match their true positions, and the degree to which the misalignment between the magnetic field axis to the chamber axis is treated.
The systematic uncertainty in due to positron interactions includes four effects: a discrepancy between the simulation and data energy loss, hard and intermediate interactions, multiple scattering, and backscattering from material outside the detector.
The systematic uncertainty in due to the momentum calibration comes from two contributions. One contribution is due to how well the endpoint energy calibration can be determined. The other factor is how well the measured magnetic field map represents reality.
The systematic uncertainty in due to a difference in the upstream and downstream efficiencies is estimated from the mean number of hits used in fitting the upstream and downstream tracks. An upstream-downstream difference is expected from the different angular distributions, and is reproduced by the simulation. The observed discrepancy between data and simulation of 0.18 hits/track is a measure of the efficiency difference.
To estimate the sensitivity of the muon decay parameters, due to a difference in upstream versus downstream efficiency, a data set was analyzed with of its downstream DC hits thrown away before analysis. This upstream-downstream efficiency change, compared to a normal analysis of the same data, produces a change in of (). The lowered efficiency run downstream track fits have 1.8 fewer hits/track relative to the standard run. An estimate of the systematic uncertainty in due to a difference in upstream and downstream efficiency is ergo .
The systematic uncertainty in due to background muon contamination comes from muons which are born in pion decay in the vicinity of the gas degrader.
The beam intensity systematic uncertainty in comes from changes in the beam rate which affects the rate of coincident particles.
Theoretical uncertainties in the radiative corrections introduce a small systematic uncertainty in .
Several of the systematic uncertainties could vary from data set to data set and are denoted by (ave), and are considered data set dependent when calculating the weighted average value of . For example, the effect of positron interactions on upstream and downstream decay positrons changes when the mean muon stopping location is adjusted; thus the systematic uncertainty in due to positron interactions is set-dependent.
| Effect | Uncertainty |
|---|---|
| Depolarization in fringe field (ave) | 0.0034 |
| Depolarization in stopping material (ave) | 0.0012 |
| Chamber response (ave) | 0.0010 |
| Spectrometer alignment | 0.0003 |
| Positron interactions(ave) | 0.0003 |
| Depolarization in production target | 0.0002 |
| Momentum calibration | 0.0002 |
| Upstream-downstream efficiency | 0.0002 |
| Background muon contamination (ave) | 0.0002 |
| Beam intensity (ave) | 0.0002 |
| Michel parameter | 0.0001 |
| Theoretical radiative corrections | 0.0001 |
V V. Results
The result for presented here uses a data sample consisting of events recorded in Fall 2004. This data sample includes eight data sets, of which seven were used for the extraction of . Simulations to fit each of the seven data sets used different beam characterization profiles, derived from beam measurements performed after the data collection, which matched different conditions under which the data were recorded. The remaining data set was used to determine the detector response using decay positrons from muons stopping in the trigger scintillator and the first few chamber planes (far upstream), as described in Musser ; Gaponenko .
Five sets of data were taken with the beam steered nominally. One data set had the muon beam stopping with the Bragg peak centered in the target (stop ). Two sets, which were separated in time by a few days, were taken with the muon Bragg peak shifted to of the way through the Al stopping target (stop A, B). One set was taken with a muon beam size limiting aperture (aperture), and one set was taken with the beam rate increased (high rate).
Two sets of data were collected with the beam displaced by changing the last bending magnet (B2) field by +0.5% from nominal. One of the data sets (B2+0.5%) had the muon Bragg peak centered in the stopping target, while in the other set (PC5 stop), the muons were stopped relatively far upstream in order to increase the relative fraction of muons stopping in gas. All of these data sets, using different beam characterization profiles that matched the different conditions, were used in this determination of .
The spectrum fit results for the parameter are presented in Table 4. At the present stage TWIST cannot provide an improved measurement of , therefore its value is set to the global analysis value of Gagliardi , to constrain the other parameters better. The uncertainty of on the accepted value of gives an uncertainty of on the final value of .
| Data Set | stat syst | |
|---|---|---|
| B2+0.5% | 1.0023 0.0015 0.0037 | 2007 |
| PC5 stop | 1.0055 0.0030 0.0038 | 1906 |
| stop | 1.0015 0.0014 0.0037 | 1876 |
| stop A | 0.9961 0.0014 0.0037 | 1900 |
| high rate | 0.9997 0.0019 0.0037 | 1932 |
| aperture | 0.9978 0.0018 0.0037 | 1896 |
| stop B | 1.0009 0.0019 0.0037 | 1841 |
The average values of and from the present fits are 0.749 and 0.753, respectively. An evaluation of the uncertainties in and has not been performed, but if one assumes systematic uncertainties similar to the previous TWIST measurements, these values are reasonably consistent with the published values of Musser and Gaponenko .
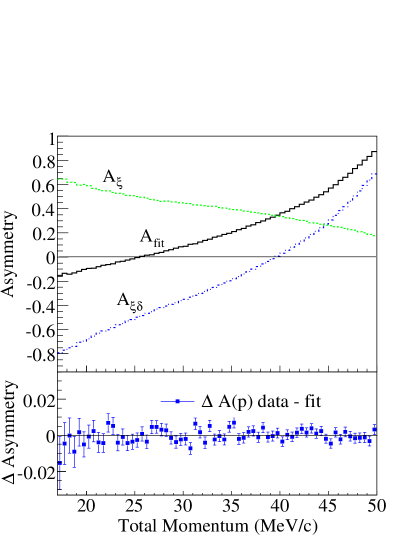
To illustrate the quality of the fit, and how the spectrum fit distinguishes between and , the contribution to the fit asymmetry versus momentum for each of these terms and from the best fit are shown in Fig. 6. Note that the total asymmetry versus momentum, , is:
| (8) |
where is the asymmetry when the contribution to the positron decay spectrum is zero, and is the asymmetry when the contribution is zero. The top panel in Fig. 6 shows the best fit asymmetry versus positron momentum, with all of the fiducial cuts applied as a solid line; the contribution to the fit from the term as a long-dashed line; and the contribution to the fit from the term as the short-dashed line. The bottom panel shows the difference, between data and fit.
VI VI. Conclusion
The value of was determined to be 1.0003 0.0006(stat.) 0.0038(syst.). The central value for was calculated as a weighted average using a quadratic sum of the statistical and set-dependent uncertainties for the weights. The final systematic uncertainty is a quadratic sum of the set-independent and the average values of the set-dependent systematics.
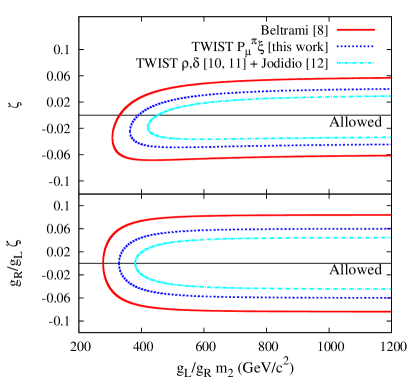
The 90% confidence limits on the LRS model parameters from this measurement are: and GeV/c2 in the manifest case, and and GeV/c2 in the general LRS model. The LRS model limits are shown in Fig. 7.
The central value measured is closer to the SM value than previous direct measurements, and, hence, in a global fit with all other muon decay parameter data Gagliardi it pulls those parameters that are sensitive to (, ) closer to the SM value. However, the changes are small compared to the uncertainty on these parameters. The present result reduces the uncertainty on the direct measurement of Beltrami by a factor of two; it is also consistent with the SM and the value obtained indirectly Jodidio ; Musser ; Gaponenko . This is TWIST’s first independent measurement of , and prospects for reducing the main systematic uncertainties in for data taken in the future with an improved beam measurement device are excellent.
Acknowledgements.
We would like to thank C.A. Ballard, M.J. Barnes, J. Bueno, S. Chan, B. Evans, M. Goyette, A. Hillairet, K.W. Hoyle, D. Maas, J. Schaapman, J. Soukup, C. Stevens, G. Stinson, H.-C. Walter, and the many undergraduate students who contributed to the construction and operation of TWIST. We thank D.G. Fleming and J.H. Brewer for discussions on muon spin interactions in condensed matter. We also acknowledge many contributions by other professional and technical staff members from TRIUMF and collaborating institutions. This work was supported in part by the Natural Sciences and Engineering Research Council and the National Research Council of Canada, the Russian Ministry of Science, and the U.S. Department of Energy. Computing resources for the analysis were provided by WestGrid.References
- (1) W. Fetscher, H.-J. Gerber and K.F. Johnson, Phys. Lett. B 173, 102 (1986).
- (2) L. Michel, Proc. Phys. Soc. A 63, 514 (1950); C. Bouchiat and L. Michel, Phys. Rev. 106, 170 (1957); T. Kinoshita and A. Sirlin, Phys. Rev. 108, 844 (1957).
- (3) A.B. Arbuzov, Phys. Lett. B 524, 99 (2002); JHEP 03, 063 (2003); JETP Lett. 78, 179 (2003); A. Arbuzov, A. Czarnecki and A. Gaponenko, Phys. Rev. D 65, 113006 (2002); A. Arbuzov, and K. Melnikov, Phys. Rev. D 66, 093003 (2002).
- (4) A.E. Pifer, T. Bowen, and K.R. Kendall, Nucl. Instr. and Meth. 135, 39 (1976).
- (5) P. Herczeg, Phys. Rev. D 34, 3449 (1986).
- (6) S. Eidelman et al., Phys. Lett. B 592, 1 (2004).
- (7) Y. Kuno and Y. Okada, Rev. Mod. Phys. 73, 151 (2001).
- (8) I. Beltrami et al., Phys. Lett. B 194, 326 (1987).
- (9) J. Imazato et al., Phys. Rev. Lett. 69, 877 (1992).
- (10) J.R. Musser et al. (TWIST Collaboration), Phys. Rev. Lett. 94, 101805 (2005).
- (11) A. Gaponenko et al. (TWIST Collaboration), Phys. Rev. D 71, 071101(R) (2005).
- (12) A. Jodidio et al., Phys. Rev. D 34, 1967 (1986); 37, 237(E) (1988).
- (13) R.S. Henderson et al., Nucl. Instr. and Meth. A 548, 306 (2005).
- (14) C.J. Oram et al., Nucl. Instr. and Meth. 179, 95 (1981).
- (15) J. Hu et al., Nucl. Instr. and Meth. A 566, 563 (2006).
- (16) Y. Davydov et al., Nucl. Instr. and Meth. A 461, 68 (2001).
- (17) R. Veenhof, GARFIELD, Version 7.10.
- (18) R. Poutissou et al., Proceedings of the 13th IEEE-NPSS Real Time Conference 2003, Montreal, QC, (2003).
- (19) G. Lutz, Nucl. Instrum. Meth. A 273, 349 (1988).
- (20) A. Gaponenko. “A precision measurement of the muon decay parameter delta”, Ph.D. thesis, University of Alberta (2005).
- (21) R. Brun et al., GEANT3 Users Guide, CERN Program Library W5013 (1994).
- (22) E. J. Nystrom, Acta Soc. Sci. Fenn., 50, No.13, 1-55 (1925).
- (23) V. Bargmann, L. Michel, and V. L. Telegdi, Phys. Rev. Lett. 2, 435 (1959).
- (24) M. Senba, J. Phys. B: At. Mol. Opt. Phys. 31, 5233 (1998).
- (25) A. Abragam, “The Principles of Nuclear Magnetism”, Oxford, 335 (1961).
- (26) J. Korringa, Physica 16, 601 (1950).
- (27) S.F.J. Cox et al., Physica B 289-290, 594 (2000).
- (28) R. Kubo and K. Tomita, J. Phys. Soc. Jpn., 9, 888 (1954).
- (29) C.A. Gagliardi, R.E. Tribble, and N.J. Williams, Phys Rev. D 72, 073002 (2005).