Ginwidth=.9height=.37keepaspectratio
TOP QUARK MASS MEASUREMENTS AT CDF
The mass of the top quark is interesting both as a fundamental parameter of the standard model and as an important input to precision electroweak tests. The Collider Detector at Fermilab (CDF) has a robust program of top quark mass analyses, including the most precise single measurement, , using of collision data. A combination of current results from CDF gives , surpassing the stated goal of precision using of data. Finally, a combination with current D0 results gives a world average top quark mass of .
1 Introduction
The top quark, as the heaviest known fundamental particle, is especially interesting because of its large mass. Top quark loops contribute large radiative corrections to other observables such as the boson mass, and the value of those corrections depends strongly on the top quark mass. In particular, precise measurements of the top quark and boson masses are needed to constrain the mass of the putative Higgs boson, and for consistency studies if the Higgs is observed. The Yukawa coupling of the top quark to a standard model Higgs is roughly one, possibly indicating a special role for top in electroweak symmetry breaking. Finally, the mass of the top quark has inherent interest as a fundamental parameter of the standard model.
2 Top Quark Mass at CDF
The Collider Detector at Fermilab (CDF) is a general-purpose detector at the Fermilab Tevatron, a collider operating at . Top quark mass analyses at CDF use events where top/antitop pairs are produced strongly. Since top quarks decay before hadronizing to a boson and a quark, the event signature depends on the decays of the two bosons. Here I report on measurements using the “lepton + jets” decay topology, where one decays to an electron or muon and a neutrino, and the other decays to hadrons; and the “dilepton” decay topology, where both bosons decay to or . Analyses using the challenging “all-hadronic” channel are in progress at the time of this conference; no CDF top quark mass analyses select at this time. In some analyses, the sample purity is significantly improved by requiring at least one tag, namely a displaced secondary vertex inside a jet.
Extracting the top quark mass from these events is challenging for several reasons. First, the events are complicated. Due to the splitting and merging of jets, and the presence of initial-state and final-state radiation (ISR & FSR), only in about 50% of selected lepton + jets channel events do the four leading jets correspond to the four quarks in the decay chain. Even if the correct set of jets is selected, it is not easy to determine which jet corresponds to which quark; the presence of tags eases this task. In the case of dilepton events, the two neutrinos are observed as a single combined “missing energy” vector in the plane transverse to the beam. Second, jets dominate events as primary and secondary decay products of the top quarks. But jet energies are measured with a relatively poor resolution of roughly , contributing to statistical uncertainties in the top quark mass; more importantly, there are large systematic uncertainties on the jet energy scale that induce the dominant systematic uncertainty on the top quark mass. Third, the selected event samples have background contamination at the few percent to fifty percent level, depending on the cuts. The background contributions are generally well understood, but must be treated properly to minimize associated biases and uncertainties.
CDF has a robust program of top quark mass measurements. Techniques with different sensitivity to event information and systematic effects yield compatible results, giving us confidence in their accuracy. About ten different analysis techniques have been used at CDF on run II data; here we will concentrate on recent results, all using 680– of data.
The analysis techniques used by CDF to extract the top quark mass can be separated into two categories. Template methods choose some kinematic observable from each event, often an event-by-event reconstructed top quark mass. Monte Carlo samples with full detector simulation are used to build “templates” of the distribution of this variable for signal samples generated with various values of the top quark mass, and for background processes. A likelihood fit of the data distribution to probability density functions (p.d.f.’s) derived from the signal and background templates yields a measurement of the true top quark mass. Due to this two-step process, the chosen observable does not need to be an unbiased estimator of the true mass, and in fact the template shapes are often quite complicated (see Fig. 2 for an example). Matrix element methods, in contrast, use a direct expression of the probability that a particular event is observed given a true top quark mass. The likelihood is built up from parton distribution functions, matrix elements for signal and background processes, and “transfer functions” that connect quarks at the matrix element level to observed jets, accounting for fragmentation effects and detector resolution. The measured top quark mass is then the maximum of the product of all the event likelihood curves. Since various approximations must be made in the interest of computational tractability, the measurement must in general be calibrated using the observed behavior on fully simuluated Monte Carlo samples with known top quark mass. Thus both sorts of analyses have as an essential input a good Monte Carlo description of the physics processes and a good detector simulation.
3 Top Quark Mass Analyses With 680–750 pb-1
In the current data sample of , our standard selection cuts select 64 dilepton and 360 lepton + jets candidates. In the subset of the data where the CDF silicon microstrip detector was operating well, allowing secondary vertices to be reconstructed, we find 27 dilepton and 252 lepton + jets candidate events with at least one tag. These are the largest datasets yet analyzed, and recent measurements of the top quark mass have statistical uncertainties significantly improved over those shown at previous conferences.
3.1 Two-dimensional Template Analysis in the Lepton + Jets Channel
The jet energy scale systematic uncertainty is the dominant contribution to systematic uncertainties on the top quark mass. It is difficult to calibrate jet energies at a hadron collider in general because resonant decays to jets are impossible to separate from the continuum background, leaving no point of reference for jet energy measurements. But in our reasonably high-purity sample of events in the lepton + jets channel, there exists a resonant decay of a boson to two jets. CDF has developed a technique to use this information to constrain our jet energy scale uncertainty, which results in a lower systematic uncertainty on the top quark mass.
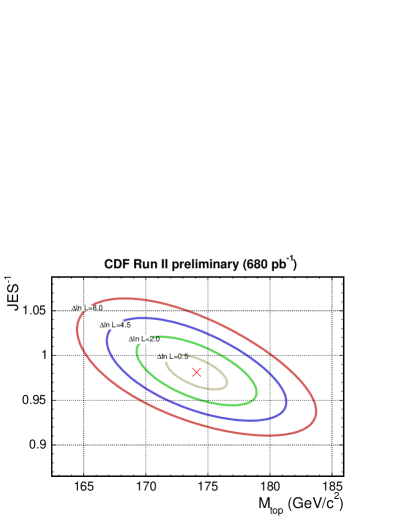
This analysis is an extension of the traditional template method. We would like to measure or constrain two quantities, the true top quark mass and the difference between our nominal jet energy calibration and the true scale. This difference, denoted , is expressed in units of the uncertainty in our nominal calibration, , so that we have by definition a prior constraint of . Instead of a single reconstructed variable, we use two observables, the reconstructed top quark mass and the dijet mass . The former comes from a kinematic fit to the full event, and the latter is the invariant mass of the presumed daughter jets.
The quantity is primarily sensitive to the value of , but is also affected by . The boson mass is known so precisely that it can be treated as fixed, and the distribution of is primarily sensitive to . But also has a dependence on , since sometimes we erroneously assign one of the jets from top decay as a daughter jet. Given all the dependencies, we fit simultaneously for the two quantities of interest, using the distributions of both observables. In addition, we subdivide the sample into four categories of events, determined by the number of tags and the jet transverse energies. Since the subsamples have different signal purity and different resolutions in the two observables, treating them separately increases the power of the likelihood fit.
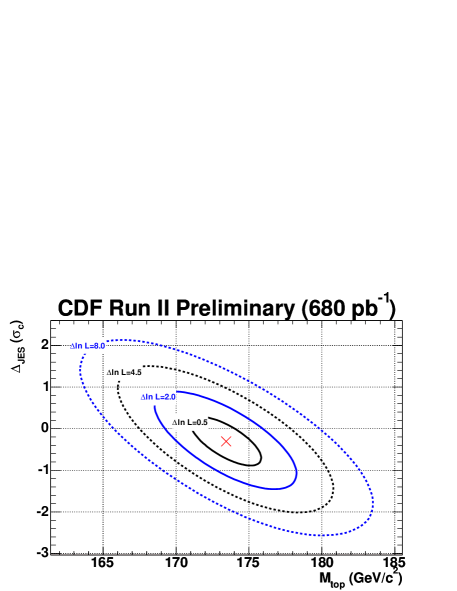
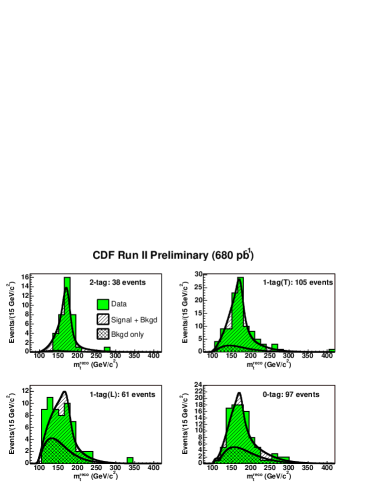
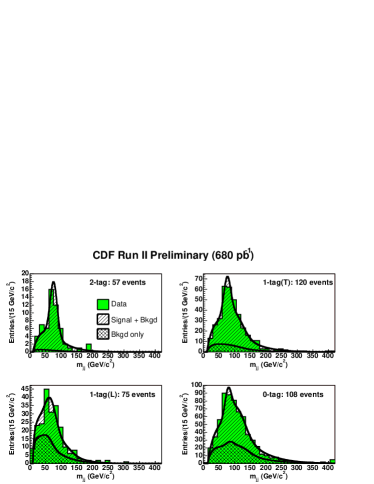
A global fit to the eight distributions (four subsamples times two observables), using the above prior constraint on , yields likelihood contours in the - plane as shown in Fig. 1. The anticorrelation arises because a given event sample can be consistent with a high top quark mass and a low jet energy scale (i.e. jet energies reconstructed too low) or vice versa. The distributions of and , along with the predicted distributions at the fitted values of and , are shown in Fig. 2.
The fitted value of is , which is consistent with our prior understanding of jet energies, but directly translates into a 40% reduction in the corresponding systematic uncertainty on the top quark mass. In fact, we have converted the dominant systematic error on into a statistical error, which will improve as we accumulate more integrated luminosity. However, the remaining systematic uncertainties still get a large contribution from components of the jet energy scale uncertainty that cannot be accounted for with a single jet energy scale parameter. Examples are the relative uncertainties in our jet energy calibration between daughter jets and jets, and between jets of different . Using the two-dimensional template method, the measured top quark mass is , the most precise single measurement of this important parameter.
3.2 Two-dimensional Matrix Element Analysis in the Lepton + Jets Channel
We have recently completed a second analysis that simultaneously measures the top quark mass and the jet energy scale, this time based on a matrix element technique. The likelihood to observe each event, generically represented as a vector of observables , depends on the true top quark mass, the jet energy scale (here defined as a simple multiplicative factor on the jet energies), and the signal fraction :
| (1) |
The meat of the method is in the signal probability:
| (2) |
Here the differential cross-section , which is determined by the production and decay matrix element and depends on parton-level kinematic quantities , is connected with the observables by the transfer function , which incoporates the dependence on the jet energy scale. The variables and correspond to the incoming partons, and represents the parton distribution functions. The final measurement is based on the product of all the event likelihoods; in this analysis the extrinsic jet calibration is not used, so all of the jet energy scale information comes from the mass resonance.
In this method, the full kinematic and dynamical information from each event is used, in contrast to the template method, where each event is reduced to two numbers. However, since a leading-order matrix element is used, events with extra radiation are not well described, and the sample is restricted to events with exactly four reconstructed jets. Additionally, a requirement of at least one tag is imposed to improve sample purity, leaving 118 events.
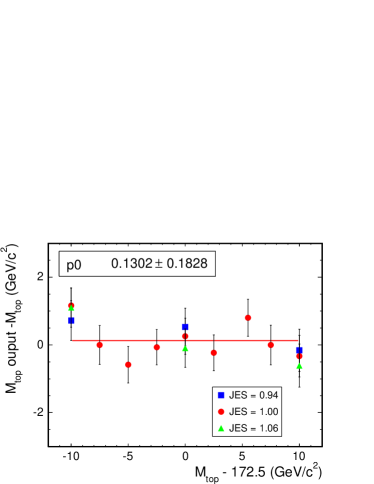
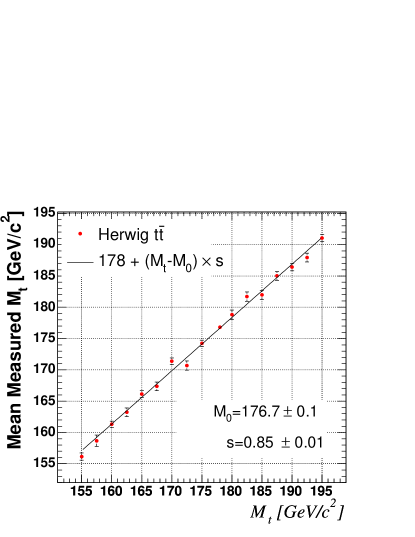
Since several approximations are made in the likelihoods as written above, we calibrate the method against Monte Carlo samples as shown in the left plot of Fig. 3. Within the statistical uncertainty of the Monte Carlo samples used, the method is unbiased. The right plot of Fig. 3 shows the likelihood contours, with a result very similar to the template analysis above. Although the matrix element analysis uses fewer events, the more powerful method yields a result of comparable sensitivity. The systematic uncertainties are dominated by uncertainties in the modeling of signal events, for example in the level of ISR and FSR in events. Using the two-dimensional matrix element method, the measured top quark mass is .
3.3 B Hadron Decay Length Analysis in the Lepton + Jets Channel
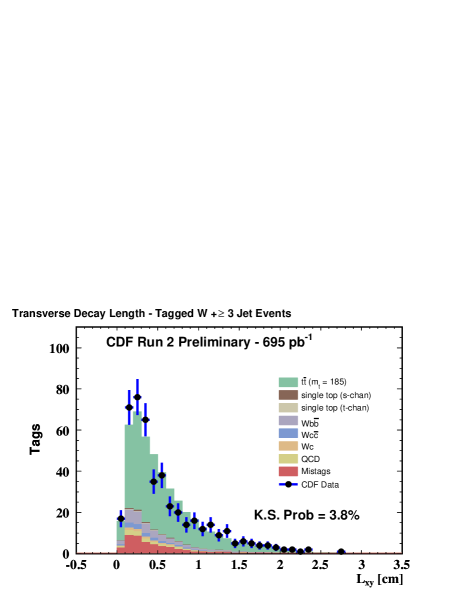
In this template-based analysis we take a different approach to reducing the jet energy scale systematic, namely we eliminate it by disregarding the jet energies altogether. Recall that the tagging algorithm reconstructs a secondary vertex inside a jet, identifying the displacement between the primary and secondary vertices with the flight path of a hadron. In events, the precise magnitude of that displacement depends on the boost imparted to the associated quark, which in turn depends on the mass of its predecessor, the decaying top quark. Thus we choose as our observable the decay length in -tagged jets; the uncertainties on this quantity are uncorrelated with the jet energy scale uncertainty.
In practice, this is a challenging measurement that is still limited by the statistics of the event sample. A proof-of-principle analysis has been performed using lepton + jets events, but dilepton and even all-hadronic events could be used in the future. Figure 4 shows the distribution of the transverse decay length in the data, compared with the expected contributions from signal and background events. The fitted top quark mass is , consistent with other measurements within the large uncertainties. An important point is that the statistical and systematic uncertainties are almost completely uncorrelated with other measurements, so that the method will soon begin to contribute noticeably to combinations. Studies show that at the LHC, similar methods can make a significant contribution to the overall top quark mass uncertainty.
3.4 Matrix Element Analysis in the Dilepton Channel
A matrix element technique is also applied to events in the dilepton channel. In dilepton events, the top quark mass is harder to reconstruct: the two neutrinos result in an underconstrained kinematic system. The dilepton sample is thus particularly amenable to a matrix element approach, since the observed quantities and their correlations are used in a more optimal fashion.
We use a likelihood similar in form to that given above in Section 3.2. In this case, however, the approximations have a more significant effect. The left plot of Fig. 5 shows the calibration curve derived from Monte Carlo samples generated with various values of . The slope of this curve is , indicating a substantial nonlinearity in the raw measurement, which comes primarily from limitations in the background modeling. Additionally, the pull widths for the raw measurement are about 1.5 (with no dependence on true top mass), indicating a significantly underestimated uncertainty. This effect has been studied extensively, and is understood to result from the assumptions that i) lepton energies are perfectly measured; ii) lepton and jet angles are perfectly measured; iii) the leading two jets in a signal event always correspond to the two jets from top decay; and iv) the background events are well modeled. After calibration, the measurement is unbiased and the error is accurately estimated over a large range of .
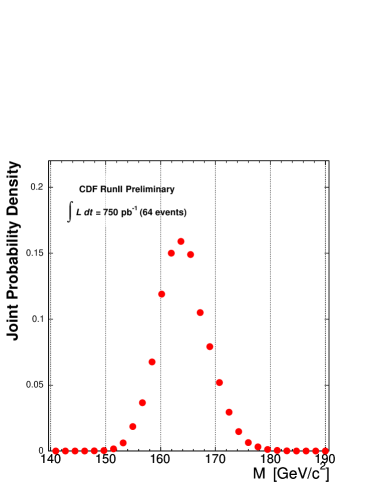
The right plot of Fig. 5 shows the resulting likelihood for the 64 events in the dilepton sample. From these events we measure , the most precise single measurement in this challenging channel. The measurement is also performed on the subset of 27 events with at least one tag, yielding . In both cases, the systematic uncertainty is dominated by the jet energy scale, which contributes about .
4 Combining Top Quark Mass Measurements
The most precise information about the top quark mass comes from combining the measurements from different analyses, taking advantage of the fact that each method is sensitive to different parts of the total available experimental information. We use the BLUE (best linear unbiased estimator) method to correctly account for the correlations among the systematic uncertainties in different analyses. To date, we combine only one analysis from each channel, although work is ongoing to understand the statistical correlation between analyses using the same events so that more measurements can be included in the combination.
4.1 CDF Combination
For this conference, we performed a combination of the CDF run I measurements and the measurements described in Sections 3.1 and 3.4 of this document. The combined top quark mass is , exceeding the precision of the previous world average. The inputs are consistent when all correlations are taken into account: , with a p-value of 28%. CDF’s goal for top quark mass precision in run IIa () was .
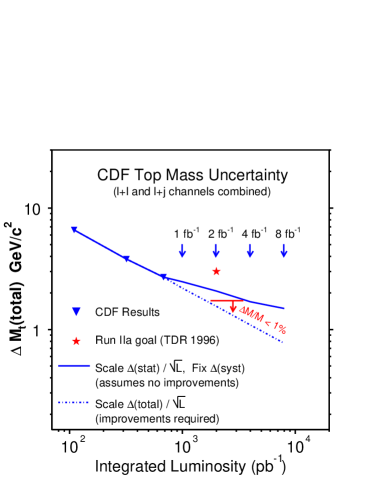
Figure 6, left side, shows an extrapolation of CDF’s past performance on top quark mass measurements into the future. Two scenarios are given, one where systematic uncertainties are fixed and only statistical uncertainties improve with more data; the second where systematic uncertainties continue to improve at the same rate as statistical uncertainties, as has been the case in the past. The real future of CDF top quark mass measurements probably lies somewhere between the two lines.
4.2 Tevatron Combination
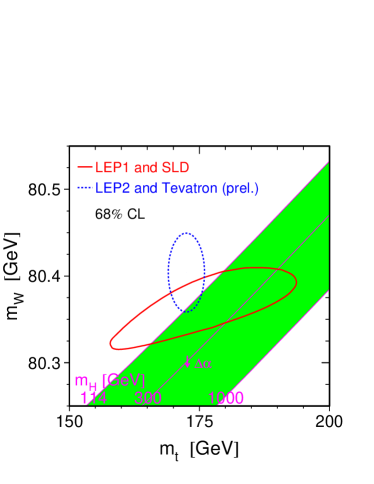
A combination of current CDF and D0 measurements was performed for this conference using the same method. The new world average top quark mass using preliminary measurements from both collaborations is . The effect on the standard model electroweak precision fit is shown in the right plot of Fig. 6, which uses the new combination.
5 Conclusion
CDF has a strong program of top quark mass measurements, which has recently been augmented by a new set of results using . A new combination of current CDF results yields a top quark mass measurement of , putting 1% precision on this important parameter in reach as the experiment continues to accumulate integrated luminosity.
Acknowledgments
We thank the Fermilab staff and the technical staffs of the participating institutions for their vital contributions. This work was supported by the U.S. Department of Energy and National Science Foundation; the Italian Istituto Nazionale di Fisica Nucleare; the Ministry of Education, Culture, Sports, Science and Technology of Japan; the Natural Sciences and Engineering Research Council of Canada; the National Science Council of the Republic of China; the Swiss National Science Foundation; the A.P. Sloan Foundation; the Bundesministerium für Bildung und Forschung, Germany; the Korean Science and Engineering Foundation and the Korean Research Foundation; the Particle Physics and Astronomy Research Council and the Royal Society, UK; the Russian Foundation for Basic Research; the Comisión Interministerial de Ciencia y Tecnología, Spain; in part by the European Community’s Human Potential Programme under contract HPRN-CT-2002-00292; and the Academy of Finland.
References
References
- [1] A. Bhatti et al., hep-ex/0510047.
- [2] D. Acosta et al., Phys. Rev. D 71, 052003 (2005).
- [3] A. Abulencia et al. (CDF Collaboration), Phys. Rev. D 73, 032003 (2006).
- [4] C. S. Hill et al., Phys. Rev. D 71, 054029 (2005).
- [5] L. Lyons et al., Nucl. Instrum. Meth. A270, 110 (1988); A. Valassi, Nucl. Instrum. Meth. A500, 391 (2003).
- [6] Tevatron Electroweak Working Group, hep-ex/0603039.