Measurement of the Top Quark Mass with a Matrix Element Method in the Lepton Plus Jets Channel at CDF
We present a measurement of the mass of the top quark from collisions at 1.96 TeV observed with the Collider Detector at Fermilab (CDF) at the Fermilab Tevatron Run II. The events have the decay signature of in the lepton plus jets channel in which at least one jet is identified as coming from a secondary vertex and therefore a -hadron. The largest systematic uncertainty, the jet energy scale (JES), is convoluted with the statistical error using an in-situ measurement of the hadronic boson mass. We calculate a likelihood for each event using leading-order and +jets cross-sections and parameterized parton showering. The final measured top quark mass and JES systematic is extracted from a joint likelihood of the product of individual event likelihoods. From 118 events observed in 680 pb-1 of data, we measure a top quark mass of (stat+JES) (syst) GeV/c2.
1 Introduction
The top quark mass is a fundamental parameter in the Standard Model. Along with the mass of the boson, the top quark mass provides the best indication for the value of the Higgs boson mass. This is a preliminary measurement of the top quark mass in collisions at TeV with the CDF detector at Run II of the Fermilab Tevatron.
At the Tevatron, top quarks are mainly produced in pairs: 85% by annihilation and the rest by fusion. Top quarks decay before hadronization most of the time into a quark and a boson. The bosons decay leptonically or hadronically and are used to topologically classify the final state of the system. We use events where one boson decays hadronically and the other leptonically – the “lepton + jets” channel. Since taus have poor resolution, we include only electrons and muons and thus sample from 30% of the total branching ratio.
This analysis uses a matrix-element analysis technique to efficiently extract information from the limited number of events. Each event enters the analysis with a weight derived from the differential cross-section for decay. We take into account all the possible jet-parton assignments and integrate over unknown quantities such as the momentum of the neutrino. The mass of the hadronically decaying boson is measured and constrained with the current world average of 80.4 GeV/c2 to measure the jet energy scale (JES) of the events. The jet energy scale is the largest source of systematic uncertainty in this analysis. The final top quark mass is extracted from a simultaneous fit of the top quark mass and JES.
2 Data Sample & Event Selection
Events from the lepton + jets decay channel are selected requiring a single, high-transverse energy, well-isolated lepton; large missing transverse energy; and exactly four, central, high-transverse energy jets. (Two jets originate from the quarks and two from the hadronically decaying boson.) Of these jets, we require at least one to be “-tagged,” identified as originating from a secondary vertex and thus the decay of a long lived hadron. The primary vertex is the one from which tracks associated with the lepton emerge. The secondary vertex tag identifies tracks originating from a vertex displaced from the primary vertex and associated with a jet. To reduce the amount of non- background, we further require the leading jet and missing transverse energy not be collinear in the transverse plan for the lowest values of missing transverse energy passing our selection. Table 1 outlines this event selection.
| lepton | GeV (), GeV/c () |
|---|---|
| jets | GeV, |
| missing | missing GeV |
| -tag | jet coming from secondary vertex |
| QCD veto | (missing GeV) |
3 Method
We write a likelihood for each event by combining a signal probability with a background probability. This method was first used to measure the top mass by the DØ collaboration during Run I . The likelihood is minimized for three variables: the top quark mass, the jet energy scale (JES), and the fraction of events consistent with our signal hypothesis (), where are the measured quantities:
| (1) |
We first minimize the likelihood for with MINUIT and then perform a two dimensional fit to extract and . The signal probability, , indicates how well an event describes leading order pair production and decay, and the background probability, , indicates how well an event describes the largest contributing background process, a leptonically decaying boson plus extra jets. These probabilities are calculated by integrating over the parton differential cross-section, where the measured quantities are input to detector resolution functions, , used to transfer the parton quantities, , to measured quantities, and we also include parton distribution functions, , for collisions:
| (2) |
We use an analytical form of the leading order matrix-element for in the signal probability and the sum of the + 4 jets matrix-elements of the VECBOS Monte Carlo generator in the background probability.
Our input measured quantities are the momentum of the lepton and the angles and energies of the jets. Regarding detector resolution, we consider the momentum of the electron or muon and the jet angles to be well measured. Thus, the detector resolution in Equation 2 corresponds to the jet energy resolution, which is modeled from Monte Carlo using a “transfer function,” a mapping between jet energies and parton energies, . Signal and background probabilities are summed over all possible permutations of jet and parton combinations, and the signal probability also considers different possible values of the transverse momentum of the system.
We are sensitive to the jet energy scale through the mass of hadronically decaying boson by constraining it with the world average boson mass of 80.4 GeV/c2. We define the JES as a multiplicative scale factor applied to the energies of the two jets selected as the daughters of the boson decay:
| (3) |
The constraint comes from integrating over the event mass set by the daughters of the boson and the JES in a Breit-Wigner using the world average value as the pole mass. We assume the JES determined for -jets also applies to jets and assign a systematic uncertainty for the difference between the and jet energy scale.
4 Systematic Uncertainties
| Source of systematic uncertainty | Magnitude (GeV/c2) |
|---|---|
| Residual jet energy scale | 0.42 |
| b-jet energy scale | 0.60 |
| Generator | 0.19 |
| Initial state radiation | 0.72 |
| Final state radiation | 0.76 |
| b-tag dependence | 0.31 |
| Background composition | 0.21 |
| Parton distribution functions | 0.12 |
| Monte Carlo statistics | 0.04 |
| Total | 1.35 |
Table 2 lists the systematic uncertainties estimated from various Monte Carlo samples and re-weighting techniques. To first order, we fit out the JES systematic of our likelihood, but we also apply a residual systematic to cover an higher order effects, such as variations in the expected or distribution. This higher order effect is estimated by shifting the input jet energies up and down one sigma as defined by the CDF Jet Energy and Resolution group . The generator systematic uncertainty takes into account differences in the fragmentation and showering by comparing two different Monte Carlo models (PYTHIA and HERWIG). Possible biases originating from differences in the amount of initial- and final-state radiation between data and Monte Carlo are estimated using PYTHIA samples generator with lesser or greater amounts of radiation. The uncertainty on the parton distribution functions is evaluated as the sum in quadrature of the difference between MRST and CTEQ parton distribution functions; MRST with MeV and MeV; and the variation of the 20 CTEQ6 eigenvectors. Systematic effects from the dependence of the -tagging on are evaluated by changing the dependence by one sigma. The background composition and modeling systematic error is the sum in quadrature of the largest variation when fluctuating the contribution of each individual background sample by 100%; the change in the signal fraction by %; and the largest variation due to changing the scale in + jet production. To understand the effects of limited statistics in the background sample, we divide the smallest sample (non- background) in half and compare the results using each half separately. We repeat this procedure several times and histogram the difference. We take one-half the RMS of the distribution as a systematic error.
5 Results
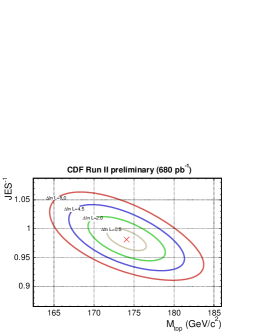
The output likelihood is a simultaneous fit to three parameters: top quark mass, jet energy scale (JES) and signal fraction (). We do not use any prior knowledge of JES or in the extraction of the top mass. The data used in the analysis corresponds to that collected in the period between March 2002 and September 2005, a total integrated luminosity of 680 pb-1, where 118 events pass event selection. Figure 1 shows the fit to this data after minimization for as a function of and with different contours. Our measurement is:
| (4) |
References
References
- [1] F. Abe, et al., Nucl. Instrum. Methods A 271, 387 (1988); D. Amidei, et al., Nucl. Instrum. Methods A 350, 73 (1994); F. Abe, et al., Phys. Rev. D 52, 4784 (1995); P. Azzi, et al., Nucl. Instrum. Methods A 360, 137 (1995); The CDFII Detector Technical Design Report, Fermilab-Pub-96/390-E.
- [2] DØ Collaboration, V.M. Abazov, et al, Nature 429 (2004); DØ Collaboration, V.M. Abazov, et al., Phys. Lett. B , 617 (2005).
- [3] T. Sjostrand et al., High-Energy-Physics Event Generation with PYTHIA 6.1, Comput. Phys. Commun. 135, 238 (2001).
- [4] G. Corcella et al., HERWIG 6: An Event Generator for Hadron Emission Reactions with Interfering Gluons (including supersymmetric processes), JHEP 01, 10 (2001).
- [5] A. Bhatti, F. Canelli, B. Heinemann, et al., Determination of the Jet Energy Scale at the Collider Detector at Fermilab, hep-ex/0510047 (2005).