C.C.Wang
Department of Physics, National Taiwan University,
No.1, Sec.4, Roosevelt Rd., Taipei, Taiwan, 106
Abstract
We report the recent results from Belle with KEKB accelerator
and Babar with PEP-II accelerator. The analysis of ,
and are included in this report.
These decay modes are related to the CKM angle
and the method of extraction of corresponding decays are also
included.
After combining all the decay modes, the constraint of is
.
I Introduction
In the Standard Model (SM), violating effects
in the B meson system can be parameterized in terms of
three Cabibbo-Kobayashi-Maskawa (CKM) bib:KM phase angles
, and (which can be also written
as , and
, respectively).
The angle
can be extracted via the .
Approaches for extraction
from the isospin analysis, and
, and the time-dependent Dalitz analysis, are reported in
this document.
The experimental measurements are from B-factories, Belle detector with KEKB
accelerator and Babar detector with PEP-II accelerator. These two detectors
are general purpose detectors with energy-asymmetric accelerators.
The Belle detector consists of a silicon vertex detector
(SVD), a central drift chamber (CDC), an array of aerial threshold
Čerenkov counters (ACC), time-of-flight scintillation counters (TOF),
and an electromagnetic calorimeter (ECL) comprised of CsI(Tl) crystals located
inside a superconducting solenoid coil
that provides a 1.5 T magnetic field. An iron flux return located outside of
the coil is instrumented to detect mesons and identify muons.
The Babar detector contains silicon vertex tracker (SVT), drift chamber,
electromagnetic calorimeter, ring-imaging Čerenkov detector (DIRC) and
a 1.5 T solenoid superconducting magnet.
II
In the decay, the time dependent rate is described by
(1)
The notation is used by Belle collaboration which is
the same as used by Babar collaboration.
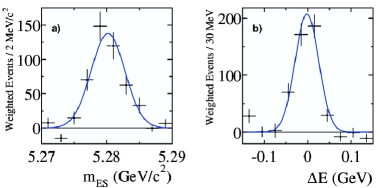
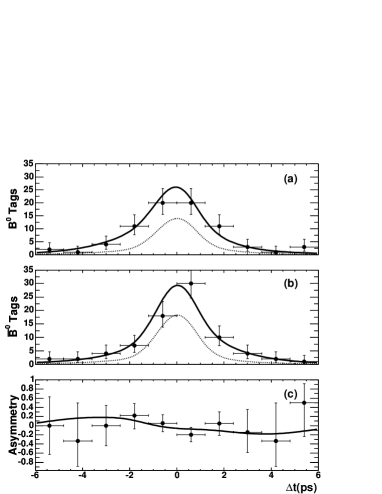
Figure 1: distributions in the signal region
(5.271 GeV/c2 5.287 GeV/c2) for
candidates with for (a)
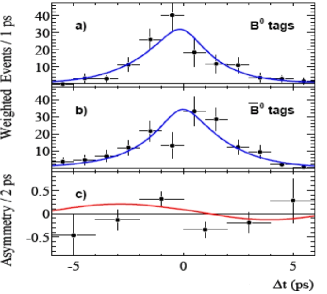
and (b) from Belle. Figure 2: The Belle distributions
for the candidates with in the signal region
(5.271 GeV/c2 5.287 GeV/c2 and
0.064GeV). (a) and (b) .
Raw asymmetry, , in each bin with
(c) 0r0.5 and (d)0.5r1.0. The solid lines shows the
result of the unbinned maximum likelihood fit.
The analysis uses 253 fb-1 data collected
by Belle bib:belle_pipi . Signal candidates are reconstructed
by opposite charged tracks which are identified as pions and
the pion
identification is based on the combined information from the ACC and the CDC
measurements. meson candidates are selected by using the
energy difference and the beam-energy
constrained mass , where
is the CMS beam-energy, and and are the CMS
energy and momentum of the candidate, respectively.
The flavor of accompanying meson
is identified from the inclusive properties of particles which are not
used for reconstruction. To suppress the continuum
background (; q=u,d,s,c), the likelihood ratio
() of the event topology based on signal MC and sideband data
is used for continuum suppression. The likelihood ratio is optimized separately
for each flavor
tagging quality region. The tagging quality is monitored by variable r.
After applying all above requirement and vertex
reconstruction algorithm, 2820 signal candidates containing
signal events (1486 tags and 1334
tags) are obtained.
The violation parameters
and are determined from the unbinned maximum likelihood fit
to the proper-time difference distribution. They obtained
and
. The
correlation between and
is . Figure 1 and Figure 2
show the result from Belle.
Figure 3: Babar’s (a) and (b) distributions for
. Solid curves represent the corresponding PDFs
used in the fit.Figure 4: Babar’s distributions for .
(c) raw asymmetry for signal events in each bin.
The Babar’s analysis bib:babar_pipi is
based on 211 fb-1 data. Signal candidates are reconstructed from
opposite charged tracks with associated Čerenkov angles ().
The particle identification is primarily accomplished by including
in the maximum-likelihood fit. The kinematic variables and
are used to identify the
signal decays. Here is the momentum and (, )
is the four-momentum of initial state in lab frame. The background
suppression is based on the angle of sphericity axes and Fisher discriminant
formed from the momentum flow relative to thrust axis.
Unbinned extended maximum-likelihood fit is used to extract parameters and the
likelihood function includes event yield, tagging efficiency, ,
, , , and .
The fit yields
and from
events.
Figure 3 and Figure 4
show the result from Babar.
Using the model-independent isospin analysis bib:iso_ana1 ; bib:iso_ana2 ,
the range of for
is excluded by Belle with 94.5% C.L. whereas is excluded by
Babar with 90% C.L.
III
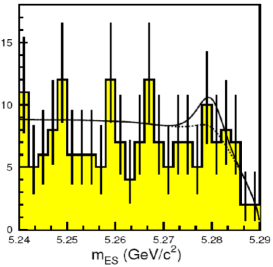
The Babar’s analysis of bib:babar_rho0rho0
is performed with 211 fb-1 data. The reconstruction is made with
four charged tracks and the particle identification is provided
by the combining information from DIRC and SVT. The continuum suppression
is performed based on the angle of thrust axis and neural network output variable
. Unbinned maximum likelihood fit is used to extract the
branching fraction by combining , ,
invariant mass, helicity angle and flavor tagging. From the fit,
they obtain the upper limit of at 90% C.L.
The distribution is shown in Figure 5.
Figure 5: Projection of distribution obtained
at Babar.
The time dependent rate of can be parametrized by
the same form as Eq. 1.
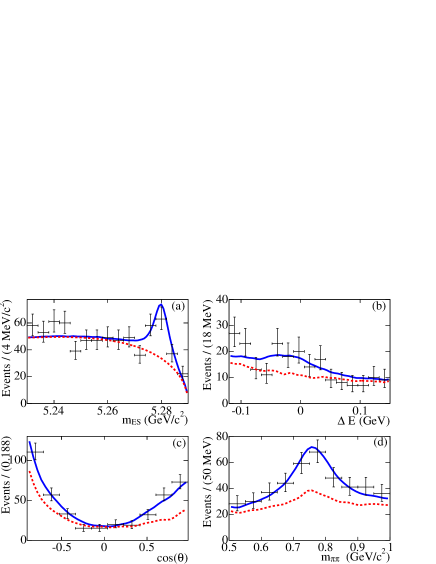
The time-dependent analysis from Babar is performed with
211 fb-1bib:babar_rhorho . Comparing to
analysis, the need an angular analysis to extract the
fraction for longitudinal component ().
An extended maximum-likelihood fit provides
and
time-dependent parameters,
and .
Figure 6 and Figure 7
show the result of Babar’s analysis. From the isospin analysis, Babar
obtains between and
with 90% C.L. which is based on the results of
mentioned above, the branching fraction of
bib:babar_rhorho_iso2 ; bib:babar_rhorho_iso3 and the results
of analysis bib:babar_rhorho_iso1 ; bib:belle_rhorho_iso1 .
Figure 6: The distribution for the high purity events for variables
(a) , (b) , (c) cosine of helicity angle, and
(d) . The dotted curves are the sum for all backgrounds
and the solid lines are the total PDF.Figure 7: The distribution for the signal enriched sample. (a) is tagged
and (b) is tagged events. (c) is the raw asymmetry.
The time-dependent analysis from Belle is based on
253 fb-1bib:belle_rhorho .
First, the longitudinal component
fraction , , and
time-dependent parameters,
and , are obtained.
Figure 8, Figure 9 and
Figure 10 show the result of Belle’s analysis.
Combining other related results bib:babar_rho0rho0 ; bib:babar_rhorho_iso2 ; bib:belle_rhorho_iso2 ,
Belle obtain with 90% C.L.
Figure 8: (a) projection in
region. (b)
projection in signal region.
The dashed, dotted, dot-dashed, small solid and large solid curves show
, , , and the total,
respectively.Figure 9: (a) projection.
(b) sum of two cosine helicity angle distribution. Both plots
are inside
signal region and satisfy .
The dashed, dot-dashed, dotted and solid curves represent ,
, + + and the total, respectively.
Figure 10: The distribution inside
signal region and satisfy .
(a) and (b) are the tagged and tagged events. (c)
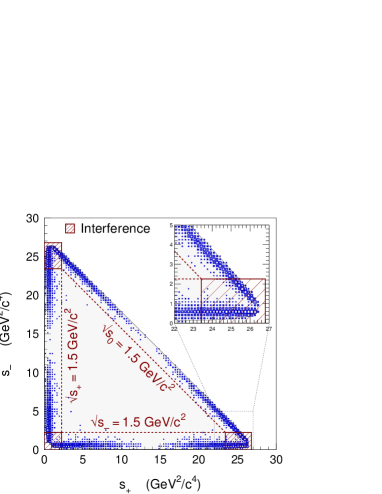
is raw asymmetry for the events satisfy 0.5r1.0. Figure 11: The Dalitz plot from Monte Carlo without detector simulation.
, and are generated with equal amplitudes.
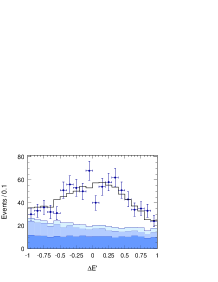
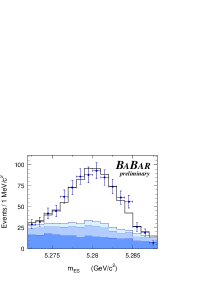
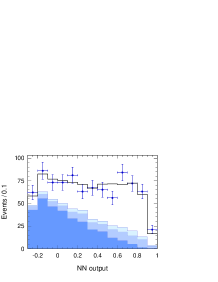
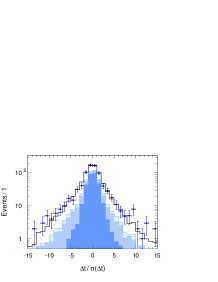
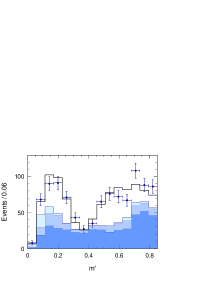
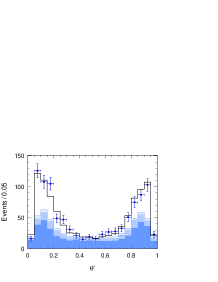
Figure 12: Distribution of , , neural network output,
, m’ and . The dark, medium and
light shaded areas represent the contribution from continuum events, the sum of continuum
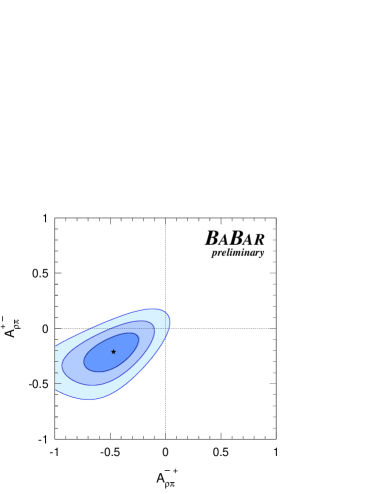
events and the background, and the mis-reconstructed signal events, respectively.Figure 13: Confidence level contours for the direct violation. The shaded areas
represent 1, 2 and 3 contours, respectively. The and
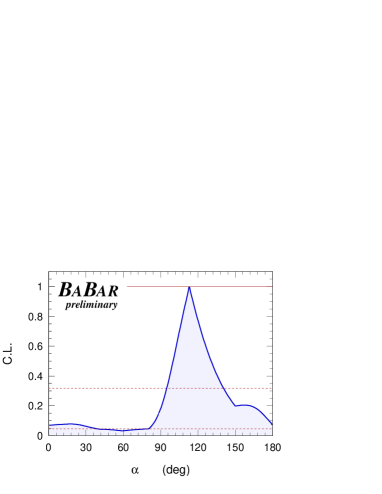
here correspond to the Belle’s and , respectively.Figure 14: Confidence level functions for . The dashed horizontal
lines corresponds to 1 and 2 C.L.
IV
Besides and decays, the quasi-two-body analysis for
decay
is another candidate for the extraction. Belle collaboration
performed the time-dependent analysis on with 140 fb-1
and obtained time-dependent parameters,
and
flavor integrated charge asymmetry,
,
and direct violation parameters,
and bib:belle_rhopi .
The branching fraction of is obtained to be
,
and the asymmetry, ,
are obtained by Belle with 357 fb-1 data bib:belle_rho0pi0 .
Besides the quasi-two-body analysis, Babar performs the time-dependent
Dalitz analysis from with final states bib:babar_rhopi
with 192 fb-1 data.
It is the first direct measurement of by assuming isospin symmetry.
The decay amplitude can be expressed as
The , and are functions of invariant mass that
incorporate the kinematic and dynamical properties of the decay into .
The Dalitz plot distribution for Monte Carlo is shown in Figure 11.
The time-dependent rate for and tagged events
are and , respectively. The rates are
given by
There are 27 coefficients for this time dependent Dalitz rate, 9 for exponential,
9 for cosine oscillation and 9 for sine oscillation terms. Since the
branching ratio is very small, the related oscillation
parameters are fixed to be zero and the effect is taken into account by systematics.
Figure 12 shows the projection plots for , ,
neural network output for continuum background suppression,
, m’ and . The
is the transformed to deal with the energy dependence and the
is the event-by-event error on . The m’ and
are transformed Dalitz variables.
The fit yields the direct violation values
and
.
Figure 13 shows the confidence level of direct violation.
obtained from this analysis is
and confidence level
plot is shown in Figure 14.
V Summary
From the , and analysis, Belle
and Babar obtained for each decay separately.
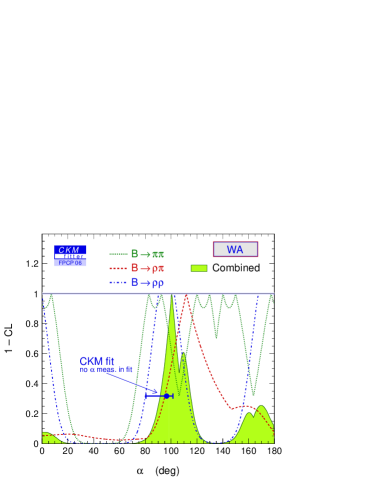
The CKM Fitter Group performs a global fit by properly averaging all the
results and get bib:ckmfitter .
Figure 15 shows the result of this global fit for .
Figure 15: The combined constraint from CKM fitter Group.
References
(1)
M. Kobayashi and T. Maskawa, Progr. Theor. Phys. 49, 652 (1973).
(2)
Belle Collaboration, K. Abe et al., Phys. Rev. Lett. 95, 101801 (2005).
(3)
BaBar Collaboration, B. Aubert et al., Phys. Rev. Lett. 95, 151803 (2005).
(4)
M. Granau and D. London, Phys. Rev. Lett. 65, 3381 (1990).
(5)
J. Charles et al., Eur. Phys. J. C 41, 1 (2005).
(6)
BaBar Collaboration, B. Aubert et al., Phys. Rev. Lett. 94, 131801 (2005).
(7)
BaBar Collaboration, B. Aubert et al., Phys. Rev. Lett. 95, 041805 (2005).
(8)
BaBar Collaboration, B. Aubert et al., Phys. Rev. Lett. 93, 231801 (2004).
(9)
BaBar Collaboration, B. Aubert et al., Phys. Rev. D 69, 031102 (2004).
(10)
BaBar Collaboration, B. Aubert et al., Phys. Rev. Lett. 91, 171802 (2003).
(11)
Belle Collaboration, J. Zhang et al., Phys. Rev. Lett. 91, 221801 (2003).
(12)
Belle Collaboration, A. Samov et al., hep-ex/0601024.
(13)
PDG, S. Eidelman et al., Phys. Lett. B 592, 1 (2004).
(14)
Belle Collaboration, C.C. Wang et al., Phys. Rev. Lett. 94, 121801 (2005).
(15)
Belle Collaboration, J. Dragic et al., hep-ex/0508007.
(16)
BaBar Collaboration, B. Aubert et al., hep-ex/0408099.