Interference Effects in Meson Decays
Abstract
I review recent results on Dalitz plot analyses of meson decays and an analysis that takes advantage of the quantum correlations between meson pairs produced in the decay of the .
I Introduction
Taking advantage of quantum effects in meson decays provides a unique window on the mechanics of such decays. The Dalitz plot analysis technique Dalitz is a unique way to measure decay amplitudes and phases. Not only are these valuable inputs and a challenge to QCD, but also these parameters are necessary to extract fundamental parameters. Specifically see Jean-Pierre Lees’ contribution to these proceedings on the measurement of the CKM angle in charged decays using a Dalitz plot analysis of .
In threshold production via resonance decays, the favored method for meson factories, the product mesons are in an eigenstate of C. Specifically the decay of the produced in collisions are C . This introduces correlations between the decays of the mesons produced in the decay. These depend on amplitudes for doubly Cabibbo suppressed(DCS) decays, -mixing parameters, and strong phases all of which can be measured in samples of decays in which both decays have been identified as a flavor tag, a semileptonic decay, or a CP eigenstate AsnerandSun .
I review results presented since the 2005 summer conference season. There are not a large number with all of them being preliminary results from the CLEO collaboration. The various versions of the experiment are described in detail elsewhere CLEOdet . The work discussed here is based on 9/fb of data collected by the CLEO-III detector operating in the region of the , and 281/pb of data collected by the CLEO-c detector operating at the , corresponding to 1.4 million pairs.
II Dalitz Plot Analysis of
The motivation for this analysis is to measure the strong phase in decays. A constraint on this phase can be used in the measurement of the CKM angle in charged decays as discussed here gamma .
The analysis is done with CLEO-III data and the ’s are produced in continuum production with their flavor tagged by the charge of the soft pion in charged decays. The sample is about 600 events with a signal to noise of about two to one. For the Dalitz plot analysis the charges are swapped such that all the decays are treated as if a is decaying. The Dalitz plot as shown in Figure 1
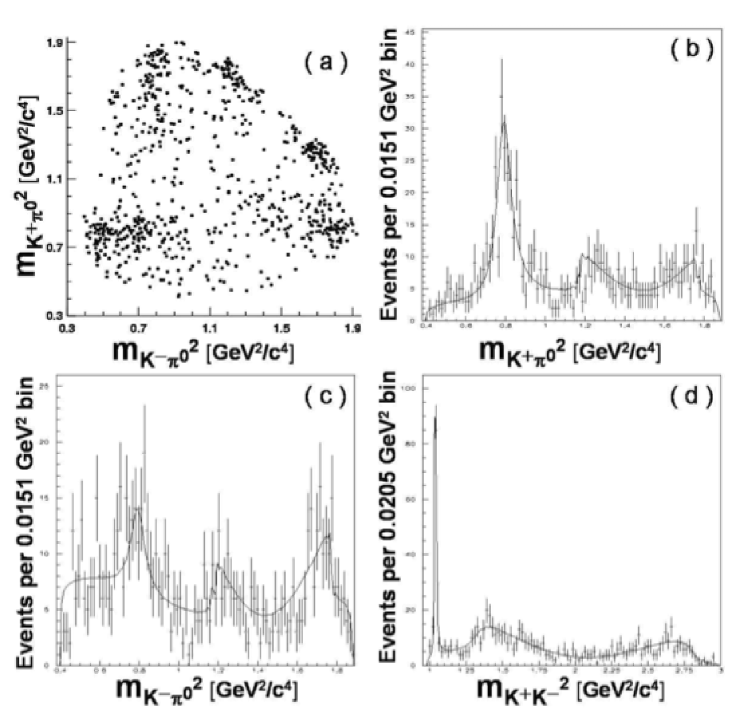
shows clear contributions from both charges of plus an oppositely charged and . The contributions to the Dalitz plot are adequately described by just these three contributions plus a non-resonant amplitude which is assumed to be uniform in phase space and have a fixed phase which does not interfere with the resonant amplitudes. The projections of the Dalitz plot on the three mass combinations are shown in Figure 1 along with the result of a fit with the contributions described above.
Many systematic effects are considered. The largest effects are caused by considering other resonance contributions to the Dalitz plot. None are found to be significant, but they do change the central values for the clearly observed resonances. The background is modeled with mass and mass difference side bands that are then fit to second order two-dimensional polynomials. Allowing the parameters describing the background to vary is the next largest systematic uncertainty. The efficiency across the Dalitz plot is modeled with a simulated sample that is generated uniformly across the Dalitz plot and those passing all the analysis selections are fit to a two dimensional second order polynomial. Again allowing these parameters to vary provide the third largest contribution to the systematic uncertainty. The effect of varying analysis details and procedures on the systematic uncertainty is small compared to the three effects described above.
The analysis is preliminary. Table 1 gives the
| Contribution | Amplitude | Phase (∘) | Fit Fraction (%) |
|---|---|---|---|
| (fixed) | (fixed) | ||
| Non-resonant |
amplitude and phase relative to the contribution for the other contributions, and the fit fraction for all the contributions. Only statistical errors are shown. The phase between and is measured as and the amplitude for relative to is . Even with this small data set the precision is limited by non- contributions to the decay.
III Dalitz Plot Analysis of
A Dalitz plot analysis of has previously been done by E791 791 and FOCUS focus . The analysis reported on here is from CLEO-c, and represents the first time CLEO has done the same Dalitz plot analysis as the fixed target experiments. Previously CLEO has focused on analyses with ’s in the final state. The decay is selected with cuts on the beam constrained mass of three charged tracks consistent with pions and the difference of their energy from the beam energy. A sample of 2600 events is selected with a signal to noise of better than two to one. The E791 and FOCUS samples are of similar size and cleanliness.
The Dalitz plot is symmetric under the interchange of like-sign pions thus the analysis is done in the two dimensions of high unlike-sign pion mass squared versus low unlike-sign pion mass. There is a large contribution from which because of the long lifetime should not interfere with the other contributions to the plot. This stripe on the Dalitz plot is not considered when a fit is done for two body resonance contributions. The efficiency across the Dalitz plot is modeled with simulated events that is then fit to a two-dimensional second order polynomial. While there is a notable fall of the efficiency in the corners of the Dalitz plot the changes are smooth, and well modeled by the polynomial. Backgrounds are taken from sidebands and extra resonance contributions are allowed from mismeasured , , and decays. Many possible resonances can contribute to the decay, and a total of 13 different resonances are considered. Parameters describing these resonances are taken from previous experiments. Only those with an amplitude significant at more than three standard deviations are said to be observed, and others are limited.
Figure 2 shows the Dalitz plot and projections on to
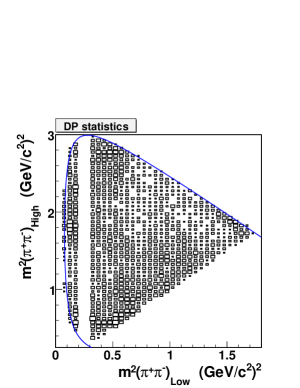
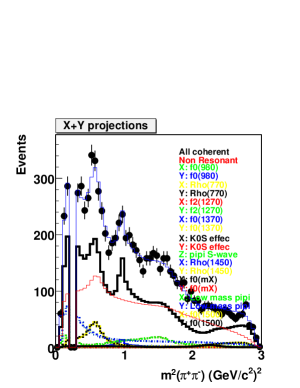
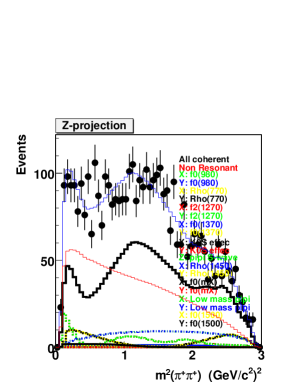
the squared masses. Contributions from and are clearly visible. Table 2 shows the fit fractions measured by CLEO
| Contribution | CLEO | E791 |
|---|---|---|
| Non-resonant | ||
comparing with the results of the E791 analysis mentioned above. There is broad agreement between the two results, including the observation of a contribution. The CLEO analysis is preliminary, and they plan to consider a generalized model of S-wave interactions to model and contributions such as the K-matrix which is used in the FOCUS analysis mentioned above.
IV Quantum Correlations in
meson pairs produced in are in a C eigenstate. Thus if both ’s decay to a mode that tags of the flavor of the meson, such as versus there will be interference. The total rate for such double tags will depend on the DCS rate and the strong phase between the Cabibbo favored and DCS decay. Double flavor tags with the same mode and flavor are forbidden unless there is mixing, and thus the rate for these depends on the mixing parameters , related to the width difference, and , related to the mass difference. Flavor tags opposite semileptonic decays, which are not eigenstates of C, measure the isolated decay rates without the interference effects and have different sensitivity to mixing and the DCS rate. decays to CP eigenstates opposite a flavor tag have yet a different dependence on mixing and the DCS rate. Double CP tags show maximal interference effects with like CP’s being forbidden and opposite CP’s being enhanced. The expected rates are summarized in Table 3 and explained in full detail in AsnerandSun .
| CP | CP | |||
| CP | ||||
| CP | ||||
| X | 1 - y | 1 + y |
Simultaneously this analysis can measure branching fractions which are presently poorly known for many CP eigenstates.
A preliminary version of this analysis is done by CLEO-c. The analysis has three major pieces. Single flavor tags and CP tags are identified using the methods developed for precision measurement of branching fractions Dbranch , and similarly for hadronic double tags. Semileptonics are only measured opposite flavor and CP tags and are generally very clean in flavor tags, but more difficult in CP tags. The effects of the quantum correlation are clearly seen in double CP tags where for three CP modes (, , and ) and one CP mode () like CP tags would be expected in the absence of any correlations and are observed. For opposite CP tags are expected in the absence of quantum correlation and are observed. Table 4 shows results with statistical errors
| Parameter | CLEO QCA | Present Knowledge |
|---|---|---|
for mixing and DCS parameters and the strong phase from the full analysis compared with the present knowledge from other experiments. While at this stage the analysis is not competitive CLEO projects that with their full data set it will be producing results with a precision similar to world averages and with an orthogonal set of systematic uncertainties. This analysis depends on the assumption that the pairs observed from the are in the C state, and they preliminarily measure the rate of CP states from decay at , where the error is only statistical. Theoretical expectations are orders of magnitude below this.
V Conclusion
Quantum correlations in charm decays provide a unique opportunity to study the details of decay dynamics. Here I have shown two recent Dalitz analyses that build on previous work and are probing strong phases and strong dynamics at new levels of precision. Also I have shown how quantum correlations in threshold production give unique leverage and provide alternative ways to measure rare behavior in the charm sector. We can hope that results in this fascinating field continue to multiply to enlighten and challenge our colleagues.
VI Acknowledgment
Thanks to the organizers for a very well run, interesting, and enjoyable conference. Specific thanks to Jeff Appel, David Asner, and Chris Hearty. My research activities are supported by the U.S. National Science Foundation.
References
- (1) R.H.Dalitz, Phil. Mag. 44 (1953) 1068.
- (2) D.Asner and W.Sun, Phys. Rev. D 73 (2006) 034024.
- (3) G. Viehhauser CLEO III Operation, Nucl. Instrum. Methods A 462, 146 (2001) and R.A. Briere et al. (CESR-c and CLEO-c Taskforces, CLEO-c Collaboration), Cornell University, LEPP Report No. CLNS 01/1742 (2001) (unpublished).
- (4) Y.Grossman, Z.Ligetti, and A.Soffer, Phys. Rev. D 67 (2003) 07130, and J.Rosner and D.Suprun, Phys. Rev. D 68 (2003) 054010.
- (5) E.M.Aitala et al. (Fermilab E791 Collaboration), Phys. Rev. Lett. 86 (2001) 770.
- (6) J.M.Link et al. (FOCUS Collaboration), Phys. Lett. B 585 (2004) 200.
- (7) Q.He et al. (CLEO Collaboration), Phys. Rev. Lett.95 (2005) 121801.