R. A. Briere
I. Brock
Current address: Universität Bonn, Nussallee 12, D-53115 Bonn
J. Chen
T. Ferguson
G. Tatishvili
H. Vogel
M. E. Watkins
Carnegie Mellon University, Pittsburgh, Pennsylvania 15213
J. L. Rosner
Enrico Fermi Institute, University of
Chicago, Chicago, Illinois 60637
N. E. Adam
J. P. Alexander
K. Berkelman
D. G. Cassel
J. E. Duboscq
K. M. Ecklund
R. Ehrlich
L. Fields
R. S. Galik
L. Gibbons
R. Gray
S. W. Gray
D. L. Hartill
B. K. Heltsley
D. Hertz
C. D. Jones
J. Kandaswamy
D. L. Kreinick
V. E. Kuznetsov
H. Mahlke-Krüger
T. O. Meyer
P. U. E. Onyisi
J. R. Patterson
D. Peterson
J. Pivarski
D. Riley
A. Ryd
A. J. Sadoff
H. Schwarthoff
X. Shi
S. Stroiney
W. M. Sun
T. Wilksen
M. Weinberger
Cornell University, Ithaca, New York 14853
S. B. Athar
R. Patel
V. Potlia
H. Stoeck
J. Yelton
University of Florida, Gainesville, Florida 32611
P. Rubin
George Mason University, Fairfax, Virginia 22030
C. Cawlfield
B. I. Eisenstein
I. Karliner
D. Kim
N. Lowrey
P. Naik
C. Sedlack
M. Selen
E. J. White
J. Wiss
University of Illinois, Urbana-Champaign, Illinois 61801
M. R. Shepherd
Indiana University, Bloomington, Indiana 47405
D. Besson
University of Kansas, Lawrence, Kansas 66045
T. K. Pedlar
Luther College, Decorah, Iowa 52101
D. Cronin-Hennessy
K. Y. Gao
D. T. Gong
J. Hietala
Y. Kubota
T. Klein
B. W. Lang
R. Poling
A. W. Scott
A. Smith
University of Minnesota, Minneapolis, Minnesota 55455
S. Dobbs
Z. Metreveli
K. K. Seth
A. Tomaradze
P. Zweber
Northwestern University, Evanston, Illinois 60208
J. Ernst
State University of New York at Albany, Albany, New York 12222
H. Severini
University of Oklahoma, Norman, Oklahoma 73019
S. A. Dytman
W. Love
V. Savinov
University of Pittsburgh, Pittsburgh, Pennsylvania 15260
O. Aquines
Z. Li
A. Lopez
S. Mehrabyan
H. Mendez
J. Ramirez
University of Puerto Rico, Mayaguez, Puerto Rico 00681
G. S. Huang
D. H. Miller
V. Pavlunin
B. Sanghi
I. P. J. Shipsey
B. Xin
Purdue University, West Lafayette, Indiana 47907
G. S. Adams
M. Anderson
J. P. Cummings
I. Danko
J. Napolitano
Rensselaer Polytechnic Institute, Troy, New York 12180
Q. He
J. Insler
H. Muramatsu
C. S. Park
E. H. Thorndike
University of Rochester, Rochester, New York 14627
T. E. Coan
Y. S. Gao
F. Liu
Southern Methodist University, Dallas, Texas 75275
M. Artuso
S. Blusk
J. Butt
J. Li
N. Menaa
R. Mountain
S. Nisar
K. Randrianarivony
R. Redjimi
R. Sia
T. Skwarnicki
S. Stone
J. C. Wang
K. Zhang
Syracuse University, Syracuse, New York 13244
S. E. Csorna
Vanderbilt University, Nashville, Tennessee 37235
G. Bonvicini
D. Cinabro
M. Dubrovin
A. Lincoln
Wayne State University, Detroit, Michigan 48202
D. M. Asner
K. W. Edwards
Carleton University, Ottawa, Ontario, Canada K1S 5B6
Abstract
From collision data acquired with the CLEO-c detector at CESR,
we search for the non- decays ,
with reconstructed in four
exclusive decays modes containing charged pions and kaons.
We report the first observation of such decays for
with a branching ratio of .
The rates for different are consistent with
the expectations assuming is predominantly a state
of charmonium, but only if relativistic corrections are applied.
pacs:
14.40.Gx, 13.20.Gd, 13.20.-v
††preprint: CLNS 06/1955††preprint: CLEO 06-04
Observation of the narrow and states XY
above open charm threshold, and their possible interpretation as
states beyond the traditional model of
charmonium charmonium ,
calls for thorough investigation of the
lightest charmonium state above the threshold - .
The common interpretation of the assumes it is
predominantly the state, with a small admixture
of . Except for the large decay width and
rough agreement with the potential model mass predictions,
there have been no other experimental data to verify this assumption.
Although decays of to ,
and have been measured to be non-zero BES ; gammaee ,
such hadronic modes present a less sensitive probe of the
charmonium model than rates for
since they involve
hadronization probabilities.
Previously, we have reported observation of
with ,
psipp2gX1 .
The branching ratio for
is predicted to be the
largest Chao ; Rosner ; Eichten ; Barnes , but the small branching ratio for
reduces the sensitivity so much that
only a loose upper limit could be set in Ref. psipp2gX1 .
However, hadronic decays are copious and thereby offer
complementary probes for these photon transitions.
Backgrounds from decays and continuum processes are suppressed
by full reconstruction of decays to
a few exclusive hadronic final states.
We use the following decay modes:
,
,
and
.
To minimize sensitivity to large uncertainties in branching fractions and
resonant substructure for these channels, we measure the rates relative to
those seen in decays with the same detector,
and normalize to
psip2gXj ,
which was measured by fitting
inclusive photon energy spectra.
Thus, our results for
are not only
independent of , but also
depend only on ratios of detection efficiencies for
and . The latter are almost independent of the resonant
substructure and, therefore, can be more reliably determined.
The data were acquired at a center-of-mass energy of 3773 MeV with
the CLEO-c detector CLEOdet operating at the Cornell Electron
Storage Ring (CESR), and correspond to an integrated luminosity
(number of resonant decays) of 281 pb-1 ()
at the and 2.9 pb-1 ()
at the .
The CLEO-c detector features a solid angle coverage of 93% for charged
and neutral particles. The cesium iodide (CsI) calorimeter attains
photon energy resolutions of 2.2% at GeV and 5% at
100 MeV. For the data presented here, the charged particle tracking
system operates in a 1.0 T magnetic field along the beam axis and
achieves a momentum resolution of 0.6% at p = 1 GeV.
Particle identification is performed using Ring-Imaging Cherenkov
Detector (RICH) in combination with specific ionization loss (dE/dx) in
the gaseous tracking volume.
Table 1: Efficiencies for ,
, based on Monte Carlo of phase-space
decays (i.e. no intermediate resonances).
Efficiency (%)
We select events with exactly 6, 4 or 2 charged
tracks and at least one photon candidate with energy
above 60 MeV.
The highest energy photon is considered to be the signal photon,
while other neutral clusters in the calorimeter
are considered fragments of hadronic
showers, and therefore ignored. We separate pions and kaons using
a log-likelihood difference, which optimally combines the dE/dX and RICH
information. The track is considered a kaon if the kaon hypothesis
is more likely. The RICH information is used only if the track
momentum is above kaon radiation threshold (700 MeV) and the number of
Cherenkov photons for the kaon hypothesis is required to be at least 3
in this case. We also impose 3 consistency on dE/dx. Those
tracks not identified as kaons become pion candidates if they
satisfy 3 consistency with dE/dX. Events with odd numbers
of kaons or pions are rejected. The total energy and Cartesian
components of momentum of the selected charged particles and the
photon must be consistent within MeV with the expected
center-of-mass four-vector components, which take into account a small beam
crossing angle. To improve resolution on the photon energy,
we then constrain these quantities to the expected
values via kinematic fitting of events.
Selection efficiencies obtained with GEANTGEANT
based simulation of detector response are given in Table 1.
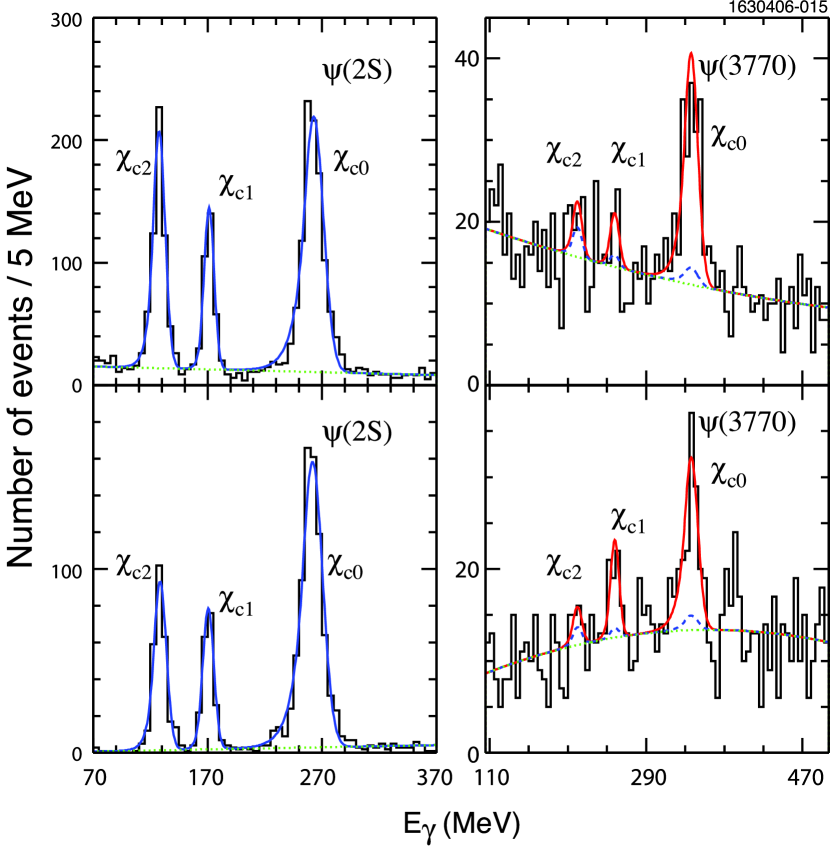
Figure 1:
Distribution of photon energy for (top) and
(bottom) decay samples in CLEO-c (left) and
(right) data.
Solid histogram is data,
smooth curve is fit to the data.
Dashed line shows radiative return
background contribution from tail and
dotted line is polynomial background.
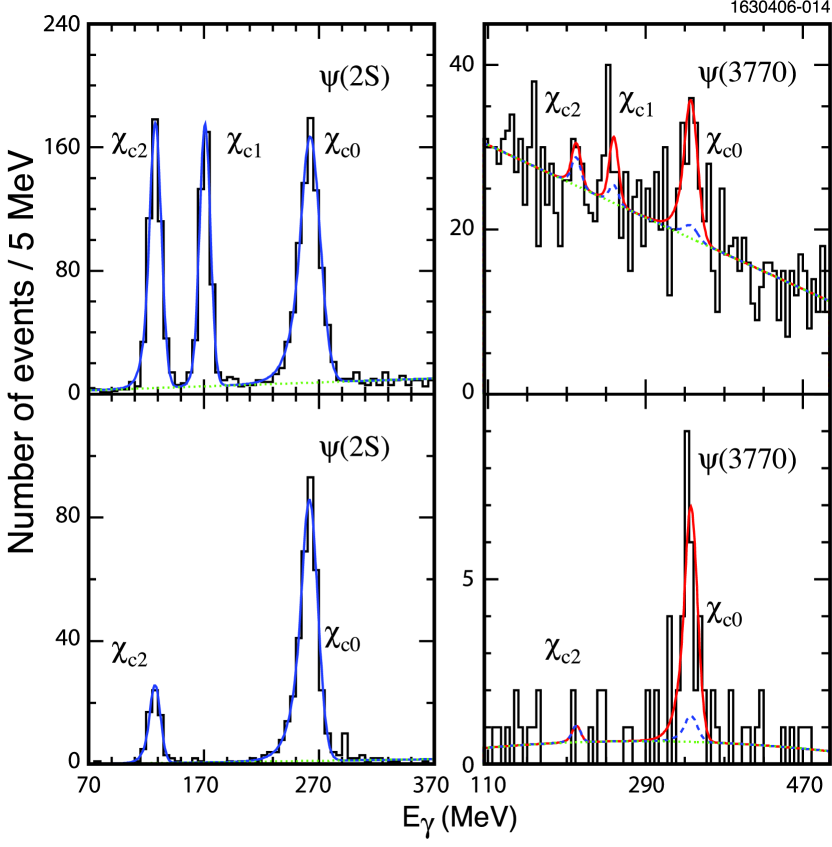
Figure 2: Distribution of photon energy for (top) and
(bottom) decay samples in CLEO-c (left) and
(right) data.
Solid histogram is data,
smooth curve is fit to the data.
Dashed line shows radiative return
background contribution from tail and
dotted line is polynomial background.
The energy of the photon candidates is plotted for the data for different
decay channels in Fig. 1 and
Fig. 2. Fits used to extract signal amplitudes are
also shown.
Each photon line is represented by a detector
response function, parameterized by the so-called Crystal Ball line
(CBL) shape. CBL is a Gaussian (described by the peak energy,
, and energy resolution, ) turning into a power
law tail, , at an energy of
. We fix
and to the values determined from the signal Monte Carlo.
The peak amplitude (),
peak energy and widths are free parameters in
the fit to the data.
The smooth background is represented by a first order polynomial.
In the fit to the data only the
peak amplitudes () are free
parameters, while the CBL parameters are fixed to the
predictions from the signal Monte Carlo.
In addition to the smooth backgrounds, represented by a second order
polynomial, the data
also contain radiatively produced background.
After our selection cuts, the latter cannot be distinguished from the
signal. They are explicitly represented in the fit by peaks with
the amplitudes, ,
fixed to the values estimated from the
data () and
extrapolated to the beam energy with help
of the theoretical formulae:
Here, we are using the same notation as in Ref. gammaee :
is the integrated luminosity;
is the efficiency;
is the branching ratio for
( is the hadronic final
state) at the resonance peak; is energy radiated in
divided by its maximal possible value
(i.e. by ); is the mass-squared with which
the is produced (); is the initial
state radiation probability (see Ref. gammaee for the
definition and discussion); is the relativistic Breit-Wigner
formula describing the resonance
(); and
is the phase-space factor between the produced
with mass and with its nominal mass, .
is equal E1 to
, where is
the photon energy in decay. The
nominal mass () and total width () are
taken from PDG PDG ,
while is taken from the CLEO
determination utilizing at
MeV with
decaying to through a hadronic
transition gammaee . The radiative flux, , strongly peaks for
making the background indistinguishable from
the signal within our photon energy resolution.
Unlike in our analysis psipp2gX1 ,
where we used the published CLEO results for
and relied on the absolute value of the detection efficiency
(), in this analysis we set
where is the signal
yield in the fit to the data. Therefore, our estimates of
the radiative tail background,
do not rely on absolute values of efficiencies, but only on their
ratio between the and data samples. The
upper range of integration in the definition of is
MeV/ MeV=, because of our cuts on
total energy and momentum.
The signal yields in the and data
are given in
Table 2.
Table 2: Fitted signal yields for
,
. The total number of the estimated
background events in the data
() is also given.
The errors on the latter quantities are systematic.
All other errors are statistical.
Decay
Events
Mode
All
All
All
The results for the ratio of branching ratios, ,
for individual decay modes
are given in Table 3. Average values are calculated
using inverse-of-statistical-errors-squared for weights. To estimate
the statistical significance of signals,
we fit the data with the background contribution alone
and compare the fit likelihoods to our nominal fits. Combining
likelihoods for all the channels, we obtain statistical significance
of and standard deviations for , and ,
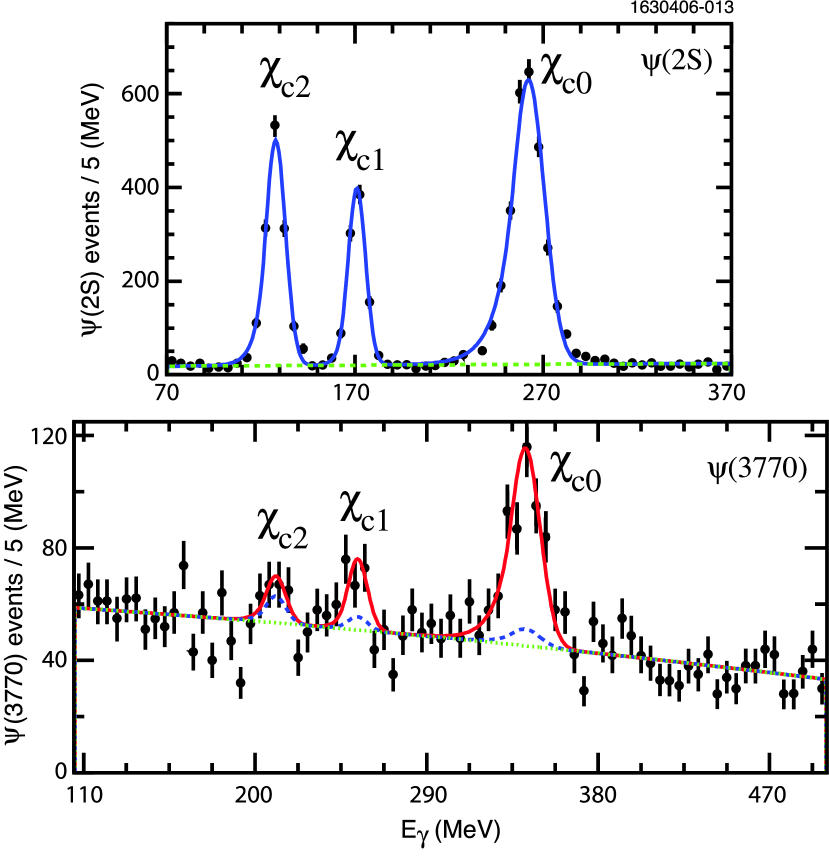
respectively. The sum of the photon spectra over the individual channels
is shown for and data in
Fig. 3. Since no significant signal is observed for
, we set an upper limit for this state.
Figure 3: Distribution of photon energy in CLEO-c (top)
and (bottom) data summed over all analyzed modes (data
points). The smooth curve shows the sum of the fits performed to the
individual modes. The dashed curve shows the radiative tail from
. The dotted line shows the polynomial background.
Table 3: The ratio
. Only
statistical errors are given here.
Decay
in %
mode
Average
Table 4: Systematic errors and their sources.
Relative change in %
Luminosity
cross-section
Number of decays
Resonant substructure
change in bkg.
Fit systematics
change in
change in fit range
Using Gaussian signal shape
Decreasing bin-size to half
order of bkg. polynomial
Total fit systematics
Total systematic error on
Number of decays
Total systematic error on
Various contributions to the systematic errors are
listed in Table 4.
We simulated signal events assuming various
resonant substructures and compared
the efficiency ratio to our nominal values
obtained with the phase-space model
to evaluate the error in efficiency simulation.
Including the systematic errors, our results for
the ratio of branching ratios are:
,
and
(90% C.L.).
The 3% uncertainty in the number of
resonant decays contributes to the measurement, but
cancels when multiplied by the
inclusively measured psip2gXj .
The results for
are ,
and (90% C.L.) for and , respectively.
They are consistent with the results obtained previously
by CLEO psipp2gX1
using decays:
(90% C.L.), and
(90% C.L.), correspondingly.
The two analyses are complementary.
While this analysis offers much better sensitivity for ,
the previous analysis is more sensitive for and .
The signal is observed in both analyses.
Combining both analyses we obtain
.
We turn the branching ratio results to transition widths using
MeV from PDG PDG .
The results are given in Table 5, where they are
compared to theoretical predictions.
Table 5: Our measurements
of the photon transitions widths
(statistical and systematic errors)
compared to theoretical predictions.
The measurement comes from this analysis.
The upper limit comes from Ref.psipp2gX1 .
The measurement comes from the combination of this analysis and
of the result in Ref.psipp2gX1 .
The theoretical predictions are based on
potential model calculations E1
of the electric dipole matrix element :
where is the quark charge and is the fine structure
constant. The spin factors are equal to
, and for , and ,
respectively KwongRosner .
The phase-space factor () also favors the
transition. Together, the spin and phase-space factors predict
enhancement of the width
by a factor of and over and
, respectively.
In the non-relativistic limit, the matrix element is
independent of .
The measured ratios of the widths,
and (90% C.L.),
are consistent with these crude predictions,
therefore, providing further evidence that is
predominantly a state.
A small admixture of wave, necessary to explain the observed
,
is expected to increase and while making
smaller Chao ; Rosner .
The large experimental and theoretical uncertainties in
make testing of
the mixing hypothesis via radiative transitions
difficult.
As evident from Table 5, the naive
non-relativistic calculations tend to overestimate
absolute values of the transition rates.
Relativistic Chao ; Barnes or coupled-channel Eichten
corrections are necessary for quantitative agreement with the
data.
The latter is not surprising since non-relativistic calculations
also overestimate
transition rates Skwarnicki .
We gratefully acknowledge the effort of the CESR staff
in providing us with excellent luminosity and running conditions.
This work was supported by
the A.P. Sloan Foundation,
the National Science Foundation,
the U.S. Department of Energy, and
the Natural Sciences and Engineering Research Council of Canada.
References
(1)
(2)
Belle Collaboration,
S. K. Choi et al.,
Phys. Rev. Lett. 91, 262001 (2003);
BABAR Collaboration,
B. Aubert et al.,
Phys. Rev. D73, 011101(R) (2006);
CLEO Collaboration,
T. E. Coan et al.,
Phys. Rev. Lett. 96, 162003 (2006).
(3)
T. Appelquist, A. de Rujula, H. D. Politzer,
Phys. Rev. Lett. 34, 43 (1975);
C. G. Callan, R. L. Kingsley, S. B. Treiman, F. Wilczek, A. Zee,
Phys. Rev. Lett. 34, 52 (1975);
T. Appelquist, A. de Rujula, H. D. Politzer,
Phys. Rev. Lett. 34, 365 (1975);
E. Eichten, K. Gottfried, T. Kinoshita, J. Kogut, K. D. Lane, T.-M. Yan,
Phys. Rev. Lett. 34, 369 (1975).
(4)
BES Collaboration,
J.Z. Bai et al.,
Phys. Lett. B605, 63 (2005).
(5)
CLEO Collaboration,
N.E. Adam et al.,
Phys. Rev. Lett. 96, 082004 (2006).
(6)
CLEO Collaboration, T. E. Coan et al.,
Phys. Rev. Lett. 96, 182002 (2006),
arXiv:hep-ex/0509030.