Search for rare decays of the Meson at the Tevatron
![[Uncaptioned image]](/html/hep-ex/0605065/assets/x1.png)
We report on searches for Flavor-Changing Neutral Current (FCNC) decays in collisions at a center-of-mass energy of 1.96 TeV using up to 0.78 fb-1 of data, collected at the CDF and DØ detectors respectively. The rare FCNC decays presented here are the searches for and .
1 Introduction
In the Standard Model (SM), Flavor-Changing Neutral Current (FCNC) decays are highly suppressed and can only occur through higher order diagrams. For example the branching fractions of the FCNC decays have a SM expectation of and . These predictions are about two orders of magnitude smaller than the current experimental sensitivity. However, new physics contributions can significantly enhance these branching fractions. In the absence of an observation, any improvements to the limits can be used to set significant constraints on various models beyond the SM. The exclusive FCNC decay is related to the quark-level transition of . The long term goal is study kinematic properties for these decay like the invariant di-muon mass distribution or the forward backward asymmetry. But also an observation of this decay or experimental upper limit on its rate will yield additional important information on the flavor dynamics of FCNC decays.
2 Search for the rare decays
The most stringent published limits are a result of a combination of the recent DØ result using 0.3 fb-1 of data and the latest published limit from CDF using 0.36 fb-1 of recorded data. The obtained limits at 95% C.L. were and respectively.
The used analysis procedure is similar in the DØ and CDF experiments. After a pre-selection step, special discriminating variables in an optimization procedure are used to further enhance the signal efficiency while reducing the expected background. Both collaborations employ a “blind” analysis strategy when choosing the final selection criteria. As normalization the well measured and high statistics decay was used. In the following the most recent analyses from both experiments will be described.
The strategy of the DØ collaboration is to use the already published analysis procedure for the data set recorded after the first publication, to obtain a sensitivity. This obtained sensitivity is then combined with the already obtained limit. CDF used a published analysis procedure as well and added more data to get an updated limit.
DØ used data collected by dimuon tiggers with two muons of opposite charge that form a common secondary 3D-vertex with an invariant mass between 4.5 and 7.0 GeV/. Each muon candidate had to have GeV/, and a sufficient number of hits in the central tracking station. To ensure a similar dependence of the system in the signal and in the normalization channel, had to be greater than 5 GeV/.
For the DØ analysis the following variables were found to exploit best the distinctive properties of the meson: the 3D Opening-Angle, (here the decay length vector is determined in three-dimensions), the -candidate Isolation, , and the Transverse Decay Length Significance, . After optimizing the cuts and a linear interpolation of the sideband population for the data sample into the signal region we obtain an expected number of background events of 2.20.7. The remaining background distribution is shown in Fig. 1 (left side). The values of the discriminating variables for this additional data set changed only slightly with respect to the previous analysis. The resulting sensitivity is calculated using the decay as normalization. The invariant mass distribution of the decay channel is shown in Fig. 1 (right side). This yields a sensitivity including all the statistical and systematical uncertainties of at the 90% (95%) C.L.
The obtained expected limit for the new data set is combined with the previous analysis using 0.3 fb-1 of data. The expected limit for the entire data set is thus a combination of two measurements: one actual measurement with observed events (old data) and one hypothetical experiment (new data) with all possible outcomes in the signal region weighted by their Poisson probability of occurrence, i.e., under the assumption of a background hypothesis only. We have used a Bayesian technique to combine the two experiments and include at this stage the uncorrelated uncertainties into the expected limit calculation. The background uncertainty, the uncertainty on the number of normalization events and the statistical error on the efficiencies are considered as uncorrelated. The expected upper limit at the 90% (95%) C.L. for the entire DØ data set of 0.7 fb-1 is
The CDF detector has of two muon detectors with different acceptances. Four layers of planar drift chambers (CMU) detect muon candidates with and provide coverage in the pseudorapidity range . The central muon extension (CMX) consists of conical sections of drift tubes and extends the coverage to for muon candidates with . The data used in the analysis are selected by two classes of dimuon triggers: for the CMU-CMU (U-U) triggers both muon candidates are reconstructed in the CMU chambers, while for the CMU-CMX (U-X) triggers one of the muon candidates is reconstructed in the CMX chambers. Since they have different sensitivities, the U-U and U-X channels are treated separately, combining the results at the end. The offline reconstruction begins by identifying two muon candidates of opposite charge which satisfy the online dimuon trigger requirements and with . The random combinatoric backgrounds are suppressed by requiring the vector sum of the muon transverse momenta to be . The 3D decay length is given by , where is the displacement vector from the primary to the dimuon vertex. The primary vertex is determined using a constrained vertex fit of all tracks in the event, excluding the pair and other secondary decay tracks. For each -candidate the proper decay time is estimated, where is the invariant mass and is the momentum vector of the dimuon system. Additional background is reduced by demanding , the uncertainty on to be less than 150 , and , where and is the total uncertainty on .
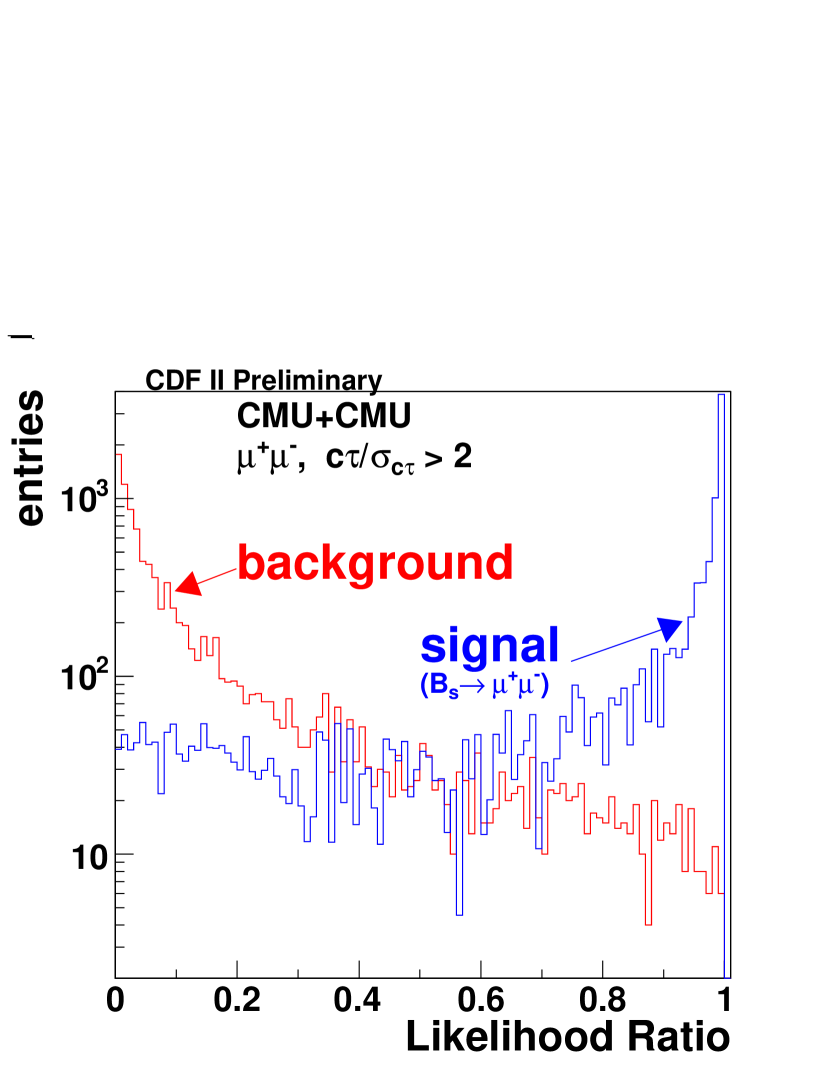
To enhance signal and background separation CDF constructs a multivariate likelihood ratio based on the input variables: , , and probability , where is the world average lifetime. CDF uses the variable instead of in constructing the likelihood ratio because the distribution is nearly flat, and therefore better behaved in the likelihood. The likelihood ratio is then defined to be
| (1) |
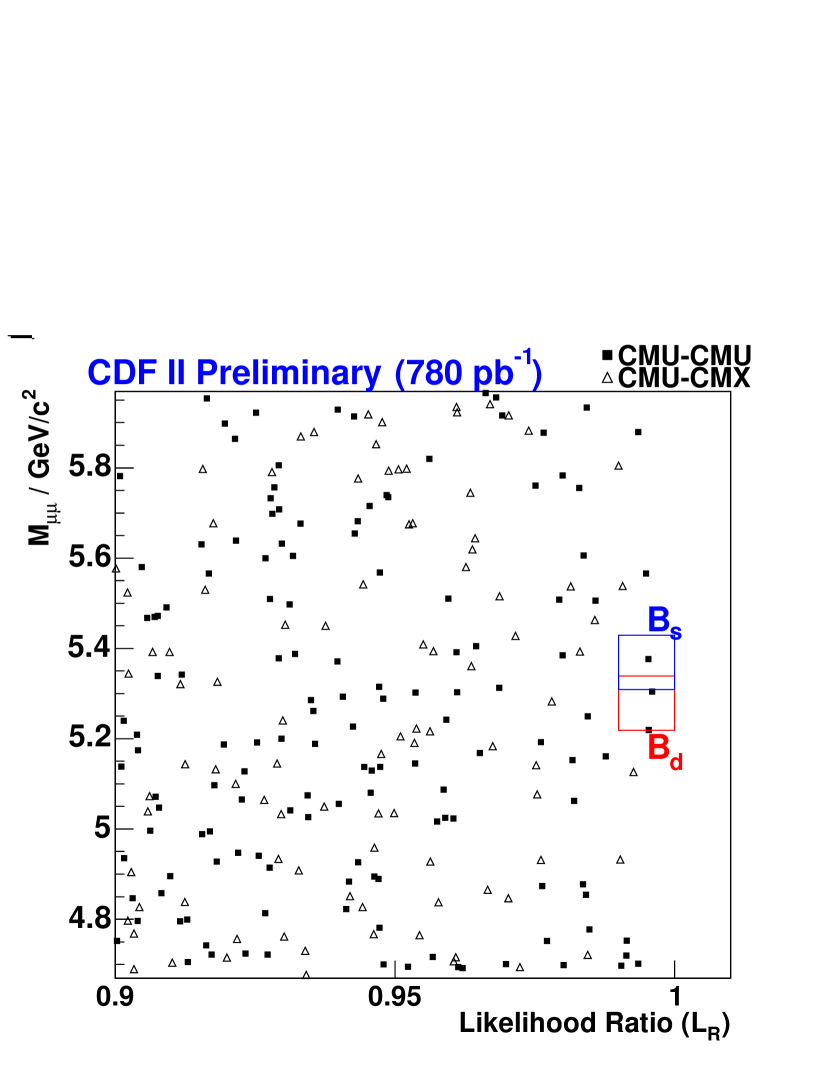
where , , , and is the probability that a signal (background) event has an observed . The probability distributions for the signal events are obtained from the signal MC and the background distributions are taken from the data sidebands. An example of the likelihood ratio for the U-U channel is shown in Fig 2 (left side). The optimization of the analysis is based on the a priori expected C.L. upper limit on . The expected limit for a given set of optimization requirements is computed by summing the C.L. limits over all possible observations , weighted by the corresponding Poisson probability when expecting background events. A scan over a range of requirements the optimal value was determined to be . With the optimized selection requirements, the expected number of background events in 0.78 fb-1 for in a signal region of () around the world average mass is is [] for the U-U [U-X] channel. The expected number of background events in a signal region around the is estimated to be is [] in the U-U [U-X] channel. Using these criteria 1 [0] and 2 [0] events are observed in the U-U [U-X] channel of the and signal boxes respectively which is consistent with the background expectations. shown in Fig. 2 (right side). Combining the U-U and U-X channels taking into account the correlated uncertainties, 90% (95%) C.L. limits can be derived to be
3 Search for the rare decays
The decay is an exclusive FCNC in the meson system. Within the SM, the decay rate for the decay, neglecting the interference effects with the much stronger and resonance decays, is predicted to be of the order of (see Ref. ) with about 30% uncertainty due to poorly known form factors.
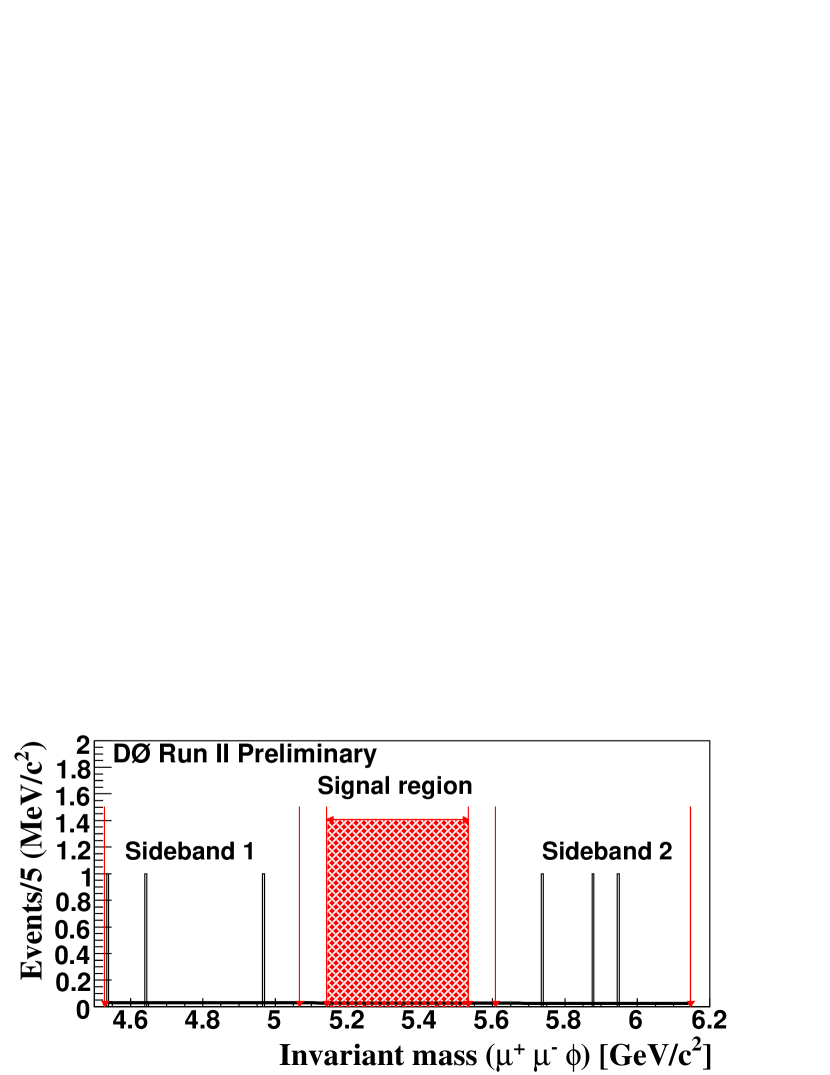
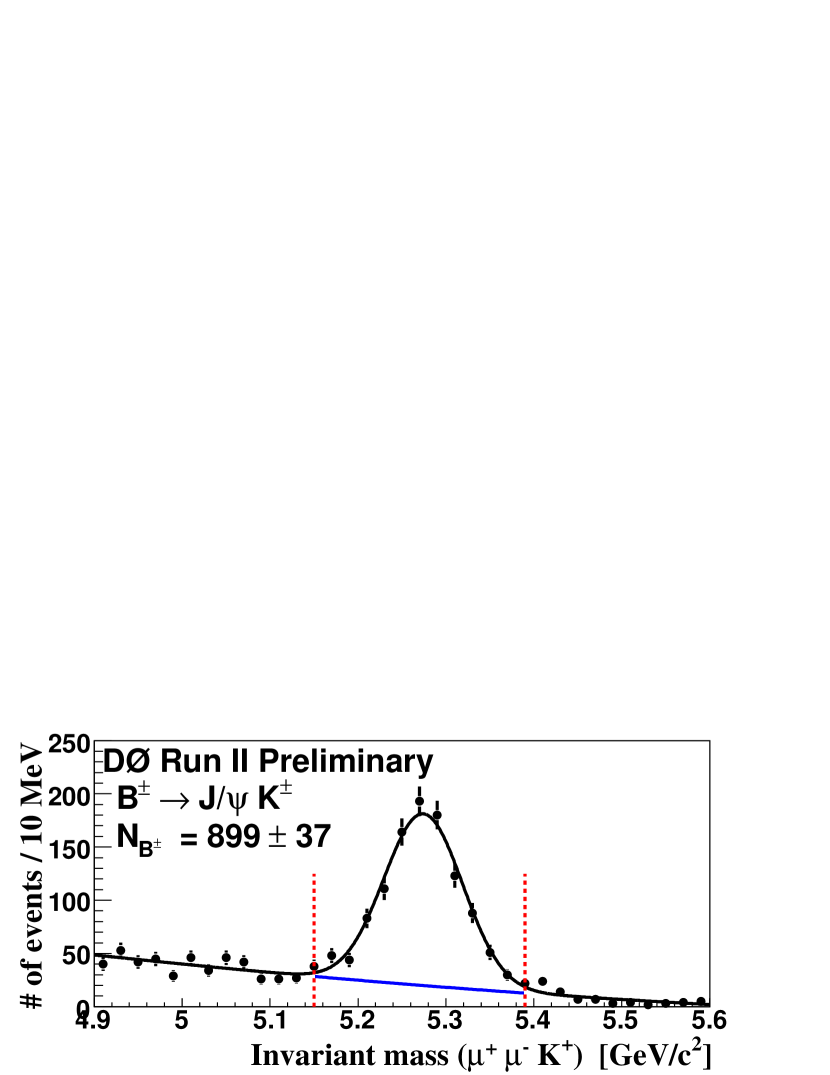
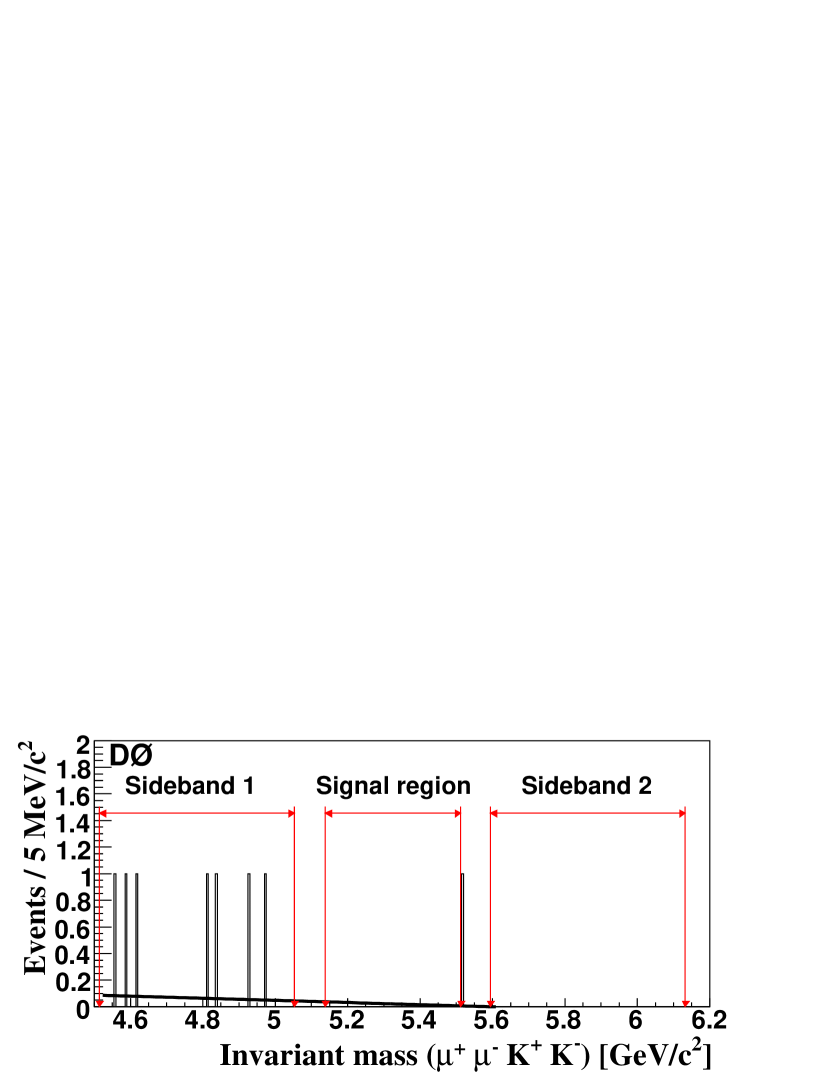
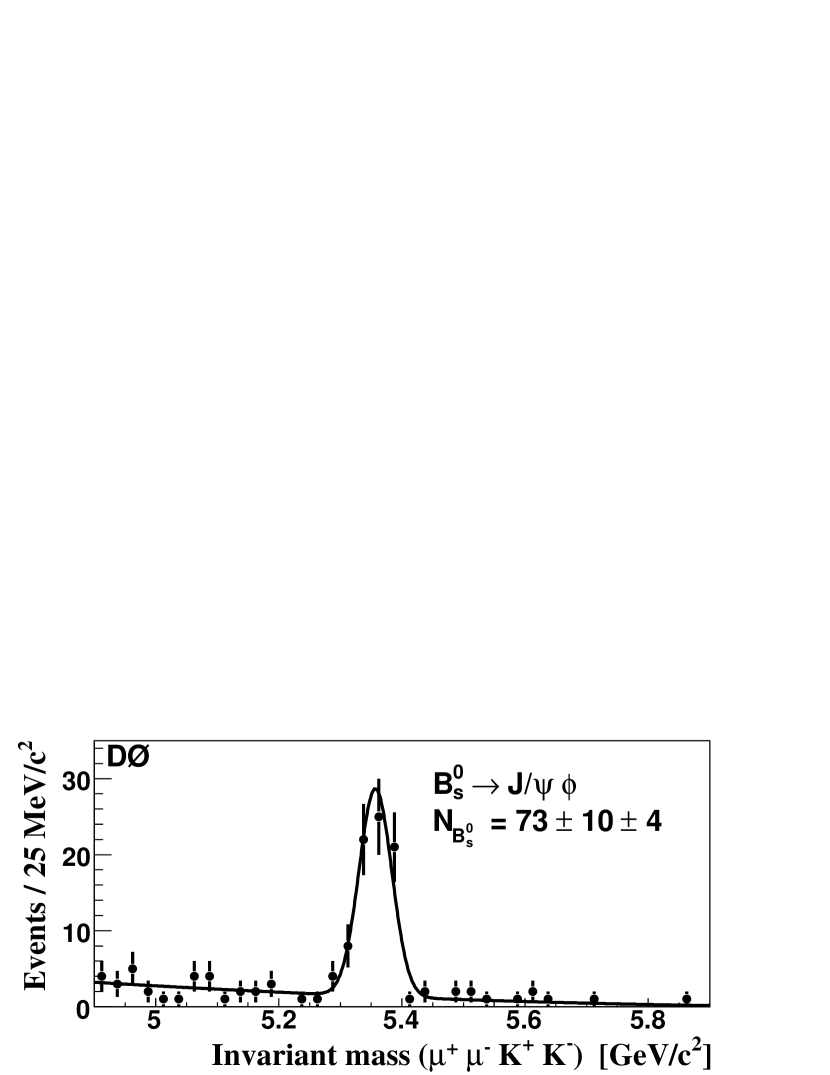
A search for this rare decay is performed by the DØ collaboration and uses about 0.45 fb-1 of data. The event pre-selection starts by requiring exactly two muons fulfilling quality cuts on the number of hits in the muon system and the two additional charged particle tracks to form a good vertex. The invariant mass of the two muons is required to be within GeV/. In this mass region, the and resonances are excluded to discriminate against dominant resonant decays. The of the two-muon vertex is required to be less than 10. The tracks that are matched to each muon are required to have a sufficient number of hits in the tracking detectors and the transverse momentum of each of the muons is required to be greater than 2.5 GeV/ with to be well inside the fiducial tracking and muon detector acceptances. The number of candidates is further reduced by requiring GeV/ and asking the candidate vertex to have with 5 The two tracks forming the candidate are further required to have GeV/ and their invariant mass within the range GeV/. In analogy to the search for the decay the same discriminating variables and optimization procedure is used to enhance the sensitivity. The optimal values of the discriminating variables yield after a linear interpolation of the sidebands into the mass window signal region, 1.60.4 expected background events as shown in Fig. 3 (left side). Upon examining the data in the mass region, zero candidate events are observed in the signal region, consistent with the background events as estimated from sidebands. The Poisson probability of observing zero events for an expected background of is . In the absence of an apparent signal, a limit on the branching fraction can be computed by normalizing the upper limit on the number of events in the signal region to the number of reconstructed events. The mass spectrum of the reconstructed after all cuts is shown in Fig. 3 (right side). Including statistical and systematic uncertainties, without including the uncertainty on the measured branching fraction of the decay , the Feldman and Cousins (FC) limit is
at the 95% (90%) C.L. respectively. Taking a Bayesian approach with a flat prior and the uncertainties treated as Gaussian distributions in the integration, an upper limit of at the 95% (90%) C.L., respectively was found. Using only the central value of the world average branching fraction of , the FC limit corresponds to at the 95% (90%) C.L. respectively. This is presently the most stringent upper bound and has been recently submitted to PRL .
References
References
- [1] G. Buchalla and A. J. Buras, Nucl. Phys. B400, 225 (1993); A.J. Buras, Phys. Lett. B 566, 115 (2003).
- [2] R. Bernhard et al., hep-ex/0508058.
- [3] DØ Collaboration, V. Abazov et al., Phys. Rev. Lett. 94, 071802 (2005); A preliminary result using 300 pb-1 is described in DØ note 4733-CONF (2005).
- [4] CDF Collaboration, A. Abulencia et al., Phys. Rev. Lett. 95, 221805 (2005).
- [5] S. Eidelman et al., Phys. Lett. B 592, 1 (2004).
- [6] C. Q. Geng and C. C. Liu, J. Phys. G 29, 1103 (2003).
- [7] V. M. Abazov et al. [D0 Collaboration], hep-ex/0604015.