- mixing results from BABAR by analysis
of Dalitz-plot regions
Abstract
We present a preliminary search for - mixing using the decays , additionally presenting Dalitz-plot distributions and a measurement of the branching ratio for this mode. A new tagging technique is used to produce the doubly Cabibbo-suppressed Dalitz plot, which in turn is used to motivate the method used for the -mixing search. We analyze 230.4 of data collected from the BABAR detector at the PEP-II collider. Assuming conservation, we find with 95% confidence, and we estimate that the data are consistent with no mixing at a 4.5% confidence level. We present -mixing results both with and without the assumption of conservation.
I Introduction
Although and mixing are well established, mixing has yet to be observed. As this particular mixing phenomenon is sensitive to new physics in a complementary manner to the and systems, it is an essential test of the completeness of the Standard Model. We present preliminary results of a new mixing analysis using the decays , taking into account the resonant structure of the doubly Cabibbo-suppressed contributions. This is the first search for mixing using either this decay mode or this technique.
G. Burdman and I. Shipsey have written a thorough review of -mixing predictions Burdman:2003rs ; accurate predictions are difficult to obtain because of significant contributions from long-distance effects.
Using 230.4 of data collected from the BABAR detector at the PEP-II collider, corresponding to approximately 300 million events, we obtain a pure sample of candidates by reconstructing the decays
| (1) | |||||
The flavor of the candidate at production is carried by the charge of the associated . The large sample of Cabibbo-favored (CF) decays is used both as a means for reducing systematic uncertainties in the probability density functions (PDFs) used to describe the wrong-sign (WS) decays and as a normalization mode when determining the WS decay rate.
We separate correctly reconstructed decays from background, and distinguish doubly Cabibbo-suppressed (DCS) contributions from CF mixed contributions, by means of an (unbinned) extended maximum likelihood fit. PDFs are fit to the three distributions , where is the invariant mass of the candidate, is the invariant mass difference between the and candidates, and is the candidate decay time.
II Branching Ratio
In a nonleptonic search for mixing, DCS contributions obscure signs of mixing in the final state. To the extent that the DCS rate is low for a particular mode compared to the corresponding CF rate, there is greater sensitivity to a potential mixing signal. The branching ratio
| (2) |
is measured using a maximum likelihood fit to the distributions , and we find the preliminary result
| (3) |
This result is consistent with that reported by the Belle Collaboration last year Tian:2005ik . Comparing this to the corresponding branching ratio for the decay Eidelman:2004wy ,
| (4) |
we find that an analysis of may in fact have more sensitivity to mixing than the standard analysis of the decays . We note that while the branching ratio in Eq. 3 may contain contributions from mixing (known to be small), the level of these contributions cannot be determined without an analysis of the WS decay-time distribution.
III Event-Level Tagging and DCS Resonance Contributions
|
|
|
|
|
|
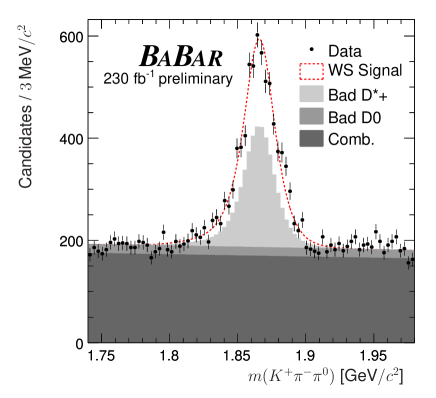
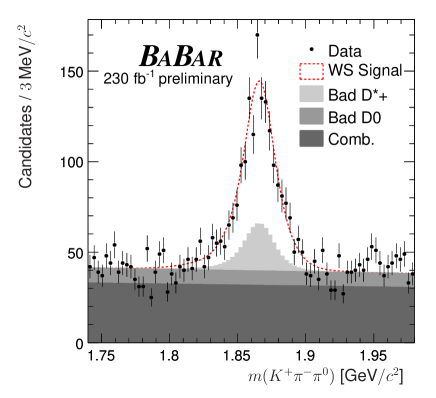
Just as an analysis of the decay may offer greater sensitivity to a mixing signal than that of because of the lower relative DCS contribution, regions of the decay phase space (i.e., the Dalitz plot) may have greater sensitivity to mixing to the extent that the DCS contribution in those regions is relatively low. However, obtaining an accurate distribution of events in the Dalitz plot is challenging because of the large number of background events still remaining after requiring event-selection criteria. In particular, a large component of the background is from real decays having a misassociated . Since this background is from real decays, it populates the Dalitz plot with structure that tends to obscure that of the signal. This peaking background is marked “Bad D*+” in Figs. 1 and 2.
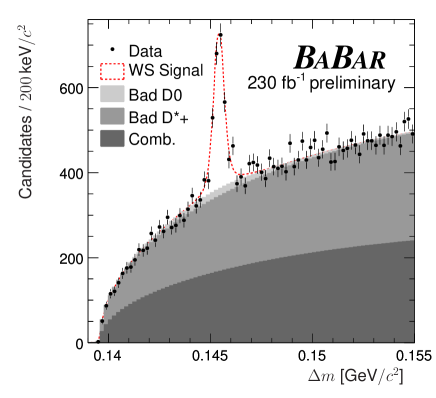
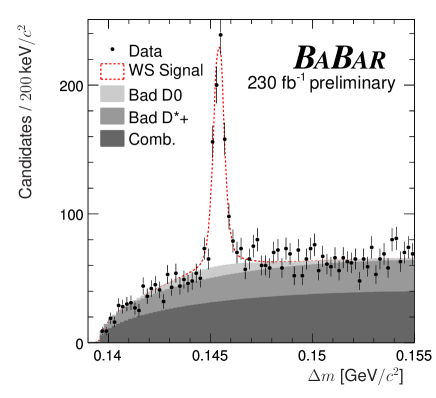
To suppress peaking background from decays, we use an event-level tag in addition to the primary flavor tag. This tag is determined by searching the event hemisphere opposite that in which the candidate is reconstructed for any of the following: , , , or . If the charge of one of these candidate is consistent with the hypothesis of hadronization and decay of a quark in that event hemisphere, then the event is tagged. The signal efficiency after applying this second, opposite-side, tag is 46.4%, while the peaking-background efficiency is 10.9%. The effect of requiring this tag is shown in Figs. 1 and 2.
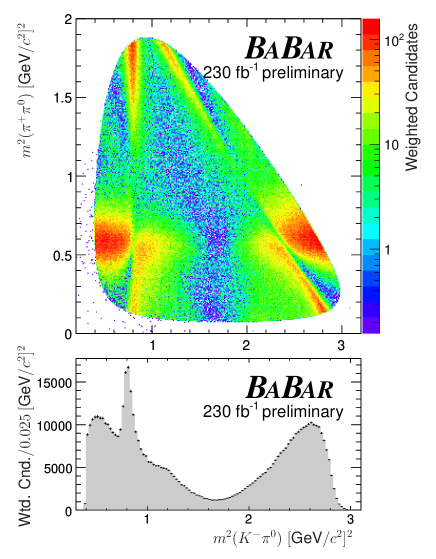
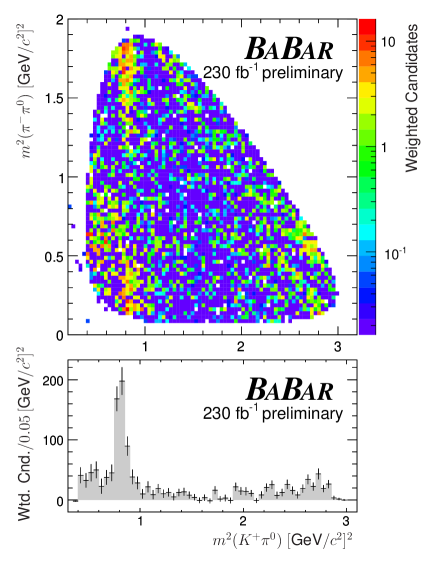
After requiring the opposite-side tag, correcting for efficiency variations as a function of the Dalitz plot, and performing a statistical background subtraction Pivk:2004ty based on a maximum likelihood fit to , we obtain the Dalitz plots in Fig. 3. The CF Dalitz plot is qualitatively different from the WS Dalitz plot, which is assumed to contain primarily DCS contributions111We assume that possible contributions from mixing cannot be distinguished by eye in the Dalitz plots shown.. While CF decays proceed primarily through the resonance , DCS decays proceed primarily through the resonance . We use this observation to maximize sensitivity to a potential -mixing signal as described in the next Section.
IV Preliminary Results of a -mixing Search
The two mass eigenstates
| (5) |
generated by mixing dynamics have different masses and widths , and we parameterize the mixing process with the quantities
| (6) |
If is not violated, then . For a multibody WS decay, the time-dependent decay rate, relative to a corresponding right-sign (RS) rate, is well approximated by
| (7) | |||
where the tilde indicates quantities that have been integrated over the selected phase-space regions. Here, is the integrated DCS branching ratio; and , is an unknown integrated strong-phase difference; is a suppression factor that accounts for strong-phase variation over the region; and is the average width. The time-integrated mixing rate is independent of decay mode and should be consistent among mixing measurements.
The necessity of the suppression factor can be understood as follows. Suppose the strong-phase difference between DCS decay and mixing is such that in a particular region of phase space there is positive interference, while in another region, there is negative interference. If one performs a mixing analysis considering the decay-time distributions of events in both phase-space regions simultaneously, then the combined decay-time distribution will have a suppressed interference effect relative to the mixing rate , which is nonnegative and invariant across phase space.
In addition to our search for a -conserving mixing signal, we manifestly permit violation by fitting to the and samples separately. We consider violation in the interference between the DCS channel and mixing, parameterized by an integrated weak-phase , as well as violation in mixing, parameterized by . We assume invariance in both the DCS and CF rates. The transformations
| (8) | |||
| (9) |
are applied to Eq. 7, using for and for the charge-conjugate ratio. The parameter is analogous to .
Because decays with mixing will obey the CF-decay resonance structure, and we can qualitatively see the differences between the CF and DCS Dalitz plots, we choose regions of the Dalitz plot to analyze in order to maximize sensitivity to a potential mixing signal. We do this by excluding events with two-body invariant masses in the ranges or . The signal yields before and after applying these selection criteria are listed in Table 1.
| Cand. | Cand. | ||||||||
|---|---|---|---|---|---|---|---|---|---|
| (a) |
|
|
|
||||||
| (b) |
|
|
|
||||||
We search for mixing in the WS decay-time distribution by constructing a three-dimensional PDF in . The WS signal PDF in is a function based on Eq. 7 convolved with three Gaussians. We fit the WS PDF to the distribution allowing yields and shape parameters to vary.
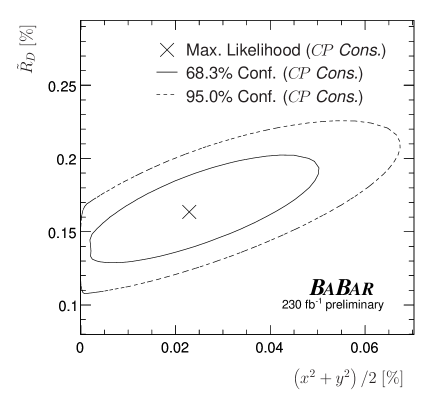
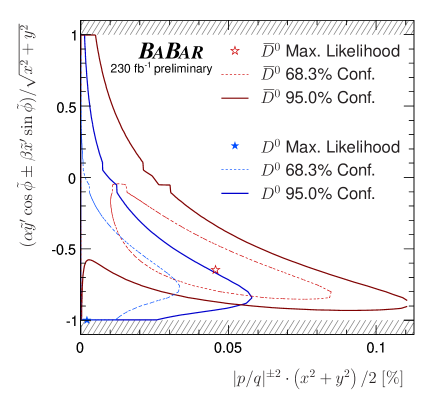
The results of the decay-time fit, both with and without the assumption of conservation, are listed in Table 2. The statistical uncertainty of a particular parameter is obtained by finding its extrema for ; in finding the extrema, the likelihood is kept maximal by refitting the remaining parameters. Contours of constant , enclosing two-dimensional coverage probabilities of 68.3% and 95.0%, respectively, are shown in Figures 4 and 5. The likelihood is maximized when evaluating for a particular point in two-dimensions.
We note that as a function of the quantity is approximately parabolic. The two-sided interval contains 95% coverage probability; thus, we quote as our upper limit on the integrated mixing rate under the assumption of conservation.
A feature of in one dimension is that it changes behavior near because the interference parameters become unconstrained. Therefore, we estimate the consistency of the data with no mixing using a frequentist method. Generating 1000 simulated data sets with no mixing, each with 58,800 events representing signal and background in the quantities , we find 4.5% of simulated data sets have a fitted value of greater than that in the observed data set. We conclude that the observed data are consistent with no mixing with 4.5% confidence.
| conserved | violation allowed | ||||||
|
|
|
||||||
Acknowledgements.
We are grateful for the excellent luminosity and machine conditions provided by our PEP-II colleagues, and for the substantial dedicated effort from the computing organizations that support BABAR. The collaborating institutions wish to thank SLAC for its support and kind hospitality. This work is supported by DOE and NSF (USA), NSERC (Canada), IHEP (China), CEA and CNRS-IN2P3 (France), BMBF and DFG (Germany), INFN (Italy), FOM (The Netherlands), NFR (Norway), MIST (Russia), and PPARC (United Kingdom). Individuals have received support from CONACyT (Mexico), Marie Curie EIF (European Union), the A. P. Sloan Foundation, the Research Corporation, and the Alexander von Humboldt Foundation.References
- (1) G. Burdman and I. Shipsey, Ann. Rev. Nucl. Part. Sci. 53, 431 (2003), [hep-ph/0310076].
- (2) Belle, X. C. Tian et al., Phys. Rev. Lett. 95, 231801 (2005), [hep-ex/0507071].
- (3) Particle Data Group, S. Eidelman et al., Phys. Lett. B592, 1 (2004).
- (4) M. Pivk and F. R. Le Diberder, Nucl. Instrum. Meth. A555, 356 (2005), [physics/0402083].