W MASS AT LEP AND STANDARD MODEL FITS
The W-mass measurements from LEP and the results of a global fit of the Standard Model parameters to the electroweak data are presented. Comprehensive studies of experimental systematic effects allowed a measurement of the W mass with an accuracy of better than half a permill. Especially the recent improvements in the LEP energy calibration, the modelling of the hadronisation process and the understanding of Bose-Einstein correlations and colour reconnection effects are discussed. The fit of the Standard Model parameters to all electroweak measurements verifies the self-consistency of the theory. The combination of all electroweak data yield information on the mass of the still undiscovered Higgs boson, .
1 Measurement of the W mass at LEP
The mass, , and the total decay width, , are fundamental properties of the W boson. Comparing to its predictions derived from other electroweak parameters provides a stringent test of the Standard Model at the level of quantum corrections. In addition to the measurement of the Z mass and the weak mixing angle performed at LEP 1, an accurate measurement of the W mass is mandatory for this test. The precision of the direct measurement of the W mass has to compete with the accuracy on when it is derived indirectly from the electroweak precision data.
The results presented here are obtained using about 40,000 W-pair events recorded by the LEP experiments at centre-of-mass energies, . The cross section of W-pair production near threshold is sensitive to . Here, is derived from the measurement of the total cross section of W-pair production . At higher centre-of-mass energies, well above the kinematic threshold, the W-pair events are directly reconstructed and the invariant mass spectra of the W-boson decay products are exploited .
In the following the current status of the results on the W mass from LEP is presented. It is based on final results from the experiments ALEPH, L3 and OPAL and preliminary numbers from DELPHI. In all analyses the final calibration of the LEP beam energy is used. Together with the improvemed understanding of colour reconnection and Bose-Einstein effects in the fully-hadronic final state a significant reduction of the W-mass uncertainty with respect to the last year was achieved. The combination of the results from the four experiments yields
| (1) |
where the first uncertainty is statical and the second is systematic.
1.1 LEP beam energy calibration
The calibration of the LEP beam energy is based on the resonant spin depolarisation (RDP) technique available at beam energies of . Unfortunately this method can not be used for the beam energies of the physics runs at LEP 2, above . Therefore, the measurements of resonant depolarisation made at low energies are used instead, to calibrate an energy measurement which is based on B-field measurements accomplished with 16 NMR probes situated in selected bending dipoles . They were read out during physics runs as well as during the procedure of resonant depolarisation. The beam energies for the physics running in the regime were derived from the NMR model extrapolating the results of the RDP technique to the higher energies.
The systematic uncertainty of the NMR model was derived using three independent measures of the LEP beam energy: the synchrotron tune, , of the LEP storage ring, the flux-loop, a sequence of cable loops installed into each of the bending magnets and sensing the change of the magnetic flux during the ramp of the B field, and a magnetic spectrometer installed in 1999 and used during the run of the year 2000. The relative differences between the result obtained from the NMR model and the alternative measurements are shown in Figure 1.
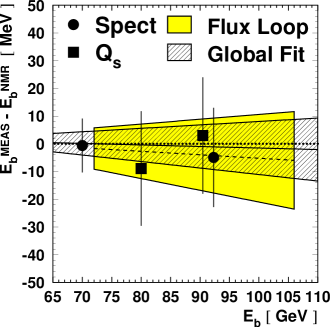
The comparison of the alternative methods with the default NMR measurement allows to estimate the systematic uncertainty of the LEP beam energy. This uncertainty increases linearly with the distance in energy to the calibration points where the precise energy calibration using the depolarisation method was performed. Finally uncertainties of are assigned to depending on the running period. The contribution of the beam energy calibration to the uncertainty on the final W mass accounts to .
1.2 Hadronisation
After the generation of the four-fermion state the quark pairs are subject to a Monte-Carlo program modelling the hadronisation process. Three different schemes, implemented in the programs Pythia, Herwig and Ariadne, are widely used for this purpose. QCD studies of the LEP 1 data were not able to decide between the predictions of the three programs.
Therefore, systematic effects due to modelling of the hadronisation process are determined by comparing the result of three different mass fits using Monte-Carlo events simulated with the programs Pythia, Herwig and Ariadne, respectively. Here, identical events at the level of the four-fermion state were subject to all three hadronisation programs. In addition, DELPHI and OPAL compared Pythia Monte Carlo samples generated with various QCD parameters, for example the hadronisation scale and the shower parameter , varied with respect to the standard tuning of the Pythia generator.
In the L3 analysis the Pythia Monte Carlo events are re-weighted such that the mean number of charged kaons and the mean number of protons agree with the measurement . The resulting shift of the W mass is shown in Figure 2 for one example. The extracted W mass depends linearly on the number of kaons and protons. Due to this linearity the uncertainty of the measured kaon and proton multiplicities can be translated into an uncertainty on the W mass.
1.3 Bose-Einstein effects
Bose-Einstein correlations are caused by interference effects between identical bosons which are close to each other in phase space. They manifest themselves as an enhanced production of identical bosons, mainly pions, at small four-momentum difference. For quantitative studies of Bose-Einstein effects in W-pair events and for the estimation of possible mass biases the Monte-Carlo model BE32 implemented in the program code LUBOEI from Lönnblad and Sjöstrand is widely used.
All four LEP experiments published their final results on Bose-Einstein correlations in W-pair events . Typically one million of like-sign particle pairs are selected in the fully-hadronic and about 200,000 in the semi-hadronic channel, using all data of one LEP experiment. A comparison of Bose-Einstein correlations in fully-hadronic W-pair events () with those in semi-hadronic events () serves as a probe to study the inter-W Bose-Einstein correlations.
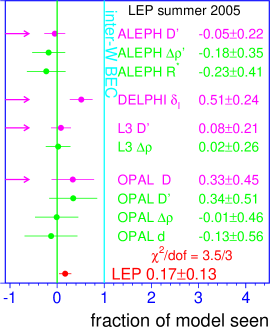
A combination of the results of the four LEP experiments has been performed by averaging the results of various analyses with different estimators for the size of Bose-Einstein correlations with respect to the specific model under study. Figure 3 shows the measured size of correlations as a relative fraction of the LUBOEI model including inter-W correlations. Combining the individual results gives an average fraction of . This means that the data prefer only little inter-W correlations, at most at the level of about one third of the LUBOEI model.
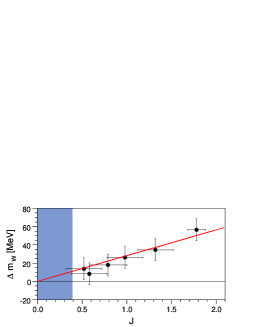
For the L3 W-mass analysis several Monte Carlo samples with various strengths of inter-W Bose-Einstein correlations, but equal strength of intra-W correlations were subject to the mass extraction procedure. The Bose-Einstein observable is determined for each of these samples. A linear dependence of the W-mass shift with respect to is obtained, as presented in Figure 3.
The measurement of the W mass is based on a Monte-Carlo simulation using the LUBOEI BE32 model without inter-W correlations. To estimate the systematic uncertainty due to Bose-Einstein effects the fit is also performed using a simulation with full inter-W correlations. According to the Bose-Einstein measurement currently 30% of the difference between both results are taken as systematic uncertainty. In total the Bose-Einstein effect contributes with to the uncertainty on the W mass in the channel.
1.4 Colour reconnection
In the fully-hadronic final state of W-pair production both W bosons decay into a quark-antiquark pair which subsequently hadronise into jets. The spatial extension of the hadronisation process is given by the range of the strong interaction of about 1 fm which is about ten times larger than the decay length of the W boson leading to a significant space-time overlap of the two colour strings. Due to this overlap the W bosons may not hadronise independently, i.e. a re-arrangement of the colour flow is possible. This effect is called colour reconnection.
The effect of colour reconnection in the non-perturbative phase can be modelled with the SK models developed by Sjöstrand and Khoze based on the string fragmentation model implemented in Pythia. The colour strings are assumed to have a finite width of about 1 fm, the typical range of the strong interaction. Therefore the two strings originating from the two hadronically decaying W bosons can exhibit a non-vanishing space-time volume over which they overlap. In the SK-I model the reconnection probability between the two strings is proportional to this space-time overlap multiplied by a free parameter, .
Detailed searches for colour reconnection in hadronic decays of W pairs were performed using the event particle flow method . In this analysis, the four jets are grouped into the two pairs originating from the decay of a W boson and the particle flow in four different jet-jet regions are studied: two regions between jets with the same parent W boson (intra-W) and two in which the parents differ (inter-W). If colour reconnection between the jets of different W decays is present, the particle flow between the jets would be changed. More particles are expected to be emitted between jets from different W bosons. To quantify this effect, the particle flow in between jets coming from the same W (intra-W region) is divided by the particle flow in the regions between the W bosons (inter-W region). The measured ratio is then compared to the predictions from Pythia without colour reconnection and the prediction from the SK-I model.
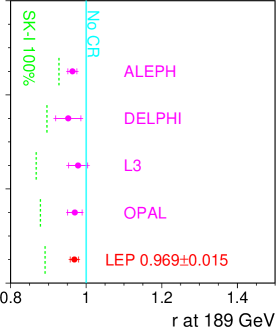
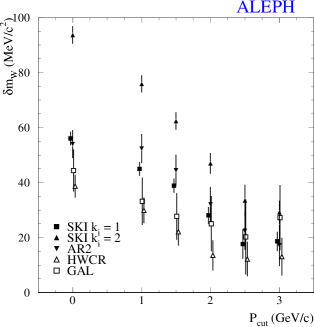
In Figure 4 the results of the four analyses of the LEP experiments are compared to each other and to the prediction of the SK-I model with full colour reconnection. The combined average slightly prefers a non-vanishing contribution from colour reconnection. This is mainly caused by the ALEPH result. An upper limit at 68% confidence level is set at . The data disfavour the extreme version of the SK-I model with full colour reconnection by 5.2 standard deviations.
Using a cone algorithm for jet clustering lowers the sensitivity to colour reconnection effects, as the analysis will be unaffected by the inter-jet regions where the influence of the CR is largest. Alternatively, removing clusters below a certain momentum cut rejects particles predominantly produced during the non-perturbative phase of the hadronisation process where the colour reconnection effects take place. The shift of the W mass observed between the standard Monte Carlo and various colour reconnection models is shown in Figure 4 for the ALEPH analysis. This mass shift is evaluated for variations of the jet reconstruction where a cut on the minimum particle momentum, , was applied. For stronger cuts on the W mass shifts due to colour reconnection are significantly reduced.
In their final analyses all LEP experiments decided to limit the effects of colour reconnection by introducing such a cut in the jet reconstruction. Using the preliminary upper limit on presented above the uncertainty from colour reconnection contributes with to the uncertainty of the W mass in the channel. Further improvement is expected when the final colour reconnection results of all four LEP experiments will become available.
2 Standard Model fits
Electroweak radiative corrections have been calculated up to the two-loop level, but their accuracy is limited by the experimental uncertainty on the mass of the top quark and by the ignorance on the mass of the Higgs boson. A test of the quantum structure of the Standard Model therefore requires a precise knowledge of the top quark mass, since the radiative corrections depend quadratically on this parameter. The electroweak radiative corrections include a term proportional to the logarithm of the Higgs mass. Assuming the validity of the Standard Model one can try to extract this term and hence the Higgs mass from a global fit to all electroweak observables.
The mass of the top quark is measured by the Tevatron experiments CDF and D0 analysing events of the reaction . The published Run-I results have been combined with the most recent Run-II measurements representing a data set of 750 pb-1 in total :
The fit results presented here are performed within the context of the LEP and SLD electroweak working group. The details of the combination of the electroweak data and the fit of the Standard Model parameters are described in Reference . The semi-analytical program ZFITTER is used to calculate the Standard Model predictions including its higher order corrections. The complete fermionic and bosonic two-loop corrections to have been calculated recently . The analytical formulas obtained were parametrised as functions of the parameters , , , and and implemented in ZFITTER.
The most general electroweak fit includes all Z peak data from LEP 1 and SLD, the W mass, , from LEP 2 and Tevatron, the top mass, , measured at the Tevatron and . This fit yields a which corresponds to a fit probability of 18%. This shows that the electroweak measurements are internally consistent and agree with the Standard Model prediction. The radiative corrections are needed to describe the data which represents a test of the Standard Model at the quantum-loop level.
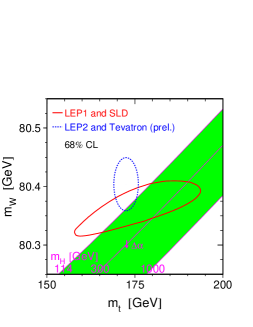
In Figure 5 the allowed region of all LEP 1 and SLD electroweak data is shown as a contour in the vs. plane containing a probability of 68%. The direct measurements of the W boson mass and the top quark mass are also indicated. The Standard Model prediction derived from the precision parameter is plotted for various Higgs masses within . Both the indirect and the direct measurements prefer a low Higgs mass.
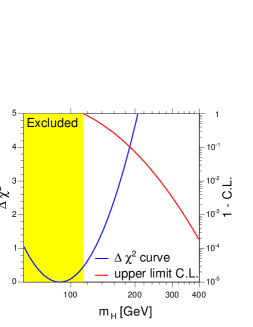
The fit of the Standard Model prediction to all electroweak data with the Higgs mass as the only free parameter results in a curve as shown in Figure 5. It predicts the mass of the Higgs boson to be which is consistent with the direct searches for the Higgs boson excluding masses below . After integrating the probability density with respect to and setting the total probability of the Higgs mass above to unity, a curve representing the confidence level on an upper limit on is obtained. At 95% C.L. an upper bound on the Higgs mass of is set.
References
References
-
[1]
ALEPH Collaboration, R. Barate et al.,
Phys. Lett. B 415, 435 (1997);
DELPHI Collaboration, P. Abreu et al., Eur. Phys. J. C 2, 581 (1998);
L3 Collaboration, M. Acciarri et al., Phys. Lett. B 407, 419 (1997);
OPAL Collaboration, K. Ackerstaff et al., Eur. Phys. J. C 1, 395 (1998) 395 -
[2]
ALEPH Collaboration, R. Barate et al.,
Preprint CERN-PH-EP/2006-004;
DELPHI Collaboration, P. Abreu et al., Phys. Lett. B 511, 159 (2001);
L3 Collaboration, P. Achard et al., Eur. Phys. J. C 45, 569 (2006);
OPAL Collaboration, G. Abbiendi et al., Eur. Phys. J. C 45, 307 (2006) - [3] LEP Energy Working Group, R. Assmann et al., Eur. Phys. J. C 39, 253 (2005)
- [4] DELPHI Collaboration, P. Abreu et al., Eur. Phys. J. C 18 (2000) 203
- [5] L. Lönnblad and T. Sjöstrand, Eur. Phys. J. C 2, 165 (1998)
-
[6]
ALEPH Collaboration, St. Schael et al.,
Phys. Lett. B 606, 265 (2005);
DELPHI Collaboration, J. Abdallah et al., Eur. Phys. J. C 44, 161 (2005);
L3 Collaboration, P. Achard et al., Phys. Lett. B 547, 139 (2002);
OPAL Collaboration, G. Abbiendi et al., Eur. Phys. J. C 36, 297 (2004) -
[7]
T. Sjöstrand and V. Khoze,
Z. Phys. C 62, 281 (1994);
T. Sjöstrand and V. Khoze, Phys. Rev. Lett. 72, 28 (1994) -
[8]
ALEPH Collaboration,
Conference note ALEPH 2002-020;
DELPHI Collaboration, Conference note DELPHI 2003-021;
L3 Collaboration, P. Achard et al., Phys. Lett. B 561, 202 (2003);
OPAL Collaboration, G. Abbiendi et al., Preprint CERN-PH-EP/2005-035 -
[9]
CDF Collaboration, F. Abe et al.,
Phys. Rev. D 63, 032003 (2001);
D0 Collaboration, B. Abbott at al., Nature 429, 638 (2004);
Tevatron Electroweak Working Group, Eprint hep-ex/0603039 (2006) -
[10]
LEP Electroweak Working Group, Eprint hep-ex/0511027 and
http://lepewwg.web.cern.ch/LEPEWWG/ -
[11]
A.B. Arbuzov et al., Eprint hep-ph/0507146;
D. Bardin et al., Comp. Phys. Commun. 133, 229 (2001) -
[12]
M. Faisst et al., Nucl. Phys. B 665, 649 (2003);
M. Awramik et al., Phys. Rev. D 69, 053006 (2004);
M. Awramik et al., Phys. Rev. Lett. 93, 201805 (2004)