EUROPEAN ORGANISATION FOR NUCLEAR RESEARCH (CERN)
CERN-PH-EP/2006-004
25 April 2006
Journal Version
Measurement of the W boson Mass and Width
in Collisions at LEP
The ALEPH Collaboration ∗)
Abstract
The mass of the boson is determined from the direct reconstruction of decays in and events in e+e- collisions at LEP. The data sample corresponds to an integrated luminosity of 683 pb-1 collected with the ALEPH detector at centre-of-mass energies up to 209 . To minimise any effect from colour reconnection a new procedure is adopted in which low energy particles are not considered in the mass determination from the channel. The combined result from all channels is
where FSI represents the possible effects of final state interactions in the channel and LEP indicates the uncertainty in the beam energy. From two-parameter fits to the mass and width, the width is found to be
To be published in Eur. Phys. J. C
——————————————– See next pages for the list of authors
The ALEPH Collaboration
S. Schael,
Physikalisches Institut das RWTH-Aachen, D-52056 Aachen, Germany
R. Barate, R. Brunelière, I. De Bonis, D. Decamp, C. Goy, S. Jézéquel, J.-P. Lees, F. Martin, E. Merle, M.-N. Minard, B. Pietrzyk, B. Trocmé
Laboratoire de Physique des Particules (LAPP), IN2P3-CNRS, F-74019 Annecy-le-Vieux Cedex, France
S. Bravo, M.P. Casado, M. Chmeissani, J.M. Crespo, E. Fernandez, M. Fernandez-Bosman, Ll. Garrido,15 M. Martinez, A. Pacheco, H. Ruiz
Institut de Física d’Altes Energies, Universitat Autònoma de Barcelona, E-08193 Bellaterra (Barcelona), Spain7
A. Colaleo, D. Creanza, N. De Filippis, M. de Palma, G. Iaselli, G. Maggi, M. Maggi, S. Nuzzo, A. Ranieri, G. Raso,24 F. Ruggieri, G. Selvaggi, L. Silvestris, P. Tempesta, A. Tricomi,3 G. Zito
Dipartimento di Fisica, INFN Sezione di Bari, I-70126 Bari, Italy
X. Huang, J. Lin, Q. Ouyang, T. Wang, Y. Xie, R. Xu, S. Xue, J. Zhang, L. Zhang, W. Zhao
Institute of High Energy Physics, Academia Sinica, Beijing, The People’s Republic of China8
D. Abbaneo, T. Barklow,27 O. Buchmüller,27 M. Cattaneo, B. Clerbaux,23 H. Drevermann, R.W. Forty, M. Frank, F. Gianotti, J.B. Hansen, J. Harvey, D.E. Hutchcroft,31, P. Janot, B. Jost, M. Kado,2 P. Mato, A. Moutoussi, F. Ranjard, L. Rolandi, D. Schlatter, F. Teubert, A. Valassi, I. Videau
European Laboratory for Particle Physics (CERN), CH-1211 Geneva 23, Switzerland
F. Badaud, S. Dessagne, A. Falvard,20 D. Fayolle, P. Gay, J. Jousset, B. Michel, S. Monteil, D. Pallin, J.M. Pascolo, P. Perret
Laboratoire de Physique Corpusculaire, Université Blaise Pascal, IN2P3-CNRS, Clermont-Ferrand, F-63177 Aubière, France
J.D. Hansen, J.R. Hansen, P.H. Hansen, A.C. Kraan, B.S. Nilsson
Niels Bohr Institute, 2100 Copenhagen, DK-Denmark9
A. Kyriakis, C. Markou, E. Simopoulou, A. Vayaki, K. Zachariadou
Nuclear Research Center Demokritos (NRCD), GR-15310 Attiki, Greece
A. Blondel,12 J.-C. Brient, F. Machefert, A. Rougé, H. Videau
Laoratoire Leprince-Ringuet, Ecole Polytechnique, IN2P3-CNRS, F-91128 Palaiseau Cedex, France
V. Ciulli, E. Focardi, G. Parrini
Dipartimento di Fisica, Università di Firenze, INFN Sezione di Firenze, I-50125 Firenze, Italy
A. Antonelli, M. Antonelli, G. Bencivenni, F. Bossi, G. Capon, F. Cerutti, V. Chiarella, P. Laurelli, G. Mannocchi,5 G.P. Murtas, L. Passalacqua
Laboratori Nazionali dell’INFN (LNF-INFN), I-00044 Frascati, Italy
J. Kennedy, J.G. Lynch, P. Negus, V. O’Shea, A.S. Thompson
Department of Physics and Astronomy, University of Glasgow, Glasgow G12 8QQ,United Kingdom10
S. Wasserbaech
Utah Valley State College, Orem, UT 84058, U.S.A.
R. Cavanaugh,4 S. Dhamotharan,21 C. Geweniger, P. Hanke, V. Hepp, E.E. Kluge, A. Putzer, H. Stenzel, K. Tittel, M. Wunsch19
Kirchhoff-Institut für Physik, Universität Heidelberg, D-69120 Heidelberg, Germany16
R. Beuselinck, W. Cameron, G. Davies, P.J. Dornan, M. Girone,1 N. Marinelli, J. Nowell, S.A. Rutherford, J.K. Sedgbeer, J.C. Thompson,14 R. White
Department of Physics, Imperial College, London SW7 2BZ, United Kingdom10
V.M. Ghete, P. Girtler, E. Kneringer, D. Kuhn, G. Rudolph
Institut für Experimentalphysik, Universität Innsbruck, A-6020 Innsbruck, Austria18
E. Bouhova-Thacker, C.K. Bowdery, D.P. Clarke, G. Ellis, A.J. Finch, F. Foster, G. Hughes, R.W.L. Jones, M.R. Pearson, N.A. Robertson, T. Sloan, M. Smizanska
Department of Physics, University of Lancaster, Lancaster LA1 4YB, United Kingdom10
O. van der Aa, C. Delaere,29 G.Leibenguth,32 V. Lemaitre30
Institut de Physique Nucléaire, Département de Physique, Université Catholique de Louvain, 1348 Louvain-la-Neuve, Belgium
U. Blumenschein, F. Hölldorfer, K. Jakobs, F. Kayser, A.-S. Müller, B. Renk, H.-G. Sander, S. Schmeling, H. Wachsmuth, C. Zeitnitz, T. Ziegler
Institut für Physik, Universität Mainz, D-55099 Mainz, Germany16
A. Bonissent, P. Coyle, C. Curtil, A. Ealet, D. Fouchez, P. Payre, A. Tilquin
Centre de Physique des Particules de Marseille, Univ Méditerranée, IN2P3-CNRS, F-13288 Marseille, France
F. Ragusa
Dipartimento di Fisica, Università di Milano e INFN Sezione di Milano, I-20133 Milano, Italy.
A. David, H. Dietl,33 G. Ganis,28 K. Hüttmann, G. Lütjens, W. Männer33, H.-G. Moser, R. Settles, M. Villegas, G. Wolf
Max-Planck-Institut für Physik, Werner-Heisenberg-Institut, D-80805 München, Germany161616Supported by Bundesministerium für Bildung und Forschung, Germany.
J. Boucrot, O. Callot, M. Davier, L. Duflot, J.-F. Grivaz, Ph. Heusse, A. Jacholkowska,6 L. Serin, J.-J. Veillet
Laboratoire de l’Accélérateur Linéaire, Université de Paris-Sud, IN2P3-CNRS, F-91898 Orsay Cedex, France
P. Azzurri, G. Bagliesi, T. Boccali, L. Foà, A. Giammanco, A. Giassi, F. Ligabue, A. Messineo, F. Palla, G. Sanguinetti, A. Sciabà, G. Sguazzoni, P. Spagnolo, R. Tenchini, A. Venturi, P.G. Verdini
Dipartimento di Fisica dell’Università, INFN Sezione di Pisa, e Scuola Normale Superiore, I-56010 Pisa, Italy
O. Awunor, G.A. Blair, G. Cowan, A. Garcia-Bellido, M.G. Green, T. Medcalf,25 A. Misiejuk, J.A. Strong, P. Teixeira-Dias
Department of Physics, Royal Holloway & Bedford New College, University of London, Egham, Surrey TW20 OEX, United Kingdom10
R.W. Clifft, T.R. Edgecock, P.R. Norton, I.R. Tomalin, J.J. Ward
Particle Physics Dept., Rutherford Appleton Laboratory, Chilton, Didcot, Oxon OX11 OQX, United Kingdom10
B. Bloch-Devaux, D. Boumediene, P. Colas, B. Fabbro, E. Lançon, M.-C. Lemaire, E. Locci, P. Perez, J. Rander, A. Trabelsi,25 B. Tuchming, B. Vallage
CEA, DAPNIA/Service de Physique des Particules, CE-Saclay, F-91191 Gif-sur-Yvette Cedex, France17
A.M. Litke, G. Taylor
Institute for Particle Physics, University of California at Santa Cruz, Santa Cruz, CA 95064, USA22
C.N. Booth, S. Cartwright, F. Combley,26 P.N. Hodgson, M. Lehto, L.F. Thompson
Department of Physics, University of Sheffield, Sheffield S3 7RH, United Kingdom10
A. Böhrer, S. Brandt, C. Grupen, J. Hess, A. Ngac, G. Prange
Fachbereich Physik, Universität Siegen, D-57068 Siegen, Germany16
C. Borean, G. Giannini
Dipartimento di Fisica, Università di Trieste e INFN Sezione di Trieste, I-34127 Trieste, Italy
H. He, J. Putz, J. Rothberg
Experimental Elementary Particle Physics, University of Washington, Seattle, WA 98195 U.S.A.
S.R. Armstrong, K. Berkelman, K. Cranmer, D.P.S. Ferguson, Y. Gao,13 S. González, O.J. Hayes, H. Hu, S. Jin, J. Kile, P.A. McNamara III, J. Nielsen, Y.B. Pan, J.H. von Wimmersperg-Toeller, W. Wiedenmann, J. Wu, Sau Lan Wu, X. Wu, G. Zobernig
Department of Physics, University of Wisconsin, Madison, WI 53706, USA11
G. Dissertori
Institute for Particle Physics, ETH Hönggerberg, 8093 Zürich, Switzerland.
1 Introduction
The electroweak Standard Model (SM) successfully describes all interactions of quarks and leptons at the resonance provided that quantum radiative corrections are included [1]. In this model, the mass of the boson () can be calculated as follows:
where ( mass), (Fermi coupling constant) and (fine structure constant) are measured with high precision. In this equation, parametrises the loop corrections which lead to a quadratic dependence on the top quark mass, (), and a weaker logarithmic dependence on the Higgs boson mass. A global fit of electroweak observables measured at the resonance together with the measured [2] yields a mass of [1] in the SM.
The comparison of a direct measurement of with this prediction was a primary goal of LEP, enabling a stringent test of the Standard Model to be made. This paper describes the final measurement of the mass and width () from ALEPH. They are determined from the direct reconstruction of the invariant mass of its decay products in both the hadronic and semileptonic channels. Measurements were published previously using the data collected at centre-of-mass (CM) energies of 172, 183 and 189 [3, 4, 5]. The most recent ALEPH publication included a weighted average result obtained from the combination of all these measurements as well as those obtained earlier from the total pair cross sections at 161 and 172 [6, 7]. The statistical precision for the mass was 61 with a systematic uncertainty of 47 . In the last two years up to the closure of LEP in 2000, more data were collected at CM energies up to 209 increasing the total sample by a factor of three.
All these data, except for the small sample at 172 , are included in the analysis corresponding to an integrated luminosity of 683 . The data were sub-divided into eight samples labelled as 183, 189, 192, 196, 200, 202, 205 and 207 according to their CM energies. This sub-division is the same as that used in the measurement of the cross section [8].
A constrained kinematic fit conserving energy and momentum is applied to each selected event in data and Monte Carlo (MC) simulation. As in previous analyses, the simulated mass spectra are fitted to the data using a reweighting technique to extract the mass and width. Very large MC productions ( signal events per CM energy) enable multi-dimensional fits to be used with significant gains in precision. The signal events are weighted to account for the effect of corrections [9] in and .
Since the statistical error on is now comparable with the previously published systematic uncertainties, a more detailed evaluation of all important uncertainties has been performed. In the previous analysis [5], the dominant systematic uncertainty in the channel was due to colour reconnection (CR). This affects the topological distribution of lower energy particles in an event. Two new analysis procedures have been adopted. In one of these, PCUT, low energy particles are not considered in the reconstruction of jets, whilst in the other, CONE, only particles close to the jet axes are used. These significantly reduce the difficult-to-estimate CR uncertainty at the expense of some statistical power in this channel. The effect of these modified reconstructions has been checked using di-jets in the channels, where no final state interactions are present between the ’s.
The paper is organised as follows. In Section 2, the important properties of the ALEPH detector are described. In Section 3, the event reconstruction procedures and calibrations are recalled and detailed studies of the detector simulation reported. Section 4 contains a full description of the event samples generated for the signal and background processes involved. Section 5 describes the event selection and kinematic reconstruction procedures in the different channels highlighting, where appropriate, the modifications and improvements applied since the earlier analyses at 183 and 189 [4, 5]. Section 6 describes the extraction of and . Section 7 describes the specific studies made to set a limit on colour reconnection from the data using event reconstructions where low momentum particles or particles between jets are excluded. Section 8 describes all studies of systematic uncertainties. The analysis of radiative returns to the peak is reported in Section 9, providing a cross check on the mass measurement. The measurements in all channels are combined in Section 10, taking into account common sources of systematic uncertainties. The masses measured in the purely hadronic and combined semileptonic channels are compared in this section. Final conclusions are given in Section 11.
2 The ALEPH detector
A detailed description of the ALEPH detector can be found in Ref. [10] and of its performance in Ref. [11]. The tracking detectors include a silicon vertex detector (VDET), a cylindrical drift chamber and a large time projection chamber (TPC) which measures up to 31 coordinates along the charged particle trajectories. A 1.5 T axial magnetic field, provided by a superconducting solenoidal coil, yields a resolution of ( in ). Charged particle tracks reconstructed with at least four hits in the TPC and originating from within a cylinder of 2 cm radius and 20 cm length, centred on the nominal interaction point and parallel to the beam axis, are called good tracks. In addition to its rôle as a tracking device, the TPC also measures the specific energy loss by ionisation .
Electrons and photons are identified in the electromagnetic calorimeter (ECAL) by their characteristic longitudinal and transverse shower development. The calorimeter is a lead/wire-plane sampling detector with fine readout segmentation. Each tower element is projective, subtending an angle of in both and , and segmented longitudinally into three stacks. It provides a relative energy resolution of ( in ) for isolated electrons and photons. The three-dimensional fine segmentation allows a good spatial resolution to be achieved for photons and ’s in jets. Such deposits are separately identified and their energies evaluated by a fine clustering algorithm [11]. Muons are identified by their penetration pattern in the hadron calorimeter (HCAL), a 1.2 m thick iron yoke instrumented with 23 layers of streamer tubes, together with two surrounding double layers of muon chambers. The hadron calorimeter also provides a measurement of the energies of charged and neutral hadrons with a relative resolution of ( in ). At low polar angles, electromagnetic energy deposits are detected in the luminosity calorimeters (LCAL and SiCAL [11]) down to 34 mrad with respect to the beam axis.
3 Event Reconstruction
3.1 Simulation of electromagnetic deposits
Aiming for a precise measurement of to 1 part in 2000 imposes a level of understanding of this detector and its simulation not required in previous analyses of ALEPH data. The fine granularity and longitudinal segmentation of the ECAL detector elements [10] allow nearby energy deposits to be identified. The treatment of these deposits has been revised following a detailed simulation.
The normal simulation of the lateral and longitudinal development of electromagnetic energy deposits in the ECAL tower elements is based upon a parametrisation of showers measured in a test beam. This parametrisation was employed in the generation of all reference events used in the analysis ( events). It provides a good description of the individual shower cores but fails to simulate the correlated fluctuations in their development through the sampling layers of ECAL, which can lead to the production of objects separate from the main deposit, called satellites. Mostly below 1 and confined to one stack, the observed rate of such objects significantly exceeds expectation. To understand the origin of this discrepancy, a more complete simulation (FULLSIM) of the response of ECAL to electromagnetic showers was developed using GEANT3 [12]. The effect of correlated fluctuations is included. As expected, there is better agreement in the reproduction of low energy satellites. However, since FULLSIM was restricted to an average medium for the ECAL sampling layers, it does not describe the lateral shower shape as well as the parametrisation. Consequently, its use was confined to the study of calorimeter systematic effects for which samples of events were generated.
Specific studies with 45 Bhabha electrons show an excess in the data of objects formed entirely from connected elements from within the same stack. Similar effects are seen in the close neighbourhood of particles in jets. Not identified as electromagnetic, all single stack objects are removed from both data and simulated events unless related to a good track or a HCAL energy deposit. After this ECAL ‘cleaning’ process, the multiplicity of single stack objects in ECAL matches the prediction from FULLSIM. The multiplicity of identified photons is unaffected by this procedure. The ECAL cleaning removes 3% from the total energy of a hadronic jet both in the data and FULLSIM.
3.2 Energy flow
The total visible energy and momentum per event and thus the missing energy and momentum, are evaluated by an energy flow reconstruction algorithm [11] which combines all measurements from calorimeters and tracking devices. The algorithm also provides a list of charged and neutral reconstructed particles, called energy flow objects, from which jets are reconstructed. The four-momentum of a jet is defined as the sum of the four-momenta of all particles in the jet, assuming the pion mass for all charged hadrons. The typical jet angular resolution is 30 mrad in space. The jet energy resolution is approximately where (in ) is the jet energy.
In order to bring better agreement between data and simulation, all energy flow objects in data and simulated events found to subtend angles less than 15∘ to the beams are rejected. All photonic and hadronic objects identified only in the ECAL are rejected if their energies are less than 1.5 . Hadronic objects identified in the third stack of the ECAL combined spatially with an HCAL deposit are rejected if their energies are less than 2 . Objects with energies below these thresholds are not perfectly described by the simulation of the detectors.
3.3 Calibrations
Large samples of decays were collected at 91.2 CM energy at the start and end of LEP2 running each year. Di-lepton and di-jet events were used to monitor the performance of the detector and to compare reconstructed particle and jet four-momenta with the predictions of the simulation. The following subsections describe the corrections applied where significant discrepancies between data and simulation were found.
3.3.1 Charged particles
For charged particles, small sagitta corrections are applied in data as determined using di-muons. They are proportional to momentum and opposite in sign for positively and negatively charged particles reaching a relative difference of 2% for 45.6 tracks at the smallest polar angles.
3.3.2 Momentum of isolated leptons in e, events
Electron candidates from semileptonic decays are corrected for energy losses due to bremsstrahlung in the detector material by combining their four-momenta with those of any detected photons that are consistent with this hypothesis. These photons can appear either as an excess of energy in the ECAL electron cluster or as a separate deposit topologically consistent with bremsstrahlung. This correction is not applied when the electron is accompanied by other charged particles with summed momenta greater than 5 within of the electron track. In addition, for muon and electron candidates, a search is made for isolated final state (FSR) photons associated with the lepton. Such a photon must be closer to the good lepton track than to any other object or the beam axis and at least away from any other good track. Their four-momenta are then combined.
In addition to the treatment of sagitta distortion described in subsection 3.3.1, the simulation of electrons from Bhabha events at 91.2, 130-136 and 183-209 was compared with data. Small systematic biases as a function of polar angle and electron energy were found arising from an imperfect simulation of saturation and leakage effects in ECAL. The main effect is a global relative shift of 0.45% parametrised as (errors in brackets). This is applied as a correction to the simulated electrons to match the data. A similar study for muons yields a small miscalibration of the momentum at 45 (0.080.03%) with no significant dependence on momentum or polar angle. In this case, no corrections are applied.
3.3.3 Identified photons
Using the energy flow algorithm, photons are identified in ECAL both in isolation and from within clusters of overlapping objects. Any bias in the photon energies from the simulated events relative to data was investigated by comparing mass distributions made from tau pairs at the . In addition, directly measured single photons from events were compared event-by-event with the corresponding kinematically reconstructed values. Small biases are corrected to match the data, parametrised separately for the barrel, endcaps and the ‘overlap’ region in between.
3.3.4 Jets
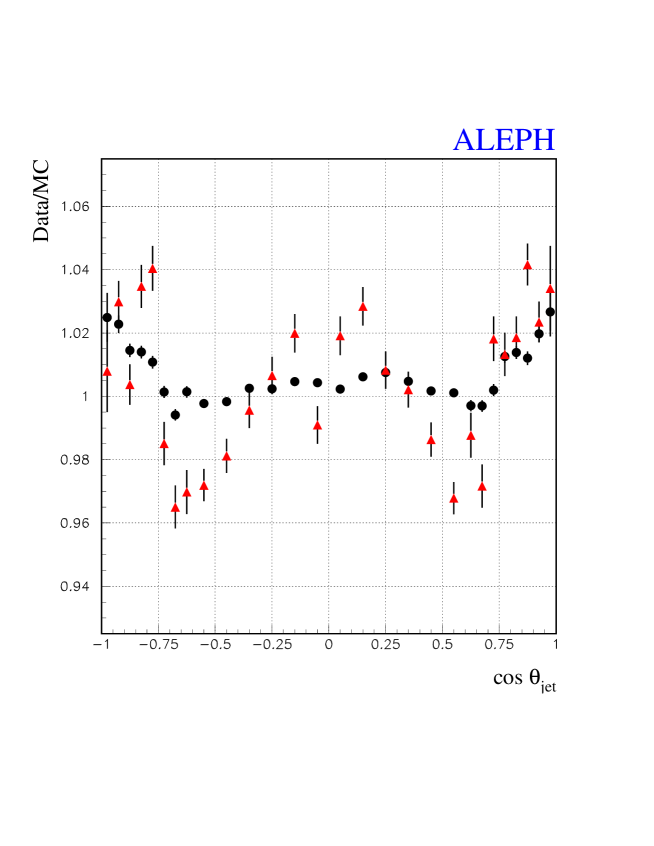
Following these corrections to the charged hadrons and photons within jets, simulated hadronic events at the with energies of 45 were compared with the data. The hadrons are clustered into two jets using the DURHAM-PE algorithm [13]. Only events with thrust values in the range 0.8 to 0.9925 are used, to suppress three-jet configurations and tau pairs. Using all calibration data collected during the LEP2 data taking periods, a statistical precision of about 0.2% on jet energies is obtained. Figure 1 shows the ratio of jet energies in data to simulation, determined from the mean values in each bin, as a function of jet polar angle . The relative biases in the barrel region do not exceed 0.5% and reach a maximum of 2.5% for . The Monte Carlo reconstructed jet energies are corrected bin-by-bin for these biases as a function of before event kinematic fits are applied. Figure 1 also shows the relative jet energy resolutions as determined from the RMS values of the distributions in each bin. The simulation agrees with the data to within 1% for the barrel and 4% for the endcaps; no correction is applied.
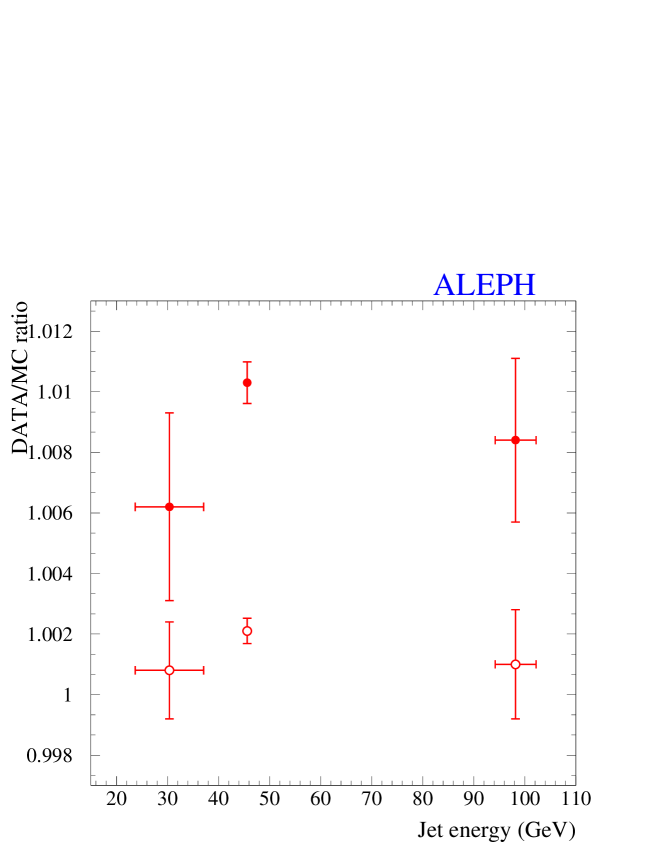
Variations in the corrections as a function of jet energy have been studied above 45 by comparing di-jet event samples from data and simulation at CM energies from 130 to 209 . Below 45 , a large sample of jets with energies centred at 307 were obtained from three-jet events at the peak. In this way, the full range of jet energies from decays is covered. Figure 2 shows the average ratios of measured jet energies in data to simulation for the barrel and endcap regions separately for three values of jet energies from 30 to 98 . No significant deviations are observed from the ratios found for 45 jets.
4 Simulation of Physics Processes
The KORALW event generator, version 1.51 [14], is used to produce pair events. These events are weighted by the correction to the doubly resonant W-pair process using the YFSWW3 program version 1.16 [9]. Within KORALW all four-fermion (4f) diagrams producing -like final states are computed, including Cabbibo suppressed decay modes, using the fixed-width scheme for and propagators. The JETSET 7.4 [15] or PYTHIA 6.1 [16] packages are used for the hadronisation of quarks in the final states. Their parameters are tuned at the from a selection of events with anti-b tagging. Colour reconnection and Bose-Einstein final state interactions are not included. A sample of 106 4f events was generated with KORALW at each of eight CM energies ranging from 182.7 to 206.5 [8]. The mass was set to 80.35 and the width taken from Standard Model (SM) predictions to be 2.094 . These samples are used as reference samples for fitting to the data in the reweighting procedure (Sec. 6), as well as for the study of detector systematic errors. Additional samples of 200k events were generated with masses up to 0.5 and widths up to 0.6 different from the reference sample, for checking the stability of the results. Also, an independent sample of 500k pair events was generated at each CM energy with KORALW restricted to the doubly resonant diagrams [8]. This sample is used to train neural networks and parametrise the corrections used in the kinematic fitting.
For studies of the systematic errors from fragmentation in decays, pair events generated with KORALW were hadronised using JETSET, HERWIG 6.2 [17] and ARIADNE 4.10 [18] and processed through the detector simulation. To suppress statistical fluctuations in the comparison between these models, the same events at the parton level were used. Similarly, simulated samples of 100k to 500k events, generated with KORALW, were hadronised with modified versions of JETSET [19, 20], HERWIG and ARIADNE [21] containing various implementations of colour reconnection, to assess the influence of final state interactions between decay products on the mass and width. The KORALW events were also hadronised with a version of JETSET that includes Bose Einstein correlations [22, 23], to determine their influence on the mass and width measurements.
Simulated samples of events of at least hundred times the data luminosity were generated for all background processes at each CM energy. The events were generated with KK version 4.14 [24] with hadronisation performed by PYTHIA and including final state photon radiation (FSR) in the parton shower step. Interference between initial and final state was not taken into account. Events from ZZ-like final states were generated using PYTHIA (NC08 diagrams), but particular care was taken to avoid double counting of ZZ events already included in the signal generation as WW-like events (i.e. ud, ,..). The same applies to Zee final states, generated with a 12 minimum mass for the Z system, for what concerns double counting of events. Two-photon () reactions into leptons and hadrons were simulated with the PHOT02 [25], PYTHIA and HERWIG generators but no events survived the selection cuts in the and channels. Di-lepton final states were simulated using KK for and and BHWIDE 1.01 [26] for ee events. Table 1 lists the number of simulated events passed through GEANT, generated for each process at each CM energy with corresponding integrated luminosities for the data.
| year | 1997 | 1998 | 1999 | 1999 | 1999 | 1999 | 2000 | 2000 |
|---|---|---|---|---|---|---|---|---|
| Energy () | 182.65 | 188.63 | 191.58 | 195.52 | 199.52 | 201.62 | 204.86 | 206.53 |
| Luminosity and | 56.81 | 174.21 | 28.93 | 79.86 | 86.28 | 41.89 | 81.41 | 133.21 |
| total error () | ||||||||
| - signal | 1200 | 1400 | 1200 | 1200 | 1200 | 1200 | 1200 | 1400 |
| -JETSET | 1000 | 1000 | ||||||
| -HERWIG | 1000 | 1000 | ||||||
| -ARIADNE | 1000 | 1000 | ||||||
| ZZ (NC08) | 200 | 200 | 200 | 200 | 200 | 200 | 200 | 200 |
| Zee () | 200 | 200 | 200 | 200 | 200 | 200 | 200 | 200 |
| 1000 | 3000 | 1000 | 3000 | 3000 | 1000 | 3000 | 3200 | |
| 300 | 300 | 300 | 350 | 300 | 300 | 300 | 300 | |
| 100 | 160 | 100 | 100 | 100 | 100 | 100 | 100 | |
| 2000 | 1200 | 2000 | 2000 | 2000 | 2000 | 2000 | 1000 | |
| -JETSET | 1000 | 1000 | ||||||
| -HERWIG | 1000 | 1000 | ||||||
| -ARIADNE | 750 | 750 | ||||||
| -BE32 | 150 | 150 | 150 | 150 | 150 | 150 | 150 | 150 |
| 700 | 1200 | 700 | 900 | 900 | 1100 | 900 | 1100 | |
| 600 | 1200 | 700 | 900 | 900 | 800 | 900 | 1100 | |
| 800 | 1200 | 700 | 900 | 900 | 800 | 900 | 1100 | |
| hadrons | ||||||||
| un-tagged | 1000 | 3000 | 500 | 1500 | 1500 | 500 | 1500 | 2500 |
| tagged | 500 | 1000 | 500 | 1000 | 1000 | 500 | 1000 | 1000 |
| CC03-JETSET | 500 | 500 | 500 | 500 | 500 | 500 | 500 | 500 |
| CR model SKI | 500 | 500 | 500 | 500 | 500 | 500 | 500 | 500 |
| CR model SKII | 500 | 500 | ||||||
| CR model SKII′ | 500 | 500 | ||||||
| CR model GAL | 250 | 250 | 250 | 250 | 250 | 250 | 250 | 250 |
| BE32 2 models | 300 | 300 | 200 | 200 | 300 | 200 | 200 | 300 |
| CC03-ARIADNE | 500 | 500 | 500 | 500 | 500 | 500 | 500 | 500 |
| CR model AR2 | 500 | 500 | 500 | 500 | 500 | 500 | 500 | 500 |
| CC03-HERWIG | 500 | 500 | 500 | 500 | 500 | 500 | 500 | 500 |
| CR model | 500 | 500 | 500 | 500 | 500 | 500 | 500 | 500 |
5 Event selections and kinematic reconstruction
In the following subsections, the event selections and kinematic reconstruction procedures for the mass extraction are described for the following four classes of events , , and . The selections are those required for the cross section measurement [8]. For the , , and channels, the cuts developed earlier at 189 [5] for the leptons and jets are used followed by re-optimised neural networks for the higher CM energies. A new selection has been developed for the channel. All selections are mutually exclusive.
5.1 selection
A first preselection step aims at removing events with an energetic undetected initial state radiation (ISR) photon from radiative returns to the by requiring that the absolute value of the total longitudinal momentum be less than where is the observed visible mass. All accepted particles are then forced to form four jets using the DURHAM-PE algorithm [13]. Only events where the jet resolution parameter, , is larger than 0.001 are kept. To reject events with a visible ISR photon, none of the four jets can have more than 95% of electromagnetic energy in a cone around any particle included in the jet. Four-fermion final states in which one of the fermions is a charged lepton are rejected by requiring that the leading charged particle of each jet carries less than 90% of the jet energy.
The same neural network (NN) as in Ref. [8], trained at five CM energies (189, 196, 200, 205 and 207 ) on Monte Carlo and background events, is used to tag the preselected events. There are 14 input variables based on global event properties, heavy quark flavour tagging, reconstructed jet properties and kinematics. The signal is well separated from the background with 90% efficiency and 80% purity by requiring a NN output in excess of 0.3 [8].
According to the simulation, a significant fraction (6%) of the accepted events are accompanied by an ISR photon that can be detected in the calorimeters separately from the hadronic jets. Such photons can be removed from the jet clustering process, thus improving the invariant mass resolution for pairs. Studies at 189 show that such photons with energies above 3 are identified in SiCAL or LCAL and above 5 in ECAL with an overall efficiency of 63% and purity of 72% if an isolation criterion based on a minimum angular separation from the closest energy flow object is applied. The minimum separation applied is 8∘ in SiCAL or LCAL and 18∘ in ECAL for all CM energies. These events are treated differently in the subsequent kinematic fit.
5.2 selection
A preselection common to the three lepton topologies requires at least seven tracks in the event. Background from events is reduced by requiring the estimated sum of missing energy and missing momentum to be greater than 35 . The events in which the photon is undetected are rejected by requiring the missing longitudinal momentum to be smaller than
where is the transverse missing momentum and is the missing energy.
Following the identification of the lepton and associated objects, the remaining particles are clustered into two jets using the DURHAM-PE algorithm as in the channel.
5.2.1 and selection
In addition to the common preselection, a tighter cut is used on the total visible energy and visible longitudinal momentum to further reject events:
where and are the visible energy and longitudinal momentum, respectively.
The lepton candidate is chosen as the good track with the largest P where P is the track momentum and is the angle from the track to the closest jet clustered from the remaining tracks using the DURHAM-PE algorithm (). Events are further considered if this lepton candidate satisfies the electron or muon criteria defined in Ref. [8] and if the sum of the lepton and missing energies is greater than 30 .
Two different NN’s have been trained to select and classify and signal events [8]. Both use three discriminant variables, the event transverse momentum, the lepton energy and the lepton isolation. The event is classified as or if the corresponding NN output value is larger than 0.6 [8]. The efficiency and purity of the selection are 82% and 93% respectively. The corresponding values for the channel are 89% and 98%.
Detailed studies of neutral objects not already classified as bremsstrahlung within of the electron track impact point on ECAL show a higher multiplicity than expected even after the removal of single stack objects (Sec. 3.1). The reference simulation fails to reproduce the data for angles up to 8∘. Further studies show that a smaller but still significant excess of charged objects are present in the data for both and events. Although the summed energy of these objects near the isolated lepton is small, their impact on the closest jet is significant, especially for the channel. Therefore, all these objects up to 8∘ from the lepton are removed from the jet reconstruction. Also, they are not included in the calculation of the lepton four-momentum.
5.2.2 selection
A new selection has been designed [8], based on an improved tau reconstruction [27]. Leptonic tau decays are searched for by examining those events with e or candidates which fail the or selection. These events are subjected to a similar three variable NN but trained on leptonic tau decays. Events with the NN output greater than 0.4 are kept [8].
After removing the events which have satisfied any of the three variable NN selections for , or , the remaining events are further examined for additional final states. Use is made of the fact that one-prong tau decays are characterised by a low visible mass with a mean about 0.75 . The first step is to perform a jet clustering using the JADE algorithm [28] with a low ( in ). The tau candidate is defined as the jet which maximises ), where is the smallest angle with respect to other jets and is the jet momentum. The event is then subjected to additional cuts, in particular the invariant mass of the hadronic recoil system to the tau candidate must be in the range 60 to 105 . For those events which fail, the procedure is repeated with increasingly higher values of . When this exceeds the iterations are stopped and the event is kept requiring only that the recoiling invariant mass is larger than 20 [8].
If a -jet candidate is found, the event is subjected to further cuts to remove the main backgrounds. Most of the interactions are rejected by requiring the visible mass of the event to be larger than 50 and the missing transverse momentum greater than 10 . The event is divided into two hemispheres with respect to a plane perpendicular to the thrust axis. The acollinearity angle between the two hemispheres is required to be less than to reject most of the background. About 80% of the events with a tau candidate satisfy these cuts but significant background remains, mainly from events. These events are then subjected to a 15 variable neural network. The event is selected if the result is greater than 0.4. The efficiency and purity of the selection are 65% and 86% respectively [8].
5.3 Kinematic fit
The biases and resolutions used in the kinematic fits for the jet energies and directions are determined from an independent simulated sample. The distributions of the differences between the reconstructed jet energies and angles and those of the jets built directly from the generated particles are binned in jet energy and polar angle. Each of these distributions is fitted to a Gaussian and the mean values and sigmas are fed to the fitting algorithms.
Except for the channel, pair events are treated as four body final states with either four jets or two jets, a charged lepton and neutrino to which the measured missing momentum is assigned. For each selected event, two invariant masses are computed from the decay products. In order to improve resolution, kinematic fits are made with the constraint of event four momentum conservation and fixing the velocities () of the jets to their measured values. Imposing energy and momentum conservation alone corresponds to a four-constraint (4C) fit in the case of fully hadronic events, and a one-constraint (1C) fit in the case of semileptonic events, giving two different fitted masses per event. An equal mass constraint for the two bosons corresponds, respectively, to a five (5C) or two-constraint (2C) fit. In the channel, since the tau energy is largely unknown due to neutrinos in the tau decay, only the hadronic side of the event is used with the sole constraint of the beam energy.
The average raw resolution of 12% on the total jet momentum improves by a factor 2 and by a factor up to 5 for polar angles down to 20 degrees, due largely to the kinematic fitting.
For all classes of events the fits converge successfully producing flat probability distributions for . The peak below is populated by events that do not fully satisfy the fitting hypothesis. Monte Carlo studies show that approximately half of these events have ISR energies greater than 0.5 , leading to a significant positive bias in the reconstructed di-jet masses. However, these events are not removed since the simulation adequately describes the observed probability distributions in all channels.
In the channel for those events with an identified ISR photon in the detector, the procedure of event clustering and fitting is modified [5]. In this case, the energy flow objects from which the ISR photon has been removed are forced into four jets. The fit is performed taking into account the modified constraints
Of the 4861 data events selected after all cuts, 220 are treated in this way. Monte Carlo studies at 189 show that the invariant mass resolution for these events improves from 4.1 to 2.9 and the mean displacement of the masses from their true values is zero within error. The improvement in the expected error on for all selected events is 2%.
Jet pairing in the channel
At most one of the three possible jet pairings is chosen, based on the the matrix element , where the ’s denote the kinematically fitted four-momenta of the respective jets and the reference mass, taken to be 80.35 . The combination with the largest value of is in general selected (in 90% of the cases), provided that (a) it does not have the smallest sum of jet-jet angles and (b) both fitted masses lie in the [60,110] window. Otherwise (in 10% of the cases) if it satisfies the same criteria, the combination with the next-to-largest value of is chosen. If the pairings with the two largest values of are not accepted, the event is rejected. At 189 [5] for example, the fraction of kinematically fitted signal events surviving these criteria is 80%. Of these events, 90% are found to have the correct combination of di-jets when comparing their directions to those of the original decays. The bias from the choice of reference mass is found to be negligible. In addition, the combinatorial and physical backgrounds do not show particular structure in the defined mass window.
6 Extraction of the W mass and width
The boson mass and width are extracted by fitting simulated invariant mass spectra to the observed distributions. As in previous analyses [3, 4, 5] an unbinned maximum likelihood procedure is employed to find the best fits, using probability density functions obtained from the binned distributions of reference event samples, reweighting the Monte Carlo signal events with the matrix elements corresponding to various values of and . Two types of fits are performed for all four channels individually. In the first, a one-parameter fit for is made, where varies with according to the Standard Model as . These results provide the most precise value of . In the second, two-parameter fits are performed allowing and to vary as two independent parameters. Although the shape of the invariant mass spectra are dominated by experimental resolutions, these fits are used to test the validity of the SM prediction for and check for any correlation between the two fitted parameters. Technically, the matrix element calculation assumes the Standard Model value for at a given mass, for the coupling of electrons and their neutrinos to bosons and allows the width to vary freely only in the propagator.
At LEP1, the mass was defined using a running-width scheme in the Breit-Wigner propagator. However, a fixed-width scheme has been employed in generating all events with KORALW. As a result, to make both mass measurements consistent with each other, a positive shift of 27 is applied to the extracted mass [29]. The corresponding shift to the fitted width of 0.7 is not significant.
The statistical error on and is computed from the fits to the data distributions. Also, a large number of subsamples are studied, each with the same number of events observed in the data, to evaluate the expected errors.
The selection efficiency is found to be independent of the mass. The variation of the total signal cross section with affects the purity of the selected events and is taken into account, whereas its dependence on is assumed to be negligible.
The reweighting procedure was tested at 189 and 207 by comparing the fitted with the input mass in each channel individually for four independent 4f Monte Carlo samples generated with values of 79.850, 80.100, 80.600 and 80.850 . The relationship between the fitted and true masses was found to be linear for all channels over this range. The best straight line fits through the points are consistent with calibration curves of unit slope and zero bias, within the statistical precision of the test. Small deviations are observed in the channel from which a systematic uncertainty is derived (Sec. 8.4).
Table 2 gives the expected and observed numbers of events from all contributing processes for each channel which satisfy the kinematic fitting criteria after all window cuts are applied. The numbers of expected events are calculated with corrections using the standard 4f reference samples generated at = 80.35 .
| Process | ||||
|---|---|---|---|---|
| 4264 | 0.1 | 0.0 | 5.0 | |
| 2.1 | 1217 | 0.1 | 120.4 | |
| 1.9 | 0.5 | 1295 | 41.7 | |
| 10.2 | 41.5 | 41.6 | 959.4 | |
| 591 | 17.9 | 0.6 | 35.4 | |
| 95 | 2.2 | 4.3 | 23.8 | |
| 2.2 | 7.4 | 0.0 | 16.3 | |
| 0.0 | 0.0 | 0.0 | 0.7 | |
| - | 0.2 | - | 0.4 | |
| - | 0.0 | - | 0.1 | |
| hadrons | - | 0.4 | - | 0.2 |
| Predicted events | 4966 | 1288 | 1342 | 1203 |
| Observed events | 4861 | 1259 | 1371 | 1226 |
| Purity (%) | 86.1 | 97.8 | 99.6 | 93.6 |
6.1 The channel
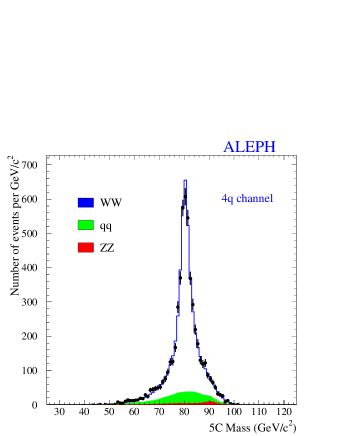
The two-dimensional reweighting fits used in the previously published analyses at 183 and 189 [4, 5] are replaced by three-dimensional (3-D) fits which better exploit the available information from each event. The following three estimators were selected: (i) the 5C fitted mass, , (ii) a random choice of one of the 4C di-jet unrescaled masses, and (iii) the kinematic fit error on the 5C mass, . Using a binned 3-D probability density function, a maximum likelihood fit is performed to the data within the following acceptance windows: , and for both the one and two-parameter fits. The allowed fit range for is loosely constrained to . Bin sizes in the probability density distribution of the 5C and 4C masses are chosen for signal and summed backgrounds separately such that the number of events of each type per bin is approximately constant. The third dimension is subdivided into four bins chosen dynamically to equalise the number of signal events in each bin. This binning is kept for the summed background. The fitted mass is extracted in each of these bins in the third dimension and the likelihoods combined to determine the final mass and error. To avoid any bias, the minimum number of signal Monte Carlo events per 3-D bin is 200.
Fig. 3(a) shows the mass distribution from the 5C kinematic fits to the data before the window cuts between 70 and 90 are applied. For comparison the mass distribution predicted from the simulation, reweighted to the fitted W mass in data, is superimposed.
6.2 The and channels
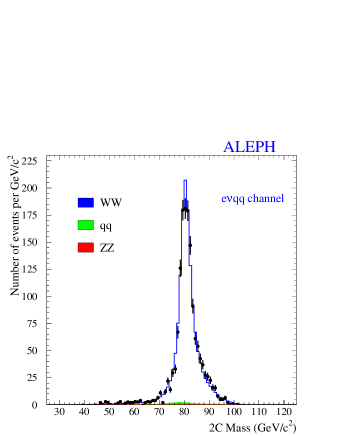
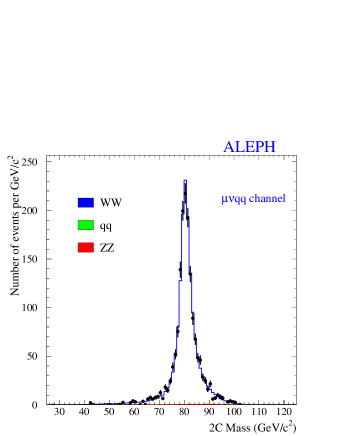
The following variables are used to form a three-dimensional (3-D) probability density function: the 2C mass, , where the leptonic and hadronic masses are constrained to be equal, the kinematic fit uncertainty on the 2C mass, and the 1C hadronic mass, . The event-by-event correlation between and was found to be 43% at 189 . By construction, the 3-D probability density function from the simulation takes into account all correlations amongst the three variables and leads to an improvement in statistical precision compared with a 1-D fit. Using a binned 3-D probability density function, a maximum likelihood fit is performed to the data within the following acceptance windows: , , and with the fitted being constrained in the range . The bin sizes for the Monte Carlo events are chosen using the same criteria as for the channel. The binning of the 3-D probability density function has 3 intervals along the event-by-event error axis. A stable mass value and statistical error are obtained when the minimum number of Monte Carlo events in any bin is 200 or greater.
Figs. 3(b) and (c) display the mass distributions for data resulting from the 2C kinematic fits to these semileptonic final states together with the predictions from the simulation.
6.3 The channel
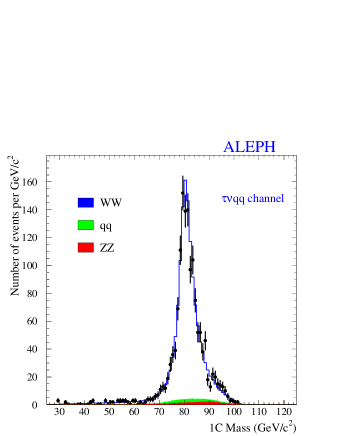
For candidates, a 2-D reweighting fit uses the 1-C hadronic mass, and its uncertainty, , from the kinematic fit. The events must be within the following mass and error acceptance windows: and . In this channel, the allowed fit range for is . The binning of the 2-D probability density function has four intervals along the event-by-event error axis and 60 intervals of varying size along the 1C mass axis.
Figs. 3(d) displays the mass distribution resulting from the 1C kinematic fits to the data events together with the prediction from the simulation.
 |
 |
 |
 |
7 Studies on colour reconnection
The W bosons decay at a short distance from each other ( fm), so that in the channel their decay products hadronise closely in space time at the typical hadronic scale of fm. An interaction between the partons from different W decays may then occur.
At the perturbative level, the shift in the reconstructed mass due to single gluon exchange is suppressed by the square of the number of colours and by an additional factor of /. The mass shift is of the order of a few [19]. However, when the scale of gluon exchange is not large compared with , non-perturbative colour reconnections (CR) in the parton cascades may lead to much larger shifts.
At energies well above the pair production threshold, as in the present data set, the final state QED interconnection between the W’s induces a shift in of order , which is a few [30] and insignificant compared with the uncertainties from non-perturbative QCD.
7.1 Monte Carlo models
At the non-perturbative level, all phenomenological implementations of CR
within existing hadronisation models predict that
the particle flow distributions per event are modified with the low
momentum particles in the inter-jet regions being most affected. Any
effect on high momentum particles would occur only when a jet from a is
aligned with another from a . Such a topology would not survive
the 4-jet selection.
The effect of CR on the fitted is studied using the
following variants of the parton evolution schemes:
(a) SKI, SKII, SKII′ [19] and GAL [20] in
JETSET,
(b) 2-step variants AR2 and AR20 [21] in ARIADNE and
(c) HWCR in HERWIG [17].
As formulated, the SK versions in JETSET predict no effect at the and therefore, unlike the other variants, cannot be calibrated with data. The probability of an event to be reconnected depends on the string overlap between partons from the two decays. In SKI, this is governed by a freely adjustable ‘string’ overlap parameter, , whereas the predictions of the SKII and SKII′ variants are fixed once the string parameters are fitted in JETSET. When is set to 0.65, the fraction of reconnected events is similar to SKII (29.2%) and SKII′ (26.7%). However, SKI(=0.65) predicts a larger shift in than the other SK versions. The authors state that all SK models are equally valid [31].
The GAL implementation within JETSET allows string rearrangements to occur by colour exchange with the probability for reconnection depending upon the reduction in total string area between the old and new configurations. After tuning at the on global event properties, the fitted value of a non-perturbative free ‘strength’ parameter, , is found to be 0.04 correlated with the shower cut-off, , of 1.57 . The author recommends a larger value for of 0.1 from fits to deep-inelastic scattering data which would lead to a correspondingly larger shift (100 ).
For AR2, both intra-W and inter-W reconnections are allowed between all dipoles with the same colour indices formed from emitted gluons with energy . The parton cascade is performed in two steps (i) allowing only intra-W reconnections with and (ii) allowing also inter-W reconnections but only for . For AR20, no CR is applied either between or within the ’s. In principle, the predicted net shift in due to inter-W reconnections is determined from the difference found between AR2 and the corresponding variant, AR21, where only intra-W reconnections are allowed. However, in practice it is found that the difference between AR20 and AR21 when tuned at the is not significant. Thus, the shift is taken from the comparison of AR2 and AR20 fitted events.
In HWCR, the criterion for allowing colour reconnections is based on the reduction in space-time distances within the colour singlet clusters at the end of the parton shower. The reconnection probability is set to for allowed re-arrangements. The parameter VMIN2, the minimum squared virtuality of partons, is set to 0.1 .
Table 3 gives the predicted mass shifts from these models averaged over CM energies from 183 to 209 . Details of the parameter settings used in the models are given in Appendix A.
| Model | () |
|---|---|
| SKI (=0.65) | +392 |
| SKI (=1.0) | +562 |
| SKII | +68 |
| SKII′ | +48 |
| AR2-AR20 | +545 |
| HWCR | +394 |
| GAL (=0.04) | +448 |
The predicted mass shifts from the models tunable at the : GAL, AR2 and HWCR, range from 40 to 55 , suggesting for consistency that the value of in the SKI model should be of order 0.8.
To examine the validity of some of the tunable models of CR at the , the particle distributions in selected three-jet events were compared specifically with the predictions of AR2 and GAL [32]. If it can be assumed that the behaviour of colour rearrangements in the parton cascades of decays is the same as for , these observations suggest that the two models overestimate the effects on from CR.
7.2 Data Analysis
Keeping the originally reconstructed jets in each selected event, the W mass analysis is repeated twice, either removing all low momentum particles (PCUT analysis) [27], or rejecting particles outside cones directed along the four jet axes (CONE analysis) [33]. The difference from the mass measured without these additional cuts, called the standard analysis, is a sensitive observable of the CR effect according to all the above models.
For each of five values of the particle momentum cut off from 1 to 3 in the PCUT analysis, each jet energy and angle is recomputed. In the CONE analysis, each jet energy is kept unchanged, whilst its three-momentum is recomputed from the vector sum of its remaining participating particles, rescaled by the ratio of the original jet energy to the energy of the particles inside the cone. Seven values of the cone opening angle R are used from 0.4 to 0.9 radians. Studies show that fragmentation uncertainties increase rapidly for momentum cut-offs beyond 3 or cone angles smaller than 0.4 radians. These values were found to provide optimal balance between statistical and systematic uncertainties on .
Figure 4 shows the expected variation of the mass due to CR as a function of the cut for the tuned AR2, HWCR and GAL models in the 183 to 209 energy range. The SKI predictions for two values of are also included. The predictions for each of the eight CM energies are combined using the relative integrated luminosities of the data. Table 4 lists the shifts, and , for the PCUT(=3 ) and CONE (R=0.4 rad) reconstructions respectively. The corresponding shifts in the standard analysis are shown for comparison. Within errors the shifts for each reconstruction are comparable for all tuned models and consistent with SKI (=1).
| Model | |||
|---|---|---|---|
| SKI (=1.0) | +562 | +194 | +233 |
| AR2-AR20 | +545 | +178 | +206 |
| HWCR | +394 | +137 | +147 |
| GAL (=0.04) | +448 | +2712 | +2211 |


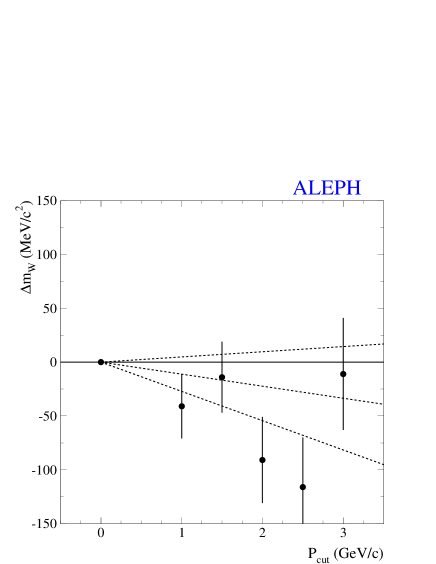
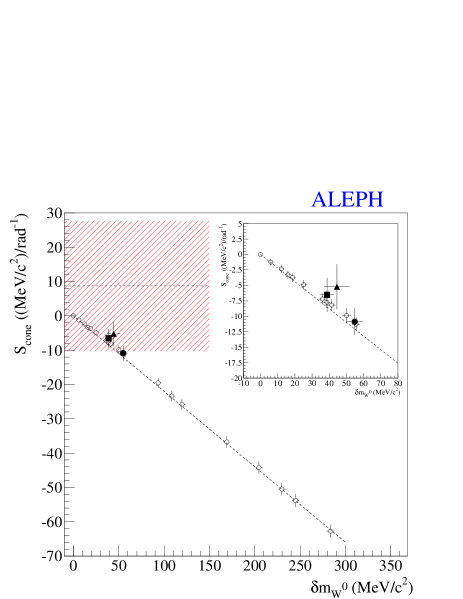
For the data collected at all CM energies combined, Fig. 5 shows the mass difference between a PCUT or CONE reconstruction and the standard mass analysis. The slopes are fitted with the full correlation matrix included and amount to ()/() for the PCUT analysis and ()/(rad-1) for the CONE. Both values are compatible with no effect.

A cross check was performed on all the semileptonic channels where no CR effect between the decay products of the different ’s can be present. The mass analyses in the and channels were repeated for PCUT and CONE following the same kinematic fit procedure as used in the channel where only the hadronic jets are included. Figure 6 shows the corresponding mass differences for each cut value relative to the standard analysis after combining the results statistically from the , and channels. No significant instability is observed.


The combined channels represent a sample of size similar to the size of the channel and give a slope of ()/() for the PCUT analysis and ()/(rad-1) for the CONE, which are not significantly different from zero.
A limit on can be inferred from a comparison between the slopes observed in the data and those from the CR models. For each model, pseudo-data samples were built, combining all the CM energy points weighted by their respective integrated luminosities. In the case of the SKI model, 20 different values of the parameter are chosen, ranging from 0 to 100.
The SKI model predicts a clear correlation between the mass shift for the standard reconstruction, , and the slope of the mass difference as a function of the PCUT or CONE cuts as shown in Fig. 7. The clustering of the slope values from AR2, HWCR and GAL, around for PCUT and similarly for CONE corresponds to the previously described values of quantified in Table 4.
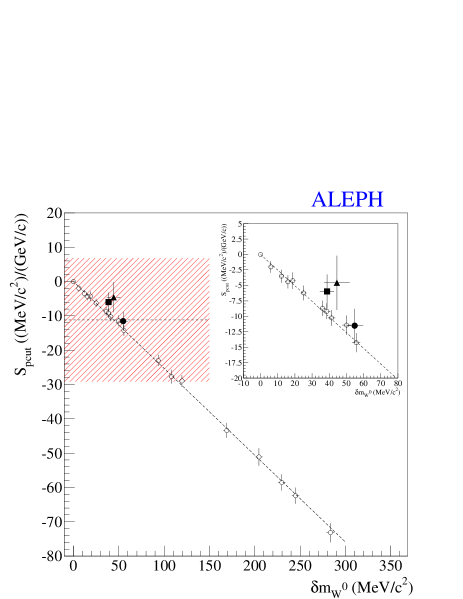
The covariance between the slopes, and , is computed as well as the resolution on the slopes from a Gaussian fit using the pseudo-data samples at each . The average correlation between the PCUT and CONE slopes is 51 % with little dependence on . The RMS errors on the slopes are 18 ()/() for the PCUT analysis and 19 ()/( rad-1) for the CONE analysis, in agreement with the values obtained in the data sample. A fit, defined as follows:
where signify PCUT and CONE respectively and the covariance matrix, is used to extract the 68% CL Gaussian upper limit on . The parameter can be either or .
The curve is shown in Fig. 8 as a function of . The upper limit on has been set to +78 , corresponding to the value at which the integral of the Gaussian likelihood from zero is 68% of the full integral over the allowed (positive) range.

The fragmentation uncertainty on this limit is estimated from the average bias on the slopes between an ARIADNE or HERWIG sample and the JETSET reference sample, repeated over the pseudo-data samples. The slope biases from ARIADNE, being largest, are used as diagonal terms of a systematic error matrix with 100% correlation between the PCUT and CONE slopes. This matrix is added to the statistical error matrix resulting in an increase in the mass limit to +86 . An estimate of the uncertainty in evaluating the statistical error matrix yields a further small increase in the mass limit to +87 (corresponding to (68% U.L.) = 1.88). Figure 8 shows the progressive effect of adding these systematic uncertainties to the fits.
The same procedure is used to determine the mass shifts and . The upper limits on these mass shifts are given in Table 5 together with the limit from the standard analysis.
Both AR2 and HWCR agree well with the SKI prediction of the slopes as a function of . However, the actual limit from SKI is larger than the AR2, HWCR and GAL absolute predictions and therefore is taken as the systematic uncertainty due to colour reconnection for each reconstruction.
In practice, these limits on the mass bias depend linearly on the CM energy within SKI. From 183 to 209 GeV, the limit varies from 45 to 105 when no cut is applied, 12 to 36 for the PCUT and 18 to 45 for the CONE respectively.
| (a)SKI(stat.) | (b)SKI(stat.+syst.) | |
|---|---|---|
| 78 | 87 | |
| 25 | 27 | |
| 32 | 35 |
8 Systematic uncertainties
Systematic uncertainties in the measurement of and arise from an incomplete description of the production process, inaccuracies in the simulation of event reconstruction in the detector and the modelling of the decays to di-jets. The following subsections describe all the systematic uncertainties evaluated for the standard analysis in each of the four event categories. They are also determined in the channel for the CONE (R=0.4 rad) and PCUT (=3 ) reconstructions where the potential effects of colour reconnection (CR) are minimised.
The LEP energy uncertainties with year-to-year correlations are taken from Ref. [34]. All other uncertainties in the analysis are evaluated at 189 and 207 , simultaneously in and from the two-parameter fits. When combining all the measurements, any variation over this energy range is taken into account using a linear interpolation for the intermediate CM energies. Table 8 lists all the systematic uncertainties for the standard analysis as well as the optimal PCUT and CONE reconstructions in the channel. The CR uncertainty in this channel is taken into account at each CM energy. Table 9 lists all the systematic uncertainties in the standard analyses of the three semileptonic channels.
8.1 Detector simulation
The systematic uncertainties in the detector simulation for the events are those arising from the quantitative comparison of the reconstructed jet four-momenta with the data as described in Sec. 3. For the and channels, the uncertainties in the lepton four-momenta are included and combined in quadrature with those from the jets. Subsidiary studies of particles within the jets have been made by comparing the simulation with data for the effect of photon energy miscalibration and charged hadron tracking discrepancies. These uncertainties are already taken into account in those quoted for the jets. Each uncertainty is evaluated by first comparing the mean fitted parameters from special pseudo-data samples with corresponding normal samples each of the size of the data. The mean shifts found in and are then rescaled to correspond to the residual discrepancies found between data and simulation after any corrections have been applied (Sec. 3.3).
8.1.1 Isolated lepton reconstruction in and events
Specific studies (Sec. 3.3.2) have been performed for electrons and muons. In the channel, the uncertainty is determined from the error (0.04%) in applying the global momentum correction of 0.45% combined with the percentage error of 0.0008% per in the evaluation of the momentum scale linearity, taking into account the correlation (+0.78). The small biases found as a function of polar angle have a negligible effect.
For the channel, the momentum uncertainty is derived from the full effect of the uncorrected global offset of 0.08%. The percentage error of 0.0025% per in the slope is added in quadrature, taking into account the correlation (-0.22).
Averaged over polar angle, the lepton momentum resolutions in the simulation are degraded by 13% and 8% for the electrons and muons respectively to match the data when averaged over all momenta. For , the effect is relatively insignificant but on it is the dominating contribution to the total systematic uncertainty in each channel.
A possible bias in the measurement of the lepton direction in the and channels was studied by comparing the lepton track and angles as measured by the VDET and the ITC + TPC separately [5]. No difference greater than a fraction of a mrad was observed. Owing to small offsets in the drift time of the TPC, the z-component of momentum can be biased for tracks away from to the beam axis. Conservatively, the effect on the lepton polar angle is parametrised maximally as mrad with respect to the beam axis. Events are generated accordingly, whilst keeping the lepton energy and the total momentum of the event conserved. The shift is negligible for both and . Any effect from possible lepton angle biases is also negligible.
Comparing the VDET and ITC + TPC track measurements [5], the spread of the differences in polar angle measurement for the electrons and muons was found to be of order 0.5 mrad. No mean discrepancy greater than 0.3 mrad between the data and Monte Carlo distributions was observed. Conservatively, an additional 0.5 mrad smearing has been applied to the simulation to compute the uncertainties attributable to the simulation of angular resolution. The shifts in are found to be negligible.
8.1.2 Jet energy corrections before the kinematic fit
As described in Sec. 3.3.4, the simulation of jet energies from di-jet events produced at the was compared with data in the range 30 to 70 . It was shown that (a) the bias in the relative global energy scale does not exceed 0.5% in the central region rising to 2.5% at low angles and (b) the relative slope of the data to simulation in the jet energy scale as a function of is flat setting a limit of per . Studies with special simulated samples show that the global bias has no significant effect on and for all channels. The systematic uncertainties assigned from the limit on the slope variation with is combined in quadrature with the shifts obtained from a mean 1% global discrepancy between barrel and endcaps. Disregarding the presence of b jets in the samples, introduces a shift of 0.25% in the relative global energy scale. Since this is only half of the bias taken into account, the effect due to b jets is negligible.
8.1.3 Jet energy resolution
As described in Sec. 3.3.4, the data and Monte Carlo resolutions in each bin as determined from the RMS spread of jet energies agree to within 2% for di-jet events at the . Special samples were made where the jet four-momenta and energies are smeared degrading the resolution by 10% with respect to the nominal values computed from the kinematic fit parametrisations. The shifts found are rescaled to correspond with the measured difference.
8.1.4 Jet angular bias
Possible discrepancies in the determination of were studied [5] by comparing, between data and simulation, the direction of the charged and neutral jet components in di-jet events. The tracking detectors and the ECAL were aligned independently but high statistics studies performed at 91.2 GeV show that their relative polar angle alignment is about 1 mrad. In order to measure any angular distortions, separately constructed charged and neutral components of jets are selected and their polar angle directions compared in bins of 5 degrees in /2. The simulation of the jet components is in good agreement with the data except in the overlap region between the barrel and endcap calorimeters where the difference is up to 2 mrad. The difference , parametrised as 0.7(0.2) - 2.4(0.6) mrad (errors in brackets), gives the best fit to these discrepancies. Further studies confirm that the effect of the global offset of 0.7 mrad is negligible since the uncertainties effectively cancel in by symmetry. The resulting systematic uncertainties are evaluated by applying this parametrisation without the offset to special Monte Carlo event samples assuming that /2.
8.1.5 Jet angular resolution
Selected di-jet events from the calibration runs have been used to measure the jet angular resolution for 45 jets from the distribution of the opening angles between the two jets. The PCUT and CONE criteria are also applied to the jets to measure the variation in jet angle resolution for these reconstructions. Special event samples with modified resolutions, which match the data, are used to estimate the effect on and for all channels. The resulting uncertainties in are very small.
8.1.6 Jet boosts
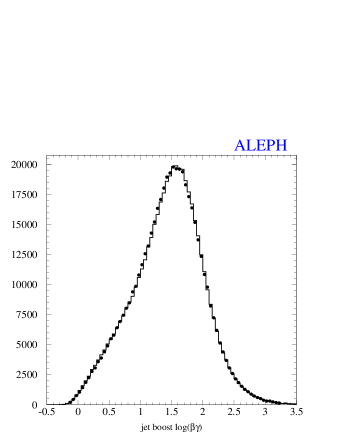
The accuracy of the Monte Carlo reconstructed jet masses in each channel depends sensitively on the simulation of the charged and neutral particle momenta and multiplicity distributions within the jets. Jet boosts, , are chosen rather than masses to compare data with simulation since any momentum discrepancies are factored out and double counting minimised. Figure 9 compares the data and Monte Carlo distributions of ) for jets built as in the standard analysis, integrated over all polar angles from (a) high statistics hadronic decays where the average jet momenta are close to those in decays, (b) higher energy di-jets, (c) hadronic decays for PCUT and (d) hadronic decays for CONE. These jet samples are studied rather than those from the selected pairs to avoid the possible influence of final state interactions and to benefit from high statistics. The study includes b-depleted samples and jets from radiative returns to the peak (Sec. 9).
 |
 |
 |
 |
Table 6 gives the largest shifts obtained between data and simulation expressed as . The small differences between central and forward regions of the detector are not statistically significant.
| Reconstruction | central | forward | combined |
|---|---|---|---|
| standard | 0.9 (0.2) | 0.7 (0.2) | 0.8 (0.1) |
| PCUT | 2.7 (0.2) | 1.9 (0.3) | 2.4 (0.2) |
| CONE | 2.1 (0.4) | 2.1 (0.5) | 2.1 (0.3) |
The systematic uncertainties in and are derived using special Monte Carlo samples rescaled to match the biases in this table.
8.2 Fragmentation of the decays to hadrons
In the previous analysis at 189 [5], the uncertainty due to the modelling was determined mainly from the comparison of and values using event samples in which fragmentation is simulated with HERWIG [17] or ARIADNE [18] in place of JETSET. A large uncertainty of 35 , fully correlated between channels was assigned. It has been found that the variation in baryon content between the models is largely responsible. The baryon multiplicities predicted by JETSET and ARIADNE agree with data at the [35] whereas HERWIG generates () fewer baryons per event.
The uncertainties in for each channel in the standard analysis are reassessed after correcting for this effect. In the channel, the bias in is found to depend linearly on the number of protons and neutrons per event. Taking samples with 0, 2, 4, 6 and 8 nucleons per event, the slope of the bias for all three models is statistically equivalent and found to be 20.10.8 per nucleon. A similar linear behaviour is seen in the , , and channels. The mass differences between the models due to the variation in their baryon content is evaluated from the linear dependences in each channel assuming that they apply over the entire range of baryon multiplicities. For HERWIG-JETSET and ARIADNE-JETSET , the mass shifts before and after correcting for the differences in baryon content are given in Table 7.
| HW-JT | AR-JT | |||
|---|---|---|---|---|
| Uncorrected | Corrected | Uncorrected | Corrected | |
| +128 | -78 | +39 | +59 | |
| +258 | +38 | +19 | +69 | |
| +108 | -87 | -118 | -78 | |
| +4011 | +1511 | +513 | +612 | |
After correction, the differences between HERWIG and JETSET become insignificant. All three fragmentation models agree within statistical error for all channels. The systematic uncertainty is set to 10 for the standard analysis, coherent in all channels. The variation in baryon content between the models has no significant effect on the values fitted for .
For the PCUT and CONE reconstructions in the channel, the uncertainties are determined from comparing the same event samples simulated with ARIADNE and JETSET where the variation in baryon content is not significant. Any residual differences (AR-JT) are due to other effects unrelated to baryon multiplicities and are taken to represent the uncertainties for these reconstructions. The differences are larger than the standard analysis but comparable for both reconstructions.
8.3 Radiative corrections
The uncertainties in the theoretical treatment of QED initial state radiation (ISR) and Coulomb corrections in KORALW as well as Next-to-Leading corrections in YFSWW3 are determined for each channel and reconstruction by comparing Monte Carlo samples with appropriate event weighting. The estimated shifts from each study are combined in quadrature.
8.3.1 Missing ISR corrections
Initial state radiation is simulated in KORALW up to , i.e. up to third order in the leading-log approximation. The effect of missing higher order ISR terms beyond on the measurement of and is estimated by measuring the respective shifts when this QED computation is downgraded to as originally suggested in Ref. [36]. Each event in a specially generated KORALW sample is weighted according to the calculated ratio of second to third order squared matrix elements: . Treated as data, fits are made to the weighted events selected in each channel and compared with those from the corresponding unweighted events to evaluate the shifts. The shifts in and are less than 1 in all channels.
8.3.2 Coulomb corrections
The unweighted events from KORALW include non-factorizable QED corrections [37] which effectively “screen” the Coulomb interaction [30] between the two ’s. It is suggested [38] that the difference between this “screened” Coulomb correction and no Coulomb correction can be used to assess an uncertainty. The differences are found to be less than 3 in all channels for both and .
8.3.3 Next-to-Leading corrections
These corrections are large, ranging for from 10 in the channel to 20 in the channel. Studies have shown [39] that the theoretical implementation of these corrections in RacoonWW [40] are in good agreement with YFSWW3. The following two possible contributions to the uncertainties in these corrections using YFSWW3 are considered.
(i) The main effect of the NL corrections is to modify the final state radiation (WSR) pattern of photons. In YFSWW3, the infra-red (IR) contributions to WSR and WSR-ISR interference are exponentiated to infinite order including non-IR Next-to-Leading contributions. The uncertainty in this calculation is estimated as suggested in Ref. [38] by removing the additional non-IR contributions. The effect is found to be small, less than 2 in for all channels and reconstructions. The shifts in are similar.
(ii) In calculating the weight per event from the YFSWW3 program, the recommended recipe by the authors [9] is an additive correction in which the Double-Pole approximation (DPA) for doubly resonant ’s is applied only to the part of the event weight. An alternative recipe would be to apply the NL correction also to the difference between the 4f and contributions - the so-called multiplicative NL correction. The additive correction is chosen as the default. The systematic uncertainties in and are estimated by measuring the difference between the additive and multiplicative implementations. These differences are less than 1.5 in all channels.
8.4 Calibration curves
As stated in Sec. 6, the reweighting procedure was tested by comparing the fitted with the input masses and widths in each channel individually. No deviations were observed in the fitted slopes or intercepts of the produced calibration curves except in the channel. Combining statistically the fitted masses at five points between 79.85 and 80.85 from 189 and 207 pseudo-data in this channel, the calibration curve for is found to be linear but with a slope of 0.9540.023. At the measured mass, this deviation from unity corresponds to an uncertainty of 10 in . A similar analysis for found no significant effect in the channel. An upper limit of 20 is assigned as the systematic uncertainty from the statistical precision of the test.
8.5 Background contamination
The expected numbers of events in each channel included in the reweighting fits from non- background processes are shown in Table 2.
The dominant background in the channel is (14% of all selected events) followed by (2%). The normalisations of the these contributions are varied conservatively by 5% and 10% respectively and the consequent shifts added in quadrature. In addition, the uncertainty in the fragmentation modelling of the events is estimated by replacing JETSET with ARIADNE; its impact is significant only for . The effect of any hadronisation uncertainty in the contribution is very small and has been ignored.
In all channels the contamination is relatively small but also dominated by events from the and processes. Their rates are also varied by 5% and 10% respectively to produce the quoted uncertainties in and . Any effect from hadronisation is found to be insignificant.
For all channels, the contributions are flat in the defined mass windows and their effects on and are negligible.
8.6 Final State Interactions in the 4q channel
8.6.1 Colour reconnection
The studies on the mass shift coming from possible colour reconnection between decay products of the W pairs have been discussed in section 7.
The mass differences obtained when comparing PCUT or CONE analyses with the standard analysis give no indication of an effect within our data statistics; nor do the differences in (Fig. 10). The upper limit derived with SKI exceeds the predictions of the HWCR, AR2 and GAL models. The predictions of AR2 and GAL on particle distributions in three jet events at the have been studied in Ref.[32]. They are disfavoured by the data. Disregarding the SKII and SKII′ models which predict a very small effect, the 68% upper limits on and obtained with the SK1 model are taken as conservative estimates for the systematic uncertainties from CR. The averaged values of in Table 5 are determined using only the statistical errors in at each CM energy. In the final optimising combination procedure, the systematic uncertainties for CR quoted in Table 8 are computed taking into account both the statistical and systematic uncertainties from all sources. For the standard analysis where the CR uncertainty dominates and varies significantly with CM energy, the value quoted in Table 8 is consequently reduced from 87 to 79 .


8.6.2 Bose Einstein correlations
The presence of Bose-Einstein correlations between the decay products of the two ’s in the selected events could influence the mass measurement [22, 36]. When simulated events are modified according to the JETSET-LUBOEI model [23] of Bose-Einstein correlations between the ’s, tuned on hadronic decay data, a shift on of 5 is predicted in the standard analysis. This shift is reduced in the optimal CONE or PCUT analysis by a factor of two. The ALEPH dedicated analysis of Bose-Einstein correlations based on the comparison of like-sign and unlike-sign pion pairs using the so-called “mixed” method, is described in Refs. [41, 42]. The data are in agreement with the hypothesis where Bose-Einstein correlations are present only for pions coming from the same . The JETSET-LUBOEI model with Bose-Einstein correlations applied also on pions from different bosons is disfavoured by up to 4.7 using the different variables studied. The systematic uncertainty on is determined from the fraction of the full prediction of this model which is consistent with these experimental results, using the value predicted with and without Bose-Einstein correlations between pions from different ’s. This fraction is %%, giving an uncertainty on of 6 , if a linear dependence between the shift and the value of this fraction is assumed.
8.7 LEP energy
The LEP beam energies were recorded every 15 minutes, or more frequently if required by the machine conditions. The instantaneous values recorded nearest in time to the selected events are used in the analysis. For the year 2000, as the CM energy was continuously increased, the dataset is split into two samples, the first integrating data at energies from 202.5 to 205.5 centred at 204.86 and the second including all data above 205.5 centred at 206.53 . The effect on of any discrepancy between the data and generated reference beam energies was investigated and found to range from 8 per difference at 189 to 16 per at 207 . The resulting uncertainties at each CM energy are small compared with the LEP energy uncertainties and have been ignored.
The year-on-year correlated uncertainties in the LEP beam energy taken from Ref. [34], are used to determine the quoted systematic uncertainties in and . The relative uncertainty on for the and channels is obtained directly from the relative error in whereas for the and channels, the relative uncertainty is 0.9. The effect of smearing in the event-by-event collision energy [34], which also introduces a longitudinal boost in the CM frame of ALEPH, are both taken into account in the evaluation of the uncertainty in .
| () | () | |||||
|---|---|---|---|---|---|---|
| Source | standard | PCUT | CONE | standard | PCUT | CONE |
| Jet energy scale/linearity | 2 | 2 | 3 | 2 | 12 | 4 |
| Jet energy resoln | 0 | 1 | 0 | 7 | 9 | 10 |
| Jet angle | 6 | 6 | 6 | 1 | 3 | 3 |
| Jet angle resoln | 1 | 3 | 2 | 15 | 18 | 9 |
| Jet boost | 14 | 15 | 11 | 5 | 5 | 4 |
| Fragmentation | 10 | 20 | 20 | 20 | 40 | 40 |
| Radiative Corrections | 2 | 2 | 2 | 5 | 7 | 7 |
| LEP energy | 9 | 10 | 10 | 7 | 7 | 7 |
| Ref MC Statistics | 2 | 3 | 3 | 5 | 7 | 7 |
| Bkgnd contamination | 8 | 5 | 5 | 29 | 31 | 32 |
| Colour reconnection | 79 | 28 | 36 | 104 | 24 | 45 |
| Bose-Einstein effects | 6 | 2 | 3 | 20 | 10 | 10 |
| () | () | |||||||
|---|---|---|---|---|---|---|---|---|
| Source | ||||||||
| e+ momentum | 3 | 8 | - | 4 | 5 | 4 | - | 4 |
| e+ momentum resoln | 7 | 4 | - | 4 | 65 | 55 | - | 50 |
| Jet energy scale/linearity | 5 | 5 | 9 | 6 | 4 | 4 | 16 | 6 |
| Jet energy resoln | 4 | 2 | 8 | 4 | 20 | 18 | 36 | 22 |
| Jet angle | 5 | 5 | 4 | 5 | 2 | 2 | 3 | 2 |
| Jet angle resoln | 3 | 2 | 3 | 3 | 6 | 7 | 8 | 7 |
| Jet boost | 17 | 17 | 20 | 17 | 3 | 3 | 3 | 3 |
| Fragmentation | 10 | 10 | 15 | 11 | 22 | 23 | 37 | 25 |
| Radiative corrections | 3 | 2 | 3 | 3 | 3 | 2 | 2 | 2 |
| LEP energy | 9 | 9 | 10 | 9 | 7 | 7 | 10 | 8 |
| Calibration ( only) | 10 | - | - | 4 | 20 | - | - | 9 |
| Ref MC Statistics | 3 | 3 | 5 | 2 | 7 | 7 | 10 | 5 |
| Bkgnd contamination | 3 | 1 | 6 | 2 | 5 | 4 | 19 | 7 |
9 Radiative returns to the peak
Radiative events where the invariant mass of the system is in the vicinity of the mass are selected over the full CM energy range = 183-209 . The hadronic final states producing two jets are analysed using the same jet reconstruction methods as applied to the decays, providing a cross check of the mass reconstruction. Furthermore, the analysis of the channel provides a direct measurement of the LEP energy [43] reaching an interesting precision when combined with the other LEP experiments [44].
Candidate events are required to have at least eight good tracks with total energy exceeding 20% of the nominal CM energy. The scalar sum of the transverse momentum components of the good tracks must further exceed 12% of the nominal CM energy. Identified photons with energy exceeding 5% of the nominal CM energy, and isolated from the good tracks, are rejected and ignored in the analysis. As described in Section 3.2 for the W mass analysis, all energy flow objects below 15∘ to the beams are rejected, and the same thresholds applied to ECAL and HCAL neutral objects. Reconstruction efficiencies for good tracks in data have been compared with the simulation at =91.2 revealing lower efficiencies for soft tracks from data in the forward direction. Correction factors have been applied to the simulation for tracks with and . Both this last correction for forward good tracks and the removal of neutral objects near the beam line are of crucial importance for the correct simulation of the forward region and the following reconstruction of the hadronic mass. The forward tracks correction was not applied to the generated events. However, its effect was found to be closely correlated to the jet angular bias discussed in Sec. 8.1.4 and covered by the corresponding systematic uncertainty. Figure 11 shows the distributions of the jet boosts in comparing data and simulation separately for central and forward reconstructed jets.
As in previous ALEPH studies of hadronic radiative returns [43], and similarly to the W mass reconstruction, the mass is obtained by clustering the hadronic system into two jets with the DURHAM-PE algorithm, and performing a kinematic reconstruction based on fixing the jet velocities to their measured values but rescaling their energies to conserve four-momentum. It is assumed that the ISR photon is emitted along the beam line, and thus the boost of the produced system is in the opposite direction. The di-jet rescaled mass can be expressed in terms of the polar angles () and velocities () of the two jets as
Requiring a di-jet rescaled mass in the window 75115 , a total of 25908 events are selected from the data compared with 25904 events from the simulation. The expected signal purity is 93.8%.
The shift of the mass peak is measured by means of an unbinned likelihood fit to a p.d.f. built from reference distributions. The calibration of the fit is done with pseudo-data samples and the small bias is corrected.
Various sources of systematic uncertainties on the measurement have been considered. Background uncertainties have been evaluated by varying the expected contribution of the background events as Zee (50%), We (25%) and (100%), leading to a combined effect on of 16 . Fragmentation systematics have been evaluated by comparing results obtained with different models JETSET, ARIADNE and HERWIG leading to an uncertainty on of 19 . For the calorimeter systematics that have an impact on the jet boost, different shower simulations have been used (Section 3.1) and in particular the use of FULLSIM leads to a difference in of 30 . For the tracking affecting the jet angles, half of the full effect due to reconstruction inefficiencies in the forward direction is taken as the systematic uncertainty of 16 . The uncertainty related to the ISR model is estimated to be 7 . The uncertainty coming from limited Monte Carlo statistics is dominated by the fit calibration uncertainty and is 12 . Using different fit methods the uncertainty due to the fit method is estimated to be 20 . Possible global biases of 0.2 mrad on the polar angle measurements of the good tracks lead to an uncertainty of 24 . The combined systematic uncertainty on due to all the above sources is then 54 .
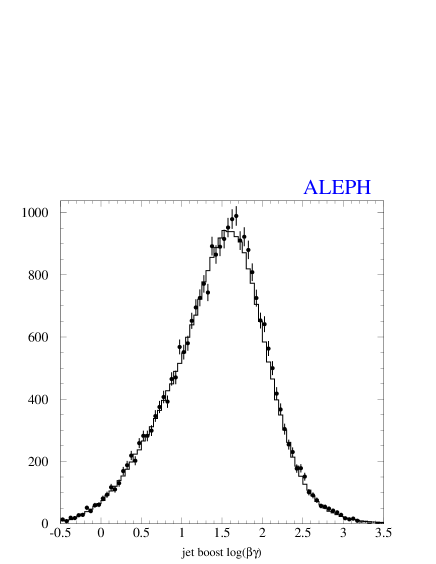

The resulting shift in the di-jet mass peak reconstruction in radiative events is
which is consistent with zero. This conclusion remains unchanged when the di-jet rescaled mass is evaluated using jets built with CONE, PCUT or with good tracks only. The jet reconstruction methods studied here are applied to the determination of the mass and similar uncertainties are used. Thus, these conclusions give further confidence in the mass analysis.
The previous result was obtained using the beam energies supplied by LEP. If the measurement is in turn interpreted as a shift of the nominal LEP2 CM energy, where is kept fixed to the published value,
is obtained, which again is in good agreement with zero.
The analysis of muon pairs from the process provides an additional check on the reconstruction of the LEP beam energies. Two variables are used (i) the plain invariant mass , defined as , where are the momenta of the two muons, is the angle between them and (ii) the angular mass given by
Selected di-muon events are required to be in the range and . A total of 976 events are selected from the data and 971.2 are expected from the simulation, with an expected signal purity of 93.4%.
Any discrepancy between data and simulation in the and distributions are evaluated as a shift of the data distribution with respect to reference distributions, and are measured with an unbinned likelihood fit calibrated with pseudo-data samples. Results from the two di-muon masses are combined in terms of a mean LEP CM energy shift giving
| (1) |
where the main sources of systematic errors come from (i) possible biases in the muon polar angle measurement up to mrad (52 ), (ii) the uncertainty from the shift fitting method (48 ) and (iii) from the absolute calibration of the muon momenta at the 0.5% level (24 ). This shift is 1.6 from the nominal LEP CM average energy, consistent with no significant effect.
10 Combined results
10.1 channel
mass
For each of the standard, optimal CONE and PCUT reconstructions, the individual measurements of and at each CM energy are combined weighted by their statistical errors and systematic uncertainties as shown in Table 8. Correlations in these uncertainties with CM energy are taken into account. The masses found from the one-parameter maximum likelihood fits to the data are given in Table 10.
| Reconstruction | standard | PCUT (3 ) | CONE (R=0.4) |
|---|---|---|---|
| Number of events | 4861 | 4484 | 4641 |
| 80.481 | 80.475 | 80.502 | |
| /dof | 7.4/7 | 4.9/7 | 5.1/7 |
| Statistical error | 0.058 | 0.070 | 0.070 |
| Experimental Uncertainty | 0.022 | 0.028 | 0.026 |
| FSI Uncertainty | 0.079 | 0.028 | 0.036 |
| Total error | 0.100 | 0.081 | 0.082 |
The experimental systematic uncertainties are derived from all sources in quadrature including the LEP CM energy. The FSI uncertainties are the limits from colour reconnection and Bose-Einstein effects added in quadrature. Taking into account correlations, the mass values are in good agreement for all three reconstructions. The total errors are also closely comparable but in the standard analysis, the systematic uncertainty due to FSI exceeds the statistical error. To suppress the dominant non-Gaussian contribution from colour reconnection, the result from the PCUT reconstruction with the smallest FSI uncertainty is selected to produce the final result to combine with the mass from the semileptonic channels.
The corresponding expected statistical error is 0.069 .
The masses with measured and expected statistical errors determined at each CM energy from the standard, CONE and PCUT analyses are given in Appendix B.
width
The widths found from the two-parameter maximum likelihood fits to the data are given in Table 11 for each reconstruction.
| Reconstruction | standard | PCUT (3 ) | CONE (R=0.4) |
|---|---|---|---|
| 2.31 | 2.48 | 2.34 | |
| /dof | 9/7 | 5/7 | 16/7 |
| Statistical error | 0.12 | 0.16 | 0.15 |
| Experimental uncertainties | 0.04 | 0.06 | 0.05 |
| FSI uncertainties | 0.11 | 0.03 | 0.05 |
| Total error | 0.16 | 0.17 | 0.17 |
The statistical error dominates the total systematic uncertainty in all three reconstructions. Therefore, the measurement from the standard analysis with the smallest total error is used in combination with the semileptonics to derive the most precise value for . Thus, the width from the channel is taken to be
The corresponding expected statistical error is 0.11 .
The widths with measured and expected statistical errors determined at each CM energy from the standard analysis are given in Appendix C.
10.2 , and channels
mass
The mass values in the standard analysis from the one-parameter fits to the data, with the statistical and systematic errors including the LEP energy, are
The expected statistical errors are 0.087, 0.082 and 0.122 for the , and semileptonic channels, respectively.
The individual measurements of for each channel are combined statistically at each CM energy. The combined semileptonic over all CM energies is determined by minimising a built from the full covariance matrix, taking into account all systematic uncertainties derived at each CM energy with the appropriate correlation and the statistical errors. The systematic uncertainties listed in Table 9 are found to be 89% correlated between and , 85% between and and 89% between and channels.
The resulting combined mass for the semileptonic channels from the one-parameter fits is
with a /dof of 38/23. The expected statistical error is 0.054 .
The masses with measured and expected statistical errors determined at each CM energy are given in Appendix B.
width
A two-parameter fit to the data gives the following results for the width in the standard analysis for each channel:
where the expected errors are determined to be 0.21, 0.20 and 0.31 for the , and channels respectively. The systematic uncertainties listed in Table 9 are found to be 100% correlated between and , 43% between and and 48% between and channels.
The widths with measured and expected statistical errors determined at each CM energy are given in Appendix C.
The combined total width from the two-parameter fits in all channels is
with a /dof of 15/21. The expected statistical error is 0.13 .
10.3 All channels
The combined results from all channels using the PCUT results in the channel for the mass and standard results for the width are:
The combinations are performed in the same way as described in section 10.2. The /dof is 43/31 and 26/29 for the mass and width combinations, respectively. Alternatively, if the mass from the CONE analysis in the channel is combined with those from the channels, the mass is:
Similarly, combining the mass from the standard analysis in the channel with those from the channels gives
To assess the effect of any unexpected correlation between the measured mass and width on the one-parameter fits where the width is fixed to standard model values, the mass from each channel is compared with the corresponding two-parameter fit results. Combining all channels in the standard analysis, the difference is found to be 8 indicating no significant effect.
To investigate whether there is a significant difference between the masses from the and combined channels due to final state interactions, a fit is performed to extract this difference retaining all systematic uncertainties from Tables 8 and 9 except those from Bose-Einstein correlations and colour reconnection. The standard analysis in the channel is used to enhance any effects. The result is
to be compared with the FSI uncertainty.
11 Conclusions
The mass and width of the boson have been measured from pair events using the direct reconstruction of the invariant mass of their decay products in fully hadronic and semileptonic final states. Following constrained kinematic fits to each event, the parameters were extracted by reweighting fully simulated invariant mass spectra to the measured distributions, employing an unbinned maximum likelihood procedure to find the best fits. To produce the most precise value of , one-parameter fits are performed where varies with according to the Standard Model. Two-parameter fits, where and are allowed to vary independently, are used to measure the width.
All data collected at centre-of-mass energies between 183 and 209 are fully reprocessed and analysed homogeneously to produce the final values with statistical errors. The systematic uncertainties are determined taking into account correlations between all channels and CM energies. For the mass, these measurements are combined with the earlier published ALEPH results obtained from the total pair cross sections at 161 [6] and 172 [7] to produce the final result as follows:
where the first error is statistical, the second derived from all ALEPH experimental systematic uncertainties, the third from the final state Bose-Einstein and colour reconnection uncertainties in the channel and the last is the LEP energy uncertainty. The L3 and OPAL collaborations have recently published their results [45, 46] using all their available data. Also, earlier results have been published by DELPHI [47] as well as final results from the Tevatron Run I collider experiments using large samples of single W’s decaying into electrons and muons [48].
No evidence is found for final state interactions between the hadronic decay products in the channel. The limit on colour reconnection is derived from the search for any significant variation in the value of when low momentum particles or those between jets are progressively excluded in the invariant mass reconstructions. To minimise any colour reconnection effects, the mass in the channel used in the final combination is taken from the reconstruction where all particles with momenta lower than 3 are removed.
This measurement of the mass agrees with the earlier ALEPH measurement [5] and other measurements [45, 46, 47, 48] as well as with the indirect prediction from the Standard Model fit to electroweak observables [1]. The consistency with the electroweak fit is only possible if the Standard Model Higgs boson is light.
Acknowledgements
It is a pleasure to congratulate our colleagues from the CERN accelerator divisions for the very successful operation of LEP2. We are indebted to the engineers and technicians in all our institutions for their contributions to the excellent performance of ALEPH. Those of us from non-member countries thank CERN for its hospitality.
Appendix A: Generator setup tunings used for CR studies
Modified values of hadronisation and fragmentation parameters are tabulated for the model variants of GAL and ARIADNE with CR using the JETSET framework. The modified parameters with and without CR for the HERWIG model are also tabulated. The internal name of the parameters is given in each case. The unmodified parameters used in the generation of events for all models without CR are given in Ref. [49].
| JETSET | GAL | ARIADNE | ||
| Parameter | standard and | no CR | intra-W only(AR21)/ | |
| SK models | (AR20) | intra and inter-W(AR2) | ||
| azimuthal distribution | 3 | 0 | - | - |
| in PS MSTJ(46) | ||||
| momentum transverse | ||||
| width for hadron | 0.371 | 0.364 | 0.358 | 0.352 |
| PARJ(21) () | ||||
| LUND fragmentation | ||||
| parameter b PARJ(42) | 0.805 | 0.815 | 0.823 | 0.762 |
| () PARJ(81) | 0.291 | 0.307 | ||
| cut-off in PS () | ||||
| PARJ(82) | 1.52 | 1.57 | ||
| strength parameter | - | 0.039 | - | - |
| Colour Reconnection | ||||
| switch MSTA(35) | - | - | 0 | 1 (AR21) or 2 (AR2) |
| () PARA(1) | - | - | 0.230 | 0.231 |
| ptmin cut () | ||||
| PARA(3) | - | - | 0.791 | 0.781 |
| cut () | - | - | 0. | 2. |
| PARA(28) | ||||
| HERWIG | |||
| Parameter | no CR | with CR | |
| () | QCDLAM | 0.190 | 0.187 |
| Maximum cluster mass | CLMAX | 3.39 | 3.40 |
| Split cluster spectrum parameter | |||
| light flavour clusters | PSPLT(1) | 0.945 | 0.886 |
| heavy flavour clusters | PSPLT(2) | 0.330 | 0.320 |
| Width of gaussian angle smearing | CLSMR(1) | 0.58 | 0.66 |
| Decuplet baryon weight | DECWT | 0.71 | 0.70 |
| CR probability | PRECO | 0. | 1/9 |
| Gluon mass | RMASS(13) | 0.774 | 0.793 |
Appendix B: masses from the standard, optimal CONE and PCUT analyses
| Channel | CM energy | Expected error | ||
|---|---|---|---|---|
| () | () | () | ||
| 183 | 435 | 80.5250.168 | 0.171 | |
| 189 | 1169 | 80.5180.105 | 0.102 | |
| 192 | 234 | 79.9950.235 | 0.235 | |
| 196 | 556 | 80.5060.151 | 0.151 | |
| 200 | 627 | 80.3030.151 | 0.146 | |
| 202 | 283 | 80.6350.206 | 0.218 | |
| 205 | 589 | 80.5830.149 | 0.146 | |
| 207 | 968 | 80.5730.119 | 0.118 | |
| 183 | 112 | 80.4400.265 | 0.276 | |
| 189 | 317 | 80.4370.170 | 0.162 | |
| 192 | 52 | 80.6210.502 | 0.404 | |
| 196 | 148 | 80.4200.244 | 0.250 | |
| 200 | 160 | 80.6070.247 | 0.251 | |
| 202 | 96 | 80.2030.303 | 0.363 | |
| 205 | 140 | 81.0890.276 | 0.269 | |
| 207 | 234 | 80.6200.218 | 0.212 | |
| 183 | 98 | 79.9910.265 | 0.259 | |
| 189 | 344 | 80.1850.160 | 0.153 | |
| 192 | 60 | 80.4830.385 | 0.381 | |
| 196 | 149 | 81.1090.246 | 0.236 | |
| 200 | 171 | 79.8840.237 | 0.233 | |
| 202 | 86 | 81.2100.324 | 0.334 | |
| 205 | 165 | 80.4090.250 | 0.250 | |
| 207 | 298 | 80.2770.186 | 0.197 | |
| 183 | 97 | 80.5950.414 | 0.396 | |
| 189 | 306 | 80.2770.230 | 0.232 | |
| 192 | 59 | 80.9500.551 | 0.548 | |
| 196 | 158 | 80.5890.343 | 0.347 | |
| 200 | 163 | 80.2100.345 | 0.348 | |
| 202 | 70 | 80.6760.515 | 0.509 | |
| 205 | 149 | 80.7500.352 | 0.370 | |
| 207 | 224 | 79.9590.299 | 0.296 |
| Channel | CM energy | Expected error | ||
|---|---|---|---|---|
| () | () | () | ||
| 183 | 420 | 80.6070.214 | 0.229 | |
| 189 | 1116 | 80.5280.138 | 0.132 | |
| 192 | 224 | 80.4770.309 | 0.319 | |
| 196 | 537 | 80.4700.195 | 0.194 | |
| 200 | 589 | 80.2300.203 | 0.191 | |
| 202 | 272 | 81.0040.305 | 0.278 | |
| 205 | 565 | 80.5470.202 | 0.197 | |
| 207 | 918 | 80.4280.163 | 0.159 |
| Channel | CM energy | Expected error | ||
|---|---|---|---|---|
| () | () | () | ||
| 183 | 409 | 80.5870.219 | 0.230 | |
| 189 | 1089 | 80.5290.138 | 0.134 | |
| 192 | 214 | 79.9350.316 | 0.322 | |
| 196 | 519 | 80.5170.197 | 0.198 | |
| 200 | 572 | 80.3570.203 | 0.197 | |
| 202 | 256 | 80.6140.320 | 0.281 | |
| 205 | 541 | 80.3330.205 | 0.200 | |
| 207 | 884 | 80.5880.165 | 0.159 |
Appendix C: widths from the standard analysis
| Channel | CM energy | Expected error | |
|---|---|---|---|
| () | () | () | |
| 183 | 1.8940.336 | 0.350 | |
| 189 | 2.5200.242 | 0.214 | |
| 192 | 2.7610.581 | 0.530 | |
| 196 | 2.0220.331 | 0.319 | |
| 200 | 2.8650.378 | 0.311 | |
| 202 | 2.1340.545 | 0.453 | |
| 205 | 1.7900.345 | 0.315 | |
| 207 | 2.5180.276 | 0.247 | |
| 183 | 2.4940.718 | 0.657 | |
| 189 | 1.6620.353 | 0.397 | |
| 192 | 2.1841.172 | 0.811 | |
| 196 | 1.7910.623 | 0.611 | |
| 200 | 2.9090.715 | 0.606 | |
| 202 | 3.2461.046 | 0.764 | |
| 205 | 1.2100.493 | 0.634 | |
| 207 | 1.6940.463 | 0.508 | |
| 183 | 1.8940.630 | 0.632 | |
| 189 | 1.7950.355 | 0.384 | |
| 192 | 1.9550.916 | 0.783 | |
| 196 | 2.6670.700 | 0.576 | |
| 200 | 2.1870.582 | 0.572 | |
| 202 | 2.5660.957 | 0.750 | |
| 205 | 3.6940.801 | 0.606 | |
| 207 | 2.1860.454 | 0.486 | |
| 183 | 2.4461.089 | 0.848 | |
| 189 | 1.7200.527 | 0.565 | |
| 192 | - | 0.965 | |
| 196 | 0.9770.501 | 0.776 | |
| 200 | 1.8080.761 | 0.776 | |
| 202 | 2.2841.226 | 0.925 | |
| 205 | 2.1710.830 | 0.818 | |
| 207 | 2.4290.862 | 0.700 |
In the channel, the two-parameter fits fail to converge for the width at 192 and 196 GeV even though the allowed range is 0.9 to 4.3 GeV. At 196 GeV, a one-parameter fit is successfully performed fixing the mass to the measured value given in Appendix B.
References
- [1] The ALEPH, DELPHI, L3, OPAL, SLD Collaborations, the LEP Electroweak Working Group, the SLD Electroweak and Heavy Flavour Groups, Precision Electroweak Measurements on the Z Resonance, CERN-PH-EP/2005-041, SLAC-R-774, hep-ex/0509008, (2005) to be published in Physics Reports.
- [2] The CDF and D0 Collaborations and the Tevatron Electroweak Working Group, Combination of CDF and D0 results on the top-quark mass, hep-ex/0404010, (2004).
- [3] ALEPH Collaboration, Measurement of the W mass by Direct Reconstruction in collisions at 172 , Phys. Lett. B422 (1998) 384.
- [4] ALEPH Collaboration, Measurement of the W mass by Direct Reconstruction in collisions at 183 , Phys. Lett. B453 (1999) 121.
- [5] ALEPH Collaboration, Measurement of the W Mass and Width in Collisions at 189 , Eur. Phys. J. C17 (2000) 241.
- [6] ALEPH Collaboration, Measurement of the W mass in collisions at production threshold, Phys. Lett. B401 (1997) 347.
- [7] ALEPH Collaboration, Measurement of the W-pair cross section in collisions at 172 , Phys. Lett. B415 (1997) 435.
- [8] ALEPH Collaboration, Measurement of W-pair production in collisions at centre-of-mass energies from 183 to 209 , Eur. Phys. J. C38 (2004) 147.
- [9] S. Jadach et al., Comp. Phys. Commun. 140 (2001) 432.
- [10] ALEPH Collaboration, ALEPH: A detector for electron-positron annihilations at LEP, Nucl. Inst. Meth. A294 (1990) 121.
- [11] ALEPH Collaboration, Performance of the ALEPH detector at LEP, Nucl. Inst. Meth. A360 (1995) 481.
- [12] GEANT3 Manual, CERN Program Library Long Writeup W5013 (1994).
- [13] Yu.L. Dokshitzer, J. Phys. G17 (1991) 1441.
- [14] S. Jadach et al., Comp. Phys. Commun. 140 (2001) 475.
- [15] T. Sjöstrand, Comp. Phys. Commun. 82 (1994) 74.
- [16] T. Sjöstrand et al., Comp. Phys. Commun. 135 (2001) 238.
- [17] G. Corcella et al., JHEP 0101 (2001) 010.
- [18] L. Lönnblad, Comput. Phys. Commun. 71 (1992) 15.
- [19] T. Sjöstrand and V.A. Khoze, Z. Phys. C62 (1994) 281; Phys. Rev. Lett. 72 (1994) 28.
-
[20]
J. Rathsman, Phys. Lett. B452 (1999) 364;
A. Edin, G. Ingelman, J. Rathsman, Phys. Lett. B366 (1996) 371; Z. Phys. C75 (1997) 57. - [21] L. Lönnblad, Z. Phys. C70 (1996) 107 and private communication.
- [22] L. Lönnblad and T. Sjöstrand, Phys. Lett. B351 (1995) 293.
- [23] L. Lönnblad and T. Sjöstrand, Eur. Phys. J. C2 (1998) 165.
- [24] S. Jadach, B.F.L. Ward and Z. Wa̧s, Comput. Phys. Commun. 130 (2000) 260.
- [25] J. A. M. Vermaseren, Proceedings of the IV International Workshop on Gamma Gamma Interactions, eds G. Cochard, P. Kessler (1980).
- [26] S. Jadach et al., Phys. Lett. B390 (1997) 298.
- [27] D.Boumediene, Mesure de la masse du boson dans l’expérience ALEPH, Thèse de Doctorat de l’Université Paris VI (2002), DAPNIA-2002-03-T, CERN-THESIS-2003-008.
-
[28]
W. Bartel et al.,
Z. Phys. C 33 (1986) 23;
S. Bethke et al., Phys. Lett. B213 (1988) 235. - [29] Determination of the mass of the boson, in Physics at LEP2, CERN 96-01, eds. G. Altarelli, T. Sjöstrand and F. Zwirner, vol. 1, p. 141.
-
[30]
V.A. Khoze and T. Sjostrand, Z. Phys. C 70 (1996)
625;
W. Beenakker, A.P. Chapovsky and F.A. Berends, Nucl. Phys. B508 (1997) 17; Phys. Lett. B411 (1997) 203;
A. Denner, S. Dittmaier and M. Roth, Phys. Lett. B429 (1998) 145; Nucl. Phys. B519 (1998) 39. - [31] T. Sjöstrand, private communication.
- [32] ALEPH Collaboration, Test of colour reconnection models using three-jet events in hadronic Z decays, hep-ex/0604042, submitted to Eur. Phys. J. C.
- [33] H. Ruiz-Pérez, Measurement of the W mass from the channel with the ALEPH detector, Ph.D. Dissertation Universitat Autònoma de Barcelona, CERN-THESIS-2003-004.
- [34] R. Assmann et al., LEP Energy Working Group, Calibration of centre-of-mass energies at LEP2 for a precise measurement of the boson mass, Eur. Phys. J. C39 (2005) 253.
- [35] ALEPH Collaboration, A measurement of the semileptonic branching ratio and a study of inclusive production in Z decays, Eur. Phys. J. C5 (1998) 205.
- [36] S. Jadach and K. Zalewski, Acta Phys. Pol. B28 (1997) 1363.
- [37] A. P. Chapovsky and V. A. Khoze, Eur. Phys. J. C9 (1999) 449.
-
[38]
M. Skrzypek et al., Phys. Lett. B523 (2001) 117;
W. Placzek, private communication. - [39] F. Cossutti, Eur. Phys. J. C44 (2005) 383.
- [40] A. Denner, S. Dittmaier, M. Roth and D. Wackeroth, Nucl. Phys. B560 (1999) 33; Nucl. Phys. B587 (2000) 67; Phys. Lett. B475 (2000) 127; EPJdirect Vol.2 C4 (2000) 1.
- [41] ALEPH Collaboration, Bose-Einstein correlations in W-pair decays, Phys. Lett. B478 (2000) 50.
- [42] ALEPH Collaboration, Bose-Einstein correlations in W-pair decays with an event-mixing technique, Phys. Lett. B606 (2005) 265.
- [43] ALEPH Collaboration, Determination of the LEP centre-of-mass energy from events, Phys. Lett. B464 (1999) 339.
-
[44]
DELPHI Collaboration, A Determination of the Centre-of-Mass Energy at
LEP2 using Radiative 2-fermion Events, CERN-PH-EP/2005-050, to be published
in Eur. Phys. J. C.
L3 Collaboration, Measurement of the Z-boson mass using Z-gamma events at Centre-of-Mass Energies above the Z pole, Phys. Lett. B585 (2004) 42.
OPAL Collaboration, Determination of the LEP Beam Energy using Radiative Fermion-pair Events, Phys. Lett. B604 (2004) 31. -
[45]
OPAL Collaboration,
Measurement of the mass and width of the boson,
Eur. Phys. J. C45 (2006) 307. -
[46]
L3 Collaboration,
Measurement of the mass and width of the boson at LEP,
Eur. Phys. J. C45 (2006) 569. - [47] DELPHI Collaboration, Measurement of the mass of the W boson using direct reconstruction at = 189 GeV, Phys. Lett. B511 (2001) 159.
-
[48]
CDF Collaboration, Measurement of the W boson mass with the Collider
Detector at Fermilab, Phys. Rev. D64 (2001) 052001.
D0 Collaboration, Improved boson mass measurement with the D0 detector, Phys. Rev. D66 (2002) 012001. - [49] ALEPH Collaboration, Studies of Quantum Chromodynamics with the ALEPH detector, Phys. Rep. 294 (1998) 1.