Corresponding Author: ] htwong@phys.sinica.edu.tw; Tel:+886-2-2789-6789; FAX:+886-2-2788-9828.
TEXONO Collaboration
Search of Neutrino Magnetic Moments with a High-Purity Germanium Detector at the Kuo-Sheng Nuclear Power Station
Abstract
A search of neutrino magnetic moments was carried out at the Kuo-Sheng Nuclear Power Station at a distance of 28 m from the 2.9 GW reactor core. With a high purity germanium detector of mass 1.06 kg surrounded by scintillating NaI(Tl) and CsI(Tl) crystals as anti-Compton detectors, a detection threshold of 5 keV and a background level of 1 near threshold were achieved. Details of the reactor neutrino source, experimental hardware, background understanding and analysis methods are presented. Based on 570.7 and 127.8 days of Reactor ON and OFF data, respectively, at an average Reactor ON electron anti-neutrino flux of , the limit on the neutrino magnetic moments of at 90% confidence level was derived. Indirect bounds on the radiative decay lifetimes were inferred.
pacs:
14.60.Lm, 13.15.+g, 13.40.EmI I. Introduction
The strong evidence of neutrino oscillations from the solar, atmospheric as well as long baseline accelerator and reactor neutrino measurements implies finite neutrino masses and mixings pdg04 ; nu04 . Their physical origin and experimental consequences are not fully understood. Experimental studies on the neutrino properties and interactions can shed light to these fundamental questions and provide constraints to the interpretations in the future precision oscillation experiments.
The couplings of neutrinos with the photons are generic consequences of finite neutrino masses, and are one of the important intrinsic neutrino properties nuprop to explore. The neutrino electromagnetic vertex can be parametrized by terms corresponding to interactions without and with its spin, identified as the “neutrino charge radius” and “neutrino magnetic moments”, respectively.
This article reports on a search of the neutrino magnetic moments with reactor neutrinos at the Kuo-Sheng (KS) Nuclear Power Station in Taiwan. It extends over our previous publication prl03 and covers the reactor neutrino spectra () and the other experimental features in details. A factor of three larger data sample was used, and an analysis procedure combining information from all measured spectra was devised.
II II. Neutrino Magnetic Moments
An overview on the particle physics aspects of neutrino magnetic moments can be referred to a recent review munureview and the references therein. The neutrino magnetic moment () is an experimentally observable parameter which characterizes a possible coupling between neutrino mass eigenstates and with the photon whereby the helicity-state is flipped:
| (1) |
as depicted schematically in Figure 1. The vertex marked “?” denotes the unknown physics to be explored. The parameter is usually expressed in units of the Bohr magneton:
| (2) |
where is the fine-structure constant and is the electron mass. Both diagonal and transition moments are possible, corresponding to the cases where and , respectively. Symmetry principles place constraints on the possible channels kaysernieves and require that the diagonal moments vanish for Majorana neutrinos. The study of neutrino magnetic moments is, in principle, a way to distinguish between Dirac and Majorana neutrinos a crucial unresolved issue in neutrino physics. For example, if a finite is observed in the laboratory, and electron anti-neutrinos () from the Sun is detected with a spectrum consistent with the oscillation and solar model parameters, neutrinos would be Majorana particles. Recent derivations munubounds of model-independent -ranges indicated that upper bounds for Dirac neutrinos are several orders of magnitude more stringent than the current experimental limits. Consequently, observations of at the present sensitivities will imply that neutrinos are Majorana.

Once a model is specified, the vertex “?” is known and can be calculated from first principles. Minimally-Extended Standard Model with massive Dirac neutrinos mesm gives which is far too small to have any observable consequences. Incorporation of additional physics, such as Majorana neutrino transition moments or right-handed weak currents, can significantly enhance to the experimentally relevant ranges bsm . Supersymmetry as well as extra-dimensions extradim can also contribute to the process.
The parameter for neutrinos with energy produced as at the source and after traversing a distance L is given by vogelbeacom
| (3) |
where Uli is the neutrino mixing matrix and are the coupling constants between and with the photon. Consequently, is therefore an effective and convoluted parameter and the interpretations of experimental results depend on the exact compositions at the detectors. In this paper, we write and work with the parameter for simplicity.
The neutrino spin-flavor precession (SFP) mechanism sfp , with or without matter resonance effects in the solar medium, has been used to explain solar neutrino deficit sfpsolar . This scenario is compatible with all solar neutrino data. The terrestrial KamLAND experiment, however, recently confirmed the Large Mixing Angle (LMA) parameter space of the matter oscillation scenario as the solution for the solar neutrino problem kamland , such that SFP can be excluded as the dominant contribution in solar neutrino physics munusolar . Alternatively, the measured solar neutrino -e spectral shape has been used to set limit of at 90% confidence level (CL) for the “effective” magnetic moment vogelbeacom ; skmunu which is different from that of a pure state derived in reactor experiments. Other astrophysical bounds on were mostly derived from the consequences from a change of the neutrino spin-states in the astrophysical mediummunureview ; raffeltbook , typically of the range . However, these bounds are model-dependent and involve implicit assumptions on the neutrino properties.
Direct laboratory experiments munureview on utilize accelerator and reactor neutrinos as sources, and are conducted under controlled conditions. The most sensitive searches are usually performed by experiments studying neutrino-electron scatterings vogelengel :
| (4) |
The experimental observable is the kinetic energy of the recoil electrons (T). A finite will contribute to a differential cross-section term given by:
| (5) |
The signature is an excess of events over those due to Standard Model of electroweak interactions (SM) and other background processes, which exhibit the characteristic 1/T spectral dependence. Limits from negative searches are valid for both Dirac and Majorana neutrinos and for both diagonal and transitional moments.
The neutrino radiative decay rdk for the process
| (6) |
is another manifestation of the neutrino electromagnetic couplings where a change of the neutrino helicity-states takes place. A final-state real photon is produced in the process, unlike the -effects on neutrino-electron scatterings, where only virtual photons are involved. The decay rate and the decay lifetime is related to via rdkmunu
| (7) |
where are the masses for .
III III. Direct Searches with Reactor Neutrinos
Reactor neutrinos provide a sensitive probe for laboratory searches of , taking advantages of the high flux, low and better experimental control via the reactor ON/OFF comparison. The measurable electron recoil energy spectra due to SM and (at =1.0) scatterings with reactor-’s, denoted respectively by and , are displayed in Figure 2. A finite would manifest itself as excess of events in the ON spectra over the background as derived from the OFF data, which have a 1/T energy spectrum.

Neutrino-electron scatterings were first observed in the pioneering experiment reines at Savannah River where plastic scintillators were adopted as target surrounded by NaI(Tl) crystal scintillators as anti-coincidence counters. A revised analysis of the data by Ref vogelengel with improved input parameters gave a positive signature consistent with the interpretation of a finite at =24. An intrinsic error source of this experiment was the use of a proton-rich target. The cross-section for the proton-capture reaction:
| (8) |
is much larger than that for -e scatterings. Other results came from the Kurtchatov kurt and Rovno rovno experiments which quoted limits of and at 90% CL, respectively. A recent experiment MUNU munu at the Bugey reactor adopted a time projection chamber with CF4 gas surrounded by active liquid scintillator as anti-Compton vetos. A limit of at 90% CL was set with 66.6 days of data at a threshold of 700 keV. The lowest-energy bin was at a excess over the SM value.
A global analysis was performed global which combined simultaneously the data from the reactor and solar neutrino experiments, as well as the LMA oscillation parameters constrained by solar neutrino and KamLAND results. Only Majorana neutrinos were considered such that there were only transition moments. A “total” magnetic moment vector = was defined, such that its amplitude was given by =. A global fit produced 90% CL limits of from solar and KamLAND data only, while when reactor data were added. The results indicate the important role of reactor experiments in constraining the magnetic moment effects.
The systematic effects related to the poorly-known neutrino spectra were difficult to control in the 1 MeV range relevant to the previous experiments lenu . The approach of the KS experiment is to achieve a threshold of 10 keV range through a matured and reliable detector technology high-purity germanium (HPGe) detector. Three important advantages can be realized which significantly enhance the sensitivities and robustness of the results: (1) the potential signal rate is much increased due to the 1/T energy dependence of Eq. 5; (2) as shown in Figure 2, the event rates from are 24 times those of at T10 keV and 1, such that the uncertainties in the SM background do not affect the signals; (3) Eq. 5 is mostly independent of at 10-100 keV, such that the signals depends only on the well-known total reactor neutrino flux but not the details of , thereby reducing the systematic uncertainties. In contrast, the poorly-modeled at 1 MeV gives rise to uncertainties in the irreducible background (which is 2.7 times the -signals at ) for experiments operating at this energy range.
We report in this article data taken at KS with HPGe. There are three Reactor ON/OFF data taking periods, the key information of which are summarized in Table 1.
| Period | Data Taking | Reactor ON | Reactor ON | Reactor OFF | Reactor OFF | DAQ | Average |
|---|---|---|---|---|---|---|---|
| Calendar Time | Real Time | Live Time | Real Time | Live Time | Live Time | flux | |
| (days) | (days) | (days) | (days) | (%) | () | ||
| I | July 2001 - April 2002 | 188.2 | 180.1 | 55.1 | 52.7 | 95.7 | 6.29 |
| II | Sept. 2002 - April 2003 | 125.8 | 111.7 | 34.4 | 31.5 | 89.4 | 6.53 |
| III | Sept. 2004 - Oct. 2005 | 303.9 | 278.9 | 48.7 | 43.6 | 91.5 | 6.51 |
| Total | 617.9 | 570.7 | 138.2 | 127.8 | 92.4 | 6.44 |
IV IV. Reactor Neutrino Spectrum
The ’s emitted in power reactors are predominantly produced through -decays of (a) the fission products, following the fission of the four dominant fissile isotopes: 235U, 238U, 239Pu and 241Pu, and (b) 239U, following the neutron capture on the 238U fuel: 238U(n,)239U .
| Channels | Fractional Compositions | Relative Rates | Neutrino Yield | Neutrino Yield |
|---|---|---|---|---|
| by Mass (%) | per Fission | per Event | per Fission | |
| 235U Fission | 1.5 | 0.55 | 6.14 | 3.4 |
| 238U Fission | 98.0 | 0.07 | 7.08 | 0.5 |
| 239Pu Fission | 0.4 | 0.32 | 5.58 | 1.8 |
| 241Pu Fission | 0.1 | 0.06 | 6.42 | 0.4 |
| 238U (n,) 239U | 0.60 | 2.00 | 1.2 | |
| Total | 7.3 |
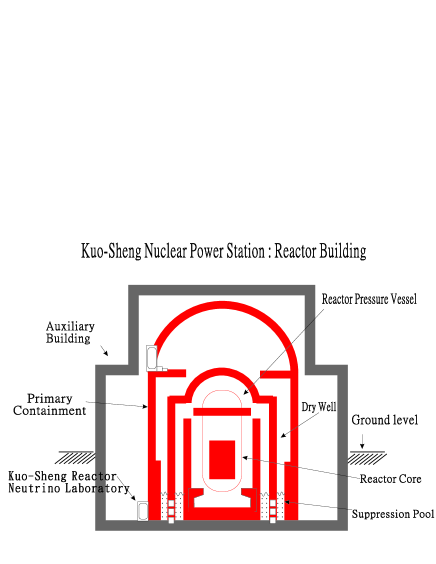
The KS neutrino laboratory, as depicted schematically in Figure 3, is located at a distance of 28 m from Core #1 of the Kuo-Sheng Nuclear Power Station in Taiwan. The nominal thermal power output is 2.9 GW. The standard operation includes about 18 months of Reactor ON time at nominal power followed by about 50 days of Reactor outage OFF period when about a third of the fuel elements are replaced. Reactor operation data on the thermal power output and control rod status as functions of time and locations within the core were provided to the experiment by the Power Station. A set of software programs inersoftware was specifically developed, in association with the commercial SIMULATE-3 and CASMO-3 codes comsoftware , both of which are extensively used in the field of nuclear reactor core analyses. The variations of the thermal power output, as well as the fission rates and -flux of the fissile isotopes during Period-III are displayed in Figures 4a-c. At steady state operation, the total fission rates and the total neutrino fluxes were constant to better than 0.1% and 0.2%, respectively. Data taken during the short durations of unscheduled reactor stops were included into the Reactor-OFF category.
(a)

(b)

(c)

The typical -yield for these channels, as well as their relative contributions per fission are summarized in Table 2. The -yields for the fission elements were adopted from Ref. vogel81 , following a survey of the fission daughter isotopes and the subsequent -decays necessary to reach stability. The 238U neutron capture rate of 0.6 per fission were evaluated by two independent methods: (a) via full neutron transport calculations of the neutrons in the reactor core ncaprussian ; rnue , and (b) by evaluating the difference in the decrease of the amount of 238U and the 238U fission rate. Results derived by both methods were consistent to a few percent.
The ’s of the five channels, as depicted in Figure 5a, were adopted from Ref. vogelengel for the fission ’s, while those following 238U neutron capture were derived from standard -spectra of 239U and 240Np. The components were summed according to the relative contributions per fission, and the resulting total is shown in Figure 5b. This spectrum was used as input in deriving the expected electron recoil spectra in Figure 2. The evaluated -fluxes for the three periods are given in Table 1, where the weighted average is .
(a)

(b)

The modeling of above the threshold of the reaction of Eq. 8 from reactor operation data has been well-established. Accuracies of better than 1.4% and 5% between calculations and measurements were achieved in the integrated bintflux and differential bugey3 spectra. The evaluation of at energy below 2 MeV, on the other hand, is much more complicated lenu . Many input parameters remain unknown and there are no measurements to cross-check. Consequently, the recoil spectra below the MeV range in Figure 2 were subjected to large uncertainties. However, the spectra at 10-100 keV were accurately predicted due to the -independence of Eq. 5. They followed a 1/T profile and depended only on the total -fluxes of Table 1, which were calculated with an expected accuracy of a few percent.
V V. Experimental Set-Up
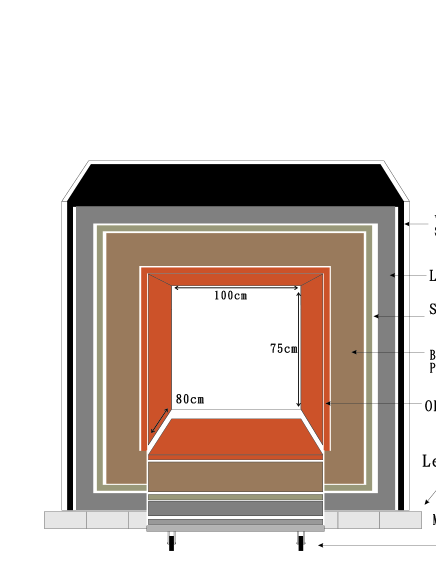
A research program on low energy neutrino physics ksprogram is being pursued by the TEXONO Collaboration at the KS Neutrino Laboratory. The laboratory is equipped with an outer 50-ton shielding structure depicted schematically in Figure 6, consisting of, from outside in, 2.5 cm thick plastic scintillator panels with photo-multiplier tubes (PMTs) readout for cosmic-ray veto (CRV), 15 cm of lead, 5 cm of stainless steel support structures, 25 cm of boron-loaded polyethylene and 5 cm of OFHC copper. The innermost volume with a dimension of 1008075 provides the flexibilities of placing different detectors for different physics topics. During the I-III data taking periods listed in Table 1, both the HPGe and a CsI(Tl) scintillating crystal array kscsi together with their associated inner shieldings were placed in the inner volume. The CsI(Tl) array is for the measurement of neutrino-electron scattering cross-sections. The -search reported in this article was performed with the HPGe detector.
As indicated in Figure 3, the laboratory is located at the ground floor of the reactor building at a depth of 12 m below sea-level and with about 25 m water equivalence of overburden. The primary cosmic-ray hadronic components are eliminated while the muon flux is reduced by a factor of 4. Ambient -background at the reactor site is about 10 times higher in the MeV range than that of a typical laboratory, dominated by activity due to 60Co and 54Mn (half-lives 5.27 years and 312 days, respectively) present as dust in the environment. Both isotopes are produced by neutron activation on the construction materials at the reactor core. The dust can get settled on exposed surfaces within hours and is difficult to remove. Some earlier prototype detectors were contaminated by such. Attempts to clean the surfaces in situ resulted in higher contaminations. Accordingly, the various detector and inner shielding components were carefully washed and wrapped by several layers of plastic sheets before transportation to KS. Outer layers were removed in situ only prior to installation, while inner layers were replaced between data taking periods. Neutron background is comparable to that of a typical surface location, with no observable differences between the ON and OFF periods.
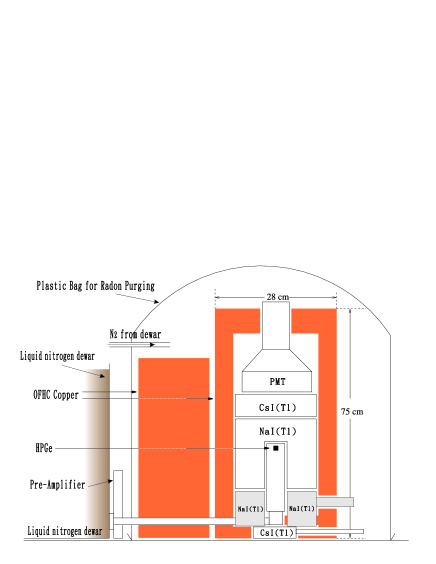
The HPGe set-up is shown schematically in Figure 7. It is a coaxial germanium detector canberra with an active target mass of 1.06 kg. The construction materials and detector geometry followed the “Ultra Low Background (ULB)” standards. The lithium-diffused outer electrode is 0.7 mm thick. The end-cap cryostat, also 0.7 mm thick, is made of OFHC copper. Both of these features provide total suppression to ambient -background below 60 keV, such that events below this energy are either due to internal activity or ambient MeV-range ’s via Compton scattering. Consequently, the background profile should be smooth and continuous below 60 keV down to the ranges where atomic effects are important. The HPGe was surrounded by an anti-Compton veto (ACV) detector system made up of three components: (1) an NaI(Tl) “well-detector” of thickness 5 cm that fit onto the end-cap cryostat and is coupled to a 12 cm PMT readout through an additional 7 cm of CsI(Tl) as active light guide; (2) an NaI(Tl) “ring-detector” of thickness 5 cm at the joint of the cryostat; and (3) a 4 cm thick CsI(Tl) “base-detector” at the bottom. All of these ACV detectors were assembled within mechanical structures made of OFHC copper, and were read out by PMTs with low-activity glass. The assembly was further surrounded by 3.7 cm of OFHC copper inner shielding. Another OFHC copper wall of thickness 10 cm provided additional shieldings on the side of the liquid nitrogen dewar and pre-amplifier electronics. The inner shieldings and detectors were covered by a plastic bag connected to the exhaust line of the dewar, serving as a purge for the radioactive radon gas.
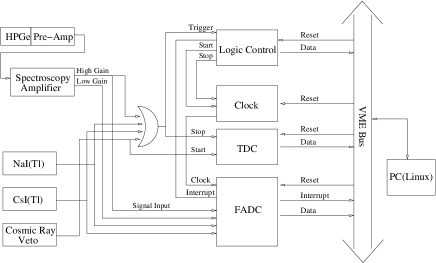
The electronics and data acquisition (DAQ) system eledaq of the HPGe detector assembly is illustrated schematically in Figure 8. The HPGe pre-amplifier signals were distributed to two spectroscopy amplifiers at the same 4 s shaping time but with different gain factors. The amplifier signals were fed to a discriminator with a minimal threshold. The discriminator output provided the on-line triggers, ensuring all the events down to the electronics noise edge of 5 keV were recorded. The amplifier output of the HPGe and the PMT signals from the ACV detectors were recorded by 20 MHz Flash Analog to Digital Convertor (FADC) modules with 8-bit dynamic range for a duration of 10 s and 25 s before and after the trigger, respectively. The discriminator output for the various channels of all three systems (HPGe, ACV, CRV), as well as the timing output of the CRV PMTs, were also recorded. The redundancy of the readout channels enhanced robustness and stability to the detector performance. A random trigger (RT) was generated by an external clock at a sampling rate of 0.1 Hz. The RT events provided accurate measurements of the pedestal levels, the DAQ dead time as well as the various efficiency factors. The data were read out via the VME bus through an VME-PCI interface vme to a PC running on Linux operating system. The data were saved on hard disks. The DAQ system remained active for 2 ms after a trigger to record possible time-correlated signatures. The typical data taking rate for the HPGe sub-system was about 1 Hz. The DAQ dead time was about 4 ms and 2 ms per event for the HPGe and CsI(Tl) triggers, respectively. The system live times are listed in Table 1. They varied among the three periods because of the different trigger rates.
The KS Laboratory is connected with the control center at Academia Sinica (AS) through the telephone lines via MODEM. Internet connections are prohibited due to security reasons. During steady-state data taking, the experiment operated automatically without the necessity of human presence. The operating conditions were constantly monitored via the MODEM. Stability of key parameters like temperatures, liquid nitrogen levels, trigger rates and DAQ live times were checked. The KS Nuclear Power Station can be reached by an hour’s drive from AS. The laboratory was visited typically once a week, when manual checks and calibrations were performed. Hard disks were retrieved and brought back to AS where data were archived and copied. A total of 125 Gbytes of raw data were recorded in the three data taking periods by the HPGe system. The data to be processed were installed on to an external disk array storage system raid with 1.6 Tbytes total storage capacity. Relevant and high-level data on physical quantities were then extracted and distributed among the users, on which data analysis were performed.
VI VI. Data Analysis and Understanding
Scatterings of -e inside the Ge target would manifest as “lone-events” uncorrelated with other detector systems. These events were extracted from the raw data through selection criteria including pulse shape analysis (PSA), anti-Compton (ACV) and cosmic-ray vetos (CRV).
(a)
(b)
(c)
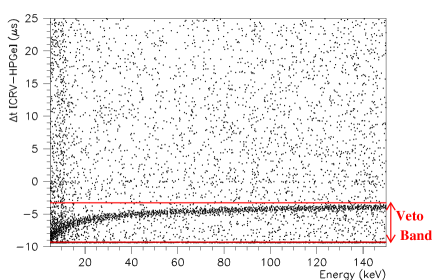
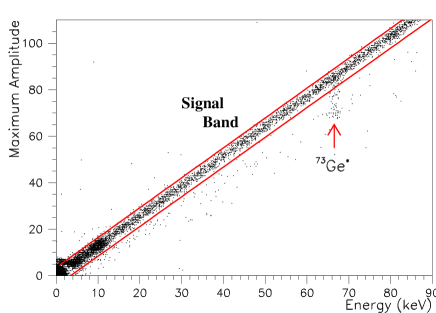
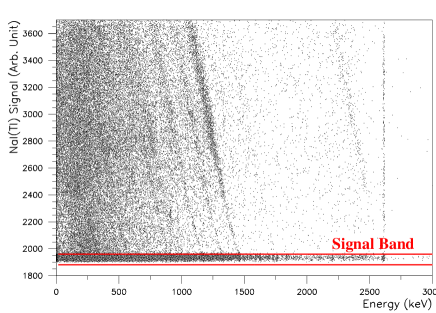
As displayed in the correlation plot between pulse area and amplitude in Figure 9a, spurious background due to accidental and delayed “cascade” events were suppressed by PSA. In particular, the structure at 66 keV was from the decays of 73Ge∗ via the emissions of two photons separated by a half-life of 4.6 s. The ACV and CRV cuts suppressed Compton scattering and cosmic-ray induced events, respectively. The scattered plot of HPGe and NaI(Tl) well-detector events is shown in Figure 9b. A software threshold of about 5 keV was adopted for the ACV detector to define the veto regions. The various slanted bands were due to full energy depositions of -rays in the two detectors, such as those from 40K and the 238U and 232Th series. The vertical band at 2614 keV originated from the coincidence of the -ray cascade following the decays of 208Tl. The timing correlations between CRV and HPGe events are shown in Figure 9c. The PMT pulses from the CRV were fast (10 ns rise time) and therefore arrived before the HPGe signals which were processed through amplifiers with 4 s shaping time. The time difference increased with lower energy because the trigger timing was defined by a constant-threshold discriminator. The selected regions for the lone-events are displayed in the respective plots in Figure 9.
The background suppression factors as well as the signal survival efficiencies for the three data taking periods are summarized in Table 3. The RT events were uncorrelated to the other parts of the detector systems similar to the neutrino-induced events. The survival probabilities of the RT events along the various stages of the analysis procedures provided accurate measurements of the DAQ and analysis efficiencies. The DAQ live time is the ratio between RT events actually recorded on disk to the total numbers of RT signals generated by the clock. The ACV and CRV selection efficiencies are the fractions of the RT events which survived the cuts. Only loose cuts of around the signal band were used in the PSA cut as shown in Figure 9a, such that its efficiency is close to unity.
| Event Selection | Background Suppression | Signal Efficiency | ||||
|---|---|---|---|---|---|---|
| Period | I | II | III | I | II | III |
| Raw Data | 1.0 | 1.0 | 1.0 | 1.0 | 1.0 | 1.0 |
| Pulse Shape Analysis (PSA) | 0.99 | 0.99 | 0.99 | 0.99 | 0.99 | 0.99 |
| Anti-Compton Veto (ACV) | 0.054 | 0.051 | 0.058 | 0.99 | 0.99 | 0.99 |
| Cosmic-Ray Veto (CRV) | 0.92 | 0.85 | 0.80 | 0.95 | 0.94 | 0.93 |
| Combined Efficiency | 0.050 | 0.043 | 0.046 | 0.95 | 0.93 | 0.92 |
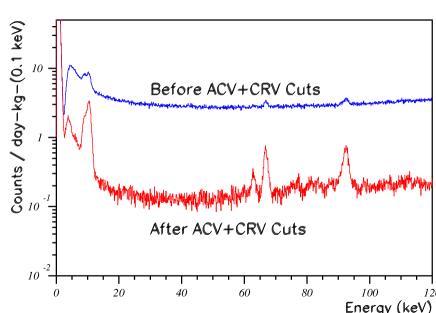
As illustrations, the measured spectra in Period-III before and after the ACV+CRV cuts for the Reactor ON data are depicted in Figure 10. The spectra after the event selection criteria, also for Period-III, are displayed in Figures 11a and 11b for the high and low energy ranges, respectively. The main -lines were identified and tabulated in Table 4. Most of the -activities were due to natural background from the 238U and 232Th series, as well as from 40K and 235U. The existence of activities from 235U is particularly instructive. The low-energy lines implies that the source should be close to the target, most probably inside the OFHC cryostat, where 238U and 232Th should also be present in larger amount. These activities were likely to originate from the front-end pre-amplifier components located in the vicinity of the HPGe target. These were expected to be one of the important background sources.
(a)

(b)
| Energy | Isotopes | Source / | Intensity | |
|---|---|---|---|---|
| (keV) | Decay Series | () | ||
| 66.7 | 73mGe | cosmic | 0.5 s | 15.40.4 |
| 92.6 | 234Th | 238U | 24.1 d | 11.90.5 |
| 143.8 | 235U | 235U | 7.0 y | 5.10.8 |
| 185.7 | 235U | 235U | 7.0 y | } 17.20.4 |
| 186.2 | 226Ra | 238U | 1600 y | |
| 238.6 | 212Pb | 232Th | 10.6 h | 18.80.5 |
| 249.8 | unidentified | 11.60.5 | ||
| 295.2 | 214Pb | 238U | 26.8 m | 6.30.3 |
| 338.3 | 228Ac | 232Th | 6.2 h | 3.70.5 |
| 351.9 | 214Pb | 238U | 26.8 m | 17.10.4 |
| 463.0 | 228Ac | 232Th | 6.2 h | 1.60.3 |
| 583.2 | 208Tl | 232Th | 3.1 m | 14.40.3 |
| 609.3 | 214Bi | 238U | 19.9 m | 8.10.2 |
| 661.7 | 137Cs | CsI(Tl) | 30.1 y | 4.60.2 |
| 727.3 | 212Bi | 232Th | 66.6 m | 6.40.2 |
| 766.4 | 234mPa | 238U | 1.2 m | 5.00.3 |
| 785.4 | 212Bi | 232Th | 66.6 m | } 1.70.4 |
| 786.0 | 214Pb | 238U | 26.8 m | |
| 795.0 | 228Ac | 232Th | 6.2 h | 2.70.8 |
| 834.8 | 54Mn | reactor | 312.3 d | 3.60.3 |
| 860.6 | 208Tl | 232Th | 3.1 m | 3.50.3 |
| 911.2 | 228Ac | 232Th | 6.2 h | 19.10.3 |
| 964.8 | 228Ac | 232Th | 6.2 h | } 14.40.3 |
| 969.0 | 228Ac | 232Th | 6.2 h | |
| 1001.0 | 234mPa | 238U | 1.2 m | 11.40.3 |
| 1120.3 | 214Bi | 238U | 19.9 m | 6.70.5 |
| 1173.2 | 60Co | reactor | 5.3 y | 26.00.3 |
| 1238.1 | 214Bi | 238U | 19.9 m | 1.20.2 |
| 1332.5 | 60Co | reactor | 5.3 y | 27.00.3 |
| 1377.7 | 214Bi | 238U | 19.9 m | 1.90.3 |
| 1460.8 | 40K | natural | 1.3 y | 106.41.0 |
| 1509.2 | 214Bi | 238U | 19.9 m | 0.60.1 |
| 1588.2 | 228Ac | 232Th | 6.2 h | 2.50.1 |
| 1620.5 | 212Bi | 232Th | 66.6 m | 1.60.1 |
| 1630.6 | 228Ac | 232Th | 6.2 h | 0.60.1 |
| 1729.6 | 214Bi | 238U | 19.9 m | 1.10.1 |
| 1764.5 | 214Bi | 238U | 19.9 m | 5.90.9 |
| 1847.4 | 214Bi | 238U | 19.9 m | 0.70.3 |
| 2118.6 | 214Bi | 238U | 19.9 m | 0.20.1 |
| 2204.2 | 214Bi | 238U | 19.9 m | 2.30.4 |
| 2447.9 | 214Bi | 238U | 19.9 m | 0.50.1 |
| 2614.5 | 208Tl | 232Th | 3.1 m | 14.50.2 |
Besides natural radioactivity, there were evidence of 60Co and 54Mn, both being known contaminations within the reactor building. Decay profiles were observed for 54Mn consistent with its nominal decay life-time. The peak at 662 keV was due to 137Cs activity in the CsI(Tl) ACV detector located near the HPGe. There was an unidentified line at 249.8 keV. The intensity was uniform to 4% in both ON and OFF periods but the short-duration rates fluctuated more than the statistical uncertainties would allow. No interpretations consistent with the other spectral features could be found.
The various -lines also provided in situ energy calibration as well as independent measurements and consistency checks to the stability and efficiency factors complementary to the RT events. Details on background and detector stabilities will be presented in Section VII in connection with the discussions on the systematic uncertainties.
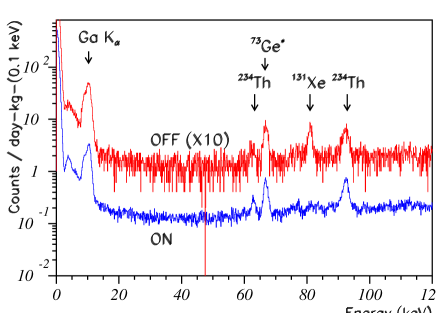
The low energy spectrum of Figure 11b is relevant to the studies of neutrino magnetic moments. A detector threshold of 5 keV and a background of 1 keV-1kg-1day-1 above 12 keV were achieved. The background level is comparable to the typical range in underground Cold Dark Matter experiments. This is a notable achievement for an experiment at shallow-depth and in the vicinity of a power reactor core. Several -lines can be identified: (a) Ga X-rays at 10.37 keV and 73Ge∗ at 66.7 keV from internal cosmic-induced activities, (b) 234Th at 63.3 keV and 92.6 keV from the series due to residual ambient radioactivity close to the target, and (c) a line at 80.9 keV in the OFF spectrum, to be examined in a subsequent paragraph. The copper cryostat as well as the inactive surface electrode of the HPGe provided total suppression to external low energy photons. Consequently, the measured spectra did not exhibit any structures above the the Ga X-rays end point at 12 keV up to about 60 keV.
(a)

(b)

Time variations of two features were observed in the low energy spectrum displayed in Figure 11b. The intensity of the 10.37 keV Ga X-ray peak decayed with time, as illustrated in Figure 12a in the case of data from Period-III. The best-fit half-lives of 27514 days and 9.63.0 days to a double-exponential function agree well with the decays of 68Ge and 71Ge both of which were neutron-activated:
| (9) |
and
| (10) |
The observed exponential decays indicated that there was less neutron activation on the Ge-target inside the shielding structures at KS compared to the AS laboratory where the detector hardware was prepared and tested unshielded prior to installation. Coupled with these processes were the decays of 68Ga (Q=2.9 MeV with 86% branching ratio). They were associated with two 511 keV photons emitted in coincidence, such that the ACV suppression was large.
Another interesting feature is the presence of a line at 80.9 keV observed only once in the beginning of the Period-III data taking, which was a Reactor OFF duration. The time evolution is displayed in Figure 12b. The best-fit half-life of 10.63.3 days is consistent with the interpretation of -emissions following -decays of 133Xe (=5.24 days). This isotope is a fission fragment with large cumulative yield (7%). It exists in gaseous form and has long enough half-life to leave the reactor core. Air pockets contaminated with 133Xe might have been trapped in the vicinity of the detector during installation. Photons at this low energy were fully absorbed absorbed in the HPGe, such the time variations were confined to the peak region.
The comparisons of the key features in the measured spectra from the three periods are given in Table 5. There were no hardware intervention to the shielding structures and the detectors during data taking within one period to ensure stability of the ambient conditions and of the detector operations. In between the data taking periods, there were maintenance, hardware improvement as well as detector installation efforts. The shielding door was opened and the radon purge system was temporarily disconnected. The passive shielding configurations in the inner target volume were re-assembled. All these operations were performed during Reactor ON situations to avoid the possibilities of contaminations in reactor outage. There were no incidents of sudden surge of any background during the ON-to-OFF transitions from both the HPGe detector as well as the CsI(Tl) array in all the three periods.
It can be seen from Table 5 that the 40K activity and the before-cut background level at 30 keV associated with the experimental hardware were maintained stable during the different data taking periods. The HPGe system had a hardware failure at the end of Period-II data taking, which required the detector to be shipped back and forth by air flights to the manufacturer for repairs. Consequently, there was a sharp rise in the cosmic-induced Ga X-ray intensity between Periods II and III. The reduction in the 208Tl background between Periods II and III might be due to the replacement of pre-amplifier electronic components necessary for the repairs. The background due to the 60Co and 54Mn contaminations at the reactor were much suppressed by the shieldings and experimental precautions, such that the detector-associated 40K became the dominant -activity.
| Period | Event Rates () | 30 keV Band () | |||||
|---|---|---|---|---|---|---|---|
| Ga X-Rays | 40K | 208Tl | 60Co | 54Mn | Before-Cut | After-Cut | |
| I | 1346 | 107.20.7 | 29.20.3 | 9.81.0 | 4.20.7 | 31.60.1 | 1.580.02 |
| II | 453 | 106.40.9 | 25.60.4 | 14.51.7 | 3.10.4 | 31.20.1 | 1.340.02 |
| III | 1287 | 106.41.0 | 14.50.2 | 26.50.2 | 3.60.3 | 30.90.1 | 1.420.01 |
| RMS/Mean | 0.40 | 4e-3 | 0.27 | 0.42 | 0.12 | 9e-3 | 0.07 |
VII VII. Neutrino Magnetic Moments and Radiative Decay Searches
Only the low energy spectra like the one shown in Figure 11b were used in the studies of . Since data taking conditions were not identical among the three periods, the data were analyzed and Reactor ON/OFF spectra were compared independently within each period. Consequently, the variations in the key background features shown in Table 5 do not affect the evaluations of . The analysis procedures were extended from those used previously prl03 through a global treatment which incorporated additional constraints and measurements.
The PSA cut identified events with spurious and convoluted pulse shapes, some of which were due to electronic noise. These were not stable with time in general. The ACV and CRV cuts, however, rejected background due to physical processes such that the suppression factors should be stable during data taking provided that the hardware were properly controlled and cross-monitored. We denote the spectra surviving the PSA cut by and for the Reactor OFF and ON data, respectively, while those after further ACV+CRV cuts similarly by and . The before and after-cut Reactor ON spectra and in Period-III are displayed in Figure 10. The neutrino-induced contributions to the electron recoil spectra can be described by
| (11) |
The dependence on the -signals follows from Eq. 5.
There are two constraints relating the four measured spectra within one period
-
(I) the excesses of over , if any, are neutrino-induced:
(12) where is the selection efficiency of the ACV+CRV cuts as given in Table 3, and
-
(II) the suppression factors for the ACV+CRV cuts should be constant between the Reactor-ON and OFF data taking:
(13)
Global minimum- analyses were performed to the data from the three periods independently. Though the DAQ threshold was 5 keV, the analysis threshold of 12 keV was chosen to avoid complications of the atomic effects atomic as well as the time-varying background from Ga X-rays. The background profile was continuous and stable from this energy threshold up to 61 keV as expected, and could be described by a fit of a polynomial function to . The best-fit values of as well as the /dof for the three periods are listed in Table 6. It can be seen that Eqs. 12 and 13 provide excellent descriptions to the data.
| Period | Best-Fit | |
|---|---|---|
| /dof | ||
| I | -0.521.05 | 90/97 |
| II | 0.061.21 | 108/97 |
| III | -0.840.87 | 84/97 |
| Combined | -0.530.59 | |
The data taking durations of the three periods lasted from eight to twelve months. Demonstrations of the background and detector stabilities are therefore crucial. Since each period was treated independently with its own Reactor ON and OFF data compared, the variations among the different periods shown in Table 5 did not lead to systematic effects on the analysis. Nevertheless, the stability (an RMS spread of 0.9%) of the before-cut levels at 30 keV among the different periods suggested that the overall background was in good control throughout the experiment.
Two complementary studies were performed on the systematic effects of the experiment, and they are discussed in details in the following paragraphs.
| Monitors | R± | /dof | |
|---|---|---|---|
| 40K 1462 keV Band | -0.42 | 3.5e-3 | 55/53 |
| 208Tl 2614 keV Band | 0.18 | 1.3e-2 | 50/53 |
| Band at 30 keV | 0.005 | 8.2e-3 | 55/53 |
| Band at 400 keV | 1.3 | 4.1e-3 | 79/73 |
| Suppression factor | |||
| (ACV & CRV) at 30 keV | -0.21 | 9.6e-3 | 72/73 |
(1) Stability Measurements:
Several important spectral features were continuously measured to monitor and demonstrate the stabilities of the detector performance and background conditions. These stabilities are summarized in Table 7 for the 350 days of Period-III data. The monitored features included the (ACV+CRV) suppression factors, as well as the event rates of the 40K and 208Tl bands, together with the two sampling bands at 30 keV and 400 keV.
To quantify the stabilities, the time-evolution over the entire period was fit to a constant. The stability parameter corresponds to the ratio of error/mean of the fits. The excellent values on /dof indicate that the stability hypothesis is valid and that the fluctuations of individual data points were statistical in nature. Accordingly, can be taken as the stability levels of the various features being monitored. The parameter R± denotes the ratio of residuals of Reactor ONOFF data to their respective 1 statistical accuracies. The measured results of indicate that the experimental conditions were stable between the Reactor ON/OFF data set, such that their differences were consistent with statistical fluctuations, rather than due to systematic variations in hardware or background.
(a) Event Rate Changes
Channels
ON/OFF Stability ()
DAQ live time
5e-4
HPGe target mass
1e-4
(b) Background Variations
Background
ON/OFF Stability Levels
Source
(bkg)
(MC)
Radon diffusion
0.05
5e-4
54Mn
0.3
2e-3
2e-3
60Co
0.06
2e-3
4e-3
68Ga
0.4
3e-8
1e-6
133Xe (only Period-III)
1
4e-4
3e-3
Line at 249 keV
0.04
1e-3
3e-4
(c) Detector Performance and Data Analysis
Detector Systems
ON/OFF Stability Levels
& Cuts
(Detector)
(Veto)
Both CRV & ACV
0.64
5e-3
1e-6
1e-5
ACV only
0.30
0.05
7e-4
4e-3
CRV only
0.01
0.1
0.01
2e-3
Surviving CRV+ACV
0.05
0.15
5e-4
(d) Combined Limit
Combined (a)+(b)+(c)
7e-3
(2) Bounds on Possible Instabilities:
The various channels which may contribute to possible instabilities to the ON/OFF data at the low energy signal region were identified and their effects were derived from actual data and complete detector simulations. The results are summarized in Table 8a-c. Their effects to the ON/OFF comparisons at 30 keV, relative to the overall after-cut background , are denoted by .
The bounds on the ON/OFF stabilities due to event rate variations are shown in Table 8a. The DAQ live times were accurately measured to 5e-4 through the ratios of generated to recorded RT events. Within each period, the HPGe detector was continuously maintained at liquid nitrogen temperature to minimize the diffusion of the inactive layer which is about 1% of the active detector mass. A change of thickness of 1% implies a stability level of 1e-4.
The various background sources which may produce ON/OFF instabilities are listed in Table 8b, where their fractional variations are denoted by (bkg). The evaporation rate of the liquid nitrogen in the HPGe dewar was measured to be stable to 1%. There were no observable changes [(bkg)5%] in the key spectral features in a test data set taken when this radon purge system was disconnected. Therefore, residual variations on the background due to fluctuations in radon diffusion are expected to be at the level of 5e-4.
There were five specific lines (54Mn, 60Co, 68Ga, 133Xe only for Period-III, and the 249 keV line) where variations with time were observed or should be examined. Their effects on the signal region were derived from full simulation studies using the measured peak intensities (peak) in Table 4 and (bkg) between the ON/OFF periods as input and normalizations. The ON/OFF stabilities at the signal region are the entries in Table 8b, derived from:
| (14) |
where is the simulated background level at the low-energy signal region with keV-1 bin-width, normalized to one observed event at the peak. From physical expectations, the background sources were taken to be uniformly distributed among the space in the vicinity of the HPGe detector, and their emissions were isotropic. The HPGe target was hermetically surrounded by the ACV and the detector response was mostly uniform in all directions. Consequently, the effects due to the exact source locations were small and the background levels only varied by 10% (RMS) if localized point sources were used instead.
The tight limits can be understood qualitatively as follows. The weak intensity of the 54Mn line and the long decay lifetime of the 60Co lines suppressed the ON/OFF variations to 2e-3 and 4e-3, respectively. The decays of 68Ga are mostly via the emissions of , such that the ACR was efficient as vetos in catching the two 511 keV photons. The 80.9 keV 133Xe line appeared only in Period-III OFF period. At this low energy, the photo-electric cross-section is large compared to the Compton effects. The residual Compton-scattered photons were of lower energies and had large absorption by the copper cryostat as well as by the inactive layer of the HPGe. Accordingly, the effects of this line were confined to the peak region. The correlated background at the low energy signal regions were suppressed to the level of 3e-3. The short-time-scale fluctuations of the unidentified line at 249.8 keV were washed out to better than 4% when the extended ON/OFF periods were integrated, giving 3e-4.
The stabilities of the ACV and CRV detector systems, denoted by (Detector), as well as their effects on the veto efficiencies [(Veto)] and are summarized in Table 8c. From Table 5, the raw background rates before the ACV+CRV cuts were about at 30 keV while the after-cut background levels were , such that the combined suppression factors were about 5%, as shown in Table 3. The fractions of the raw background suppressed by each category of selection cuts are denoted by . The ON/OFF variations at low-energy are therefore given by:
| (15) |
About 64% of the raw background were vetoed by BOTH ACV and CRV. These were cosmic-ray events which penetrated the active ACV and emitted bremsstrahlung photons which interacted with the HPGe via Compton scatterings. Besides having the redundancy of signals in two detector systems, the energy depositions of these events were of the order of tens of MeV at the ACV detectors, where the threshold was about 5 keV. Consequently, the rejection efficiencies were 100% and small variations in the ACV gains or thresholds had negligible effects on the stabilities. About 30% of the raw background were tagged ONLY by the ACV detectors. These events were due to ambient radioactivity and typically deposited 100 keV to 1 MeV energy at the ACV. Studies were performed with both simulated and real data on the effects of the changes in software threshold. They indicated that an instability in the ACV detector gain of (Detector)5% would lead only to a variation in the rejection efficiencies of (Veto)7e-4, which translated to 4e-3. Similarly, only about 1% of the raw background produced CRV tag alone. These were high-energy bremsstrahlung events induced by cosmic-ray interactions with the passive shielding materials, where the photons penetrated the ACV system. Since the PMTs of the CRV system were optimized at the stable plateau region, a 10% change in the PMT gain did not give rise to observable change in tagging efficiencies (that is, (Veto)1%), so that 2e-3. Finally, about 5% of the raw background survived both ACV+CRV cuts. The time variations of their survival probabilities were accurately measured to 5e-4 by studying the response to the same software procedures with the RT events.
| Sources | (Source) | |
|---|---|---|
| ON/OFF instabilities [(combined)] | 1% | 0.18 |
| Efficiencies for neutrino events | 5e-4 | 5e-4 |
| Rates for | 3% | 0.03 |
| background subtraction | 23% | 0.03 |
| Combined Systematic Error | 0.18 |
Taking into account the measured stability levels in Table 7 at the 30 keV signal region (9e-3), as well as the combined upper bounds on the possible Reactor ON/OFF variations (7e-3) in Table 8(d), an uncertainty of was adopted to quantify the possible Reactor ON/OFF systematic instabilities at the low energy signal region. The influence of this and other sources of systematic effects are summarized in Table 9, where the stabilities of the sources are given by (Source) while their effects on the magnetic moment searches are represented by . The stabilities of the efficiencies of possible neutrino-induced signals in Table 3 were accurately measured to (Source)5e-4 through the survival probabilities of the RT events over the various selection criteria. The rates at 10-100 keV depend mostly on the total flux which is well-modeled to 2% at steady-state operation bintflux , as discussed in details in Section IV. Residual uncertainties arise from the finite rise and fall time of the neutrino flux lenu relative to the sharp Reactor ON/OFF instants, introduced through several long-lived isotopes (like 93Y, 97Zr, 132Te) where the total fission yield is about 15%. About 10% of the data taking time may be subjected to this effect, such that a combined uncertainty of (Source)3% was derived for the evaluation . A conservative estimate of 30% systematic uncertainties for the spectrum below 2 MeV translates to 23% uncertainties in the background rates below 100 keV. However, this only have little impact to the accuracies in since the effect being studied in is an order of magnitude larger than at 10 keV.
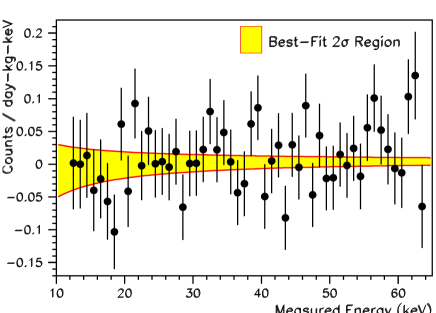
Combining statistically the best-fit values on for the three periods and adopting the systematic uncertainties derived in Table 9, the results
| (16) |
were obtained. Adopting the unified approach pdg04 , a direct limit on the magnetic moment
| (17) |
at 90% CL was derived. The combined residual spectrum for the three periods of the Reactor ON data over the background profiles is depicted in Figure 13. The best-fit 2 region for is superimposed. It has been verified that the correct positive signals could be reconstructed by the same analysis procedures operating on simulated spectra with -induced events convoluted with similar background profiles. The results are also not sensitive to alternative choices of (combined) in Table 9 given the constraints of the values in Tables 7&8.
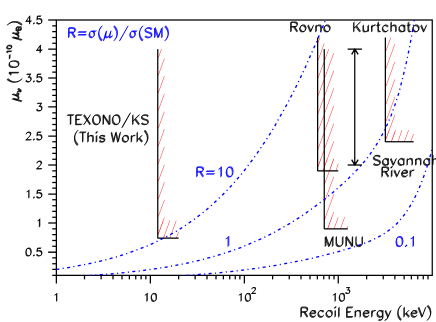
Depicted in Figure 14 is the summary of the results in searches versus the achieved threshold in reactor experiments. The dotted lines denote the ratios between -induced and SM cross-sections [] as functions of . The KS(Ge) experiment has a much lower threshold of 12 keV compared to the other measurements. The large R-values imply that the KS results are robust against the uncertainties in the SM cross-sections. In particular, in the case where the excess events reported in Ref. vogelengel are due to unaccounted sources of neutrinos, the limits remain valid.
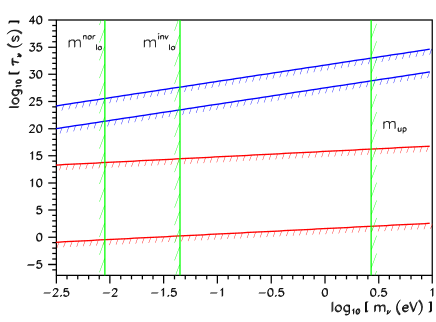
Results from oscillation experiments pdg04 ; nu04 indicate that is predominantly a linear combination of mass eigenstates and with mixing angle given by . The mass differences between the mass eigenstates are and . Both “normal” (: ) and “inverted” (: ) mass hierarchies are allowed. The and radiative decays are allowed only in the inverted mass hierarchy, while is possible in both hierarchies. Adopting these as input, the limit of Eq. 17 can be translated via Eq. 7 to indirect bounds of
| (18) | |||||
| (19) | |||||
| (20) |
at 90% CL. These limits are sensitive to the bare neutrino-photon couplings and are therefore valid for neutrino radiative decays in vacuum. They are summarized in Figure 15. Superimposed are the limits from the previous direct searches of excess ’s from reactor rdkreactor and supernova SN1987a rdksupernova neutrinos. It can be seen that bounds inferred from -e scatterings are much more stringent than those of the direct approaches.
VIII VIII. Conclusion and Prospects
This article describes a study of possible neutrino-photon couplings using neutrinos from nuclear power reactor as source. A germanium detector of target mass 1.06 kg was adopted as target where data taking and analysis thresholds of 5 keV and 12 keV, respectively, were achieved. Sensitive limits were derived on neutrino magnetic moments and neutrino radiative decay lifetimes. Good background level comparable to those of the underground dark matter experiments was achieved at the 10 keV range. This is the first experiment operating with such low threshold in a high neutrino flux. The unique data collected with the HPGe detector at KS open the possibilities of studying other phenomena like the intrinsic properties of reactor electron neutrinos rnue , possible neutrino-induced nuclear transitions, and searches for reactor axions, all of which are being pursued.
The sensitivities for direct searches of neutrino magnetic moments munureview with neutrino-electron scatterings experiments scale as
| (21) |
where is the signal events at some reference magnetic moments, are the background level, detector mass and measurement time, respectively. The best strategy to enhance the sensitivities is to have an increase on , which is proportional to the neutrino flux and is related to the detection threshold. The atomic energy level effects atomic , however, limit the potential sensitivity improvement as the threshold is reduced below the typical atomic scale of 1 keV. There is an on-going experiment GEMMA gemma and a proposal MAMONT mamont pursuing along these directions.
However, this approach cannot improve on the sensitivities indefinitely. Inferring from Figure 2 for reactor neutrinos, is only of at 1 keV as . Accordingly, it would be experimentally difficult to study by looking for anomalous effects in neutrino-electron scatterings over SM behaviour for . This limitation can be evaded, at least conceptually, by doing the analog of “appearance” experiments in the case of Majorana neutrinos. One can look for signatures of anti-neutrinos of a different flavor in a pure and intense neutrino beam which passes through a dense medium or an strong magnetic field. Though there is no fundamental constraint on the lowest reach of the detectable / ratio, realistic accelerator-based experiments are still many orders of magnitude less sensitive than the neutrino-electron scattering experiments with reactor neutrinos simcon .
The TEXONO Collaboration meanwhile is pursuing an R&D program on the “ultra-low-energy” germanium detector. A threshold of 100 eV has been achieved with a 10 g prototype cohsca . The goals are to develop a 1 kg detector to perform the first experimental observation of neutrino-nucleus coherent scattering using reactor neutrinos. The by-products of such an experiment will be dark matter searches at the low WIMP mass regions, as well as the probing of down to the range.
IX IX. Acknowledgments
The experiment reported in this article is the first particle physics experiment performed in Taiwan, as well as the first large-scale scientific collaboration among research scientists from Taiwan and China science03 . The authors are indebted to the many colleagues who have helped to “make this happen”. The invaluable contributions by the technical staff of our institutes and of the Kuo-Sheng Nuclear Power Station are gratefully acknowledged. The veto scintillator loan from the CYGNUS Collaboration is warmly appreciated. We are also grateful to the referees for comments on the treatment of systematic uncertainties. This work was supported by fundings provided by the National Science Council and the Academia Sinica, Taiwan, as well as by the National Science Foundation, China.
References
- (1) See the respective sections in Review of Particle Physics, Particle Data Group, J. Phys. G 33 (2006), for details and references.
- (2) See the respective articles in Proc. of the XXIst Int. Conf. on Neutrino Phys. & Astrophys., Paris, France, eds. J. Dumarchez, Th. Patzak, and F. Vannucci, Nucl. Phys. B (Proc. Suppl.) 143 (2005), for details and references.
- (3) A. de Gouvea, Nucl. Phys. B (Proc. Suppl.) 143, 167 (2005).
- (4) H.B. Li et al., Phys. Rev. Lett. 90, 131802 (2003).
- (5) H.T. Wong, Nucl. Phys. B (Procs. Suppl.) 143, 205 (2005); H.T. Wong and H.B. Li, Mod. Phys. Lett. A 20, 1103 (2005).
- (6) B. Kayser, Phys. Rev. D 26, 1662 (1982); J.F. Nieves, Phys. Rev. D 26, 3152 (1982).
- (7) N.F. Bell et al., Phys. Rev. Lett. 95, 151802 (2005); N.F. Bell et al., Phys. Lett. B 642, 377 (2006).
- (8) B.W. Lee and R.E. Shrock, Phys. Rev. D 16, 1444 (1977); W. Marciano and A.I. Sanda, Phys. Lett. B 67, 303 (1977); K. Fujikawa and R. Shrock, Phys. Rev. Lett. 45, 963 (1980).
- (9) R. Shrock, Phys. Rev. D 9, 743 (1974); J. Kim, Phys. Rev. D 14, 3000 (1976); M.A.B. Beg, W.J. Marciano, and M. Ruderman, Phys. Rev. D 17, 1395 (1977); M. Fukugita and T. Yanagida, Phys. Rev. Lett. 58, 1807 (1987); S.M. Barr, E.M. Freire, and A. Zee, Phys. Rev. Lett. 65, 2626 (1990).
- (10) R.N. Mohapatra, S.P. Ng, and H.B. Yu, Phys. Rev. D 70, 057301 (2004).
- (11) J.F. Beacom and P. Vogel, Phys. Rev. Lett. 83, 5222 (1999).
- (12) J. Schechter and J.W.F. Valle, Phys. Rev. D 24, 1883 (1981).
- (13) M.B. Voloshin, M.I. Vysotskii, and L.B. Okun, Sov. Phys. JETP 64, 446 (1986); J. Barranco et al., Phys. Rev. D 66, 093009 (2002).
- (14) K. Eguchi et al., Phys. Rev. Lett. 90, 021802 (2003); T. Araki et al., Phys. Rev. Lett. 94, 081801 (2005).
- (15) A.B. Balantekin and C. Volpe, Phys. Rev. D 72, 033008 (2005).
- (16) D.W. Liu et al., Phys. Rev. Lett. 93, 021802 (2004).
- (17) G.G. Raffelt, “Stars as Laboratories for Fundamental Physics”, Sect. 7.5, U. Chicago Press (1996).
- (18) P.Vogel and J.Engel, Phys. Rev. D 39, 3378 (1989).
- (19) P.P. Pal and L. Wolfenstein, Phys. Rev. D 25, 766 (1982).
- (20) G.G. Raffelt, Phys. Rev. D 39, 2066 (1989).
- (21) F. Reines, H.S. Gurr, and H.W. Sobel, Phys. Rev. Lett. 37, 315 (1976).
- (22) G.S. Vidyakin et al., JETP Lett. 55, 206 (1992).
- (23) A.I. Derbin et al., JETP Lett. 57, 769 (1993).
- (24) C. Amsler et al., Nucl. Instrum. Methods A 396, 115 (1997); Z. Daraktchieva et al., Phys. Lett. B 615, 153 (2005).
- (25) W. Grimus et al., Nucl. Phys. B 648, 376 (2003); M.A. Tortola, hep-ph/0401135 (2004).
- (26) H.B. Li and H.T. Wong, J. Phys. G 28, 1453 (2002).
- (27) FISCOF Ver 1.0, W.S. Tong, 08-4-MAN-036-001-1.1, Institute of Nuclear Energy Research (2001); FISSRATE Ver 2.0, W.S. Kuo, 08-4-MAN-036-002-1.0, Institute of Nuclear Energy Research (2001).
- (28) CASMO-3 Ver 4.84, Malte Edenius et al., STUDSVIK/SOA-94/9, Studsvik Scandpower (1994); SIMULATE-3 Ver 6.07.08, Lorne Covington et al., STUDSVIK/SOA-95/15 Rev. 2, Studsvik Scandpower (2001).
- (29) P. Vogel et al., Phys. Rev. C 24, 1543 (1981).
- (30) V.I. Kopeikin, L.A. Mikaelyan, and V.V. Sinev, Phys. Atom. Nucl. 60, 172 (1997).
- (31) B. Xin et al., Phys. Rev. D 72, 012006 (2005).
- (32) Y. Declais et al., Phys. Lett. B 338, 383 (1994).
- (33) B. Achkar et al., Phys. Lett. B 374, 243 (1996).
- (34) H.T. Wong, Mod. Phys. Lett. A 19, 1207 (2004).
- (35) H.B. Li et al., Nucl. Instrum. Methods A 459, 93 (2001).
- (36) W.P. Lai et al., Nucl. Instrum. Methods A 465, 550 (2001).
- (37) ULB-HPGe Model GC5019, Canberra Industries, USA.
- (38) VME-PCI Adaptor, Model 618, SBS Technologies, USA.
- (39) Redundant Array of Independent Disks (RAID), Ultra Trak SX8000, Promise Technology, USA.
- (40) V.I. Kopeikin et al., Phys. Atom. Nucl. 60, 2032 (1997).
- (41) L. Oberauer, F. von Feilitzsch, and R.L. Mössbauer, Phys. Lett. B 198, 113 (1987); J. Bouchez et al., Phys. Lett. B 207, 217 (1988).
- (42) E.L. Chupp, W.T. Vestrand, and C. Reppin, Phys. Rev. Lett. 62, 505 (1989).
- (43) A.G. Beda et al., Phys. Atom. Nucl. 67, 1948 (2004).
- (44) L.N. Bogdanova, Nucl. Phys. A 721, 499 (2003)
- (45) M.C. Gonzalez-Garcia, F. Vannucci, and J. Castromonte, Phys. Lett. B 373, 153 (1996); J.-M. Frère, R.B. Nevzorov, and M.I. Vysotsky, Phys. Lett. B 394, 127 (1977).
- (46) H.T. Wong, J. Phys. Conf. Ser. 39, 266 (2006).
- (47) D. Normile, Science 300, 1074 (2003).