Measurement of the DANE luminosity with the KLOE detector using large angle Bhabha scattering
Abstract
We describe the method of measuring the integrated luminosity of the collider DANE, the Frascati factory. The measurement is done with the KLOE detector selecting large angle Bhabha scattering events and normalizing them to the effective cross section. The cross section is calculated using different event generators which account for the radiative initial and final state corrections, and the resonance contribution. The accuracy of the measurement is 0.6%, where 0.3% comes from systematic errors related to the event counting and 0.5% from theoretical evaluations of the cross section.
pacs:
PACS-keydiscribing text of that key and PACS-keydiscribing text of that key1 Introduction
For an accurate measurement of the cross section of an annihilation process, the precise knowledge of the collider luminosity is required. The luminosity depends on three factors: beam-beam crossing frequency, beam currents and the beam overlap area in the crossing region. However, the last quantity is difficult to determine accurately from the collider optics. Thus, experiments prefer to determine the luminosity by the counting rate of well selected events whose cross section is known with good precision. Since the advent of low luminosity colliders, a great effort was devoted to obtaining good precision in the cross section of electromagnetic processes, extending the pioneer work of the earlier days TheBible . At the colliders, working in the range , such as ACO at Orsay, VEPP-II at Novosibirsk, and Adone at Frascati, the luminosity measurement was based on small angle Bhabha scattering, or single and double bremsstrahlung SABS ; BREMS , thanks to the high statistics. The electromagnetic cross sections scale as 1/s, while elastic scattering has a steep dependence on the polar angle, , thus providing high rate for small values of . At low and intermediate energy high-luminosity meson factories, the small polar angle region is difficult to access for the presence of the low-beta insertions close to the beam crossing region, while wide angle Bhabha scattering produce a large counting rate and can be exploited for a precise measurement of the luminosity.
We have measured the luminosity counting the number of large angle Bhabha scattering events and normalizing this number to the effective Bhabha cross section :
| (1) |
The effective cross section is evaluated by inserting into the detector simulation different event generators which include radiative corrections at a high level of precision. In eq.(1) the number of background events, , is determined and subtracted from the observed events, .
The main advantages of this method are:
-
i)
high theoretical accuracy by which the cross section could be calculated;
-
ii)
clean event topology of the signal and small amount of background;
-
iii)
large statistics: for nbarn in , even at the lowest luminosities obtained in the data taking period, the statistical error is reached in about two hours of data taking.
In the following we describe the luminosity measurement using large angle Bhabha scattering. The on-line measurement, with 5% accuracy, was used to provide a fast feedback to DANE. The off-line analysis which is described in this paper reaches a precision of 0.6%, dominated by the uncertainty quoted at present, in the calculation of the Bhabha cross section. A high precision on is particularly useful in the KLOE measurement of the hadronic cross section kloeppg .
| number of bunches (, ) | 49, 49 |
|---|---|
| current per beam (A) | 0.7, 1.0 |
| beam crossing period (ns) | 5.43 |
| beam width at crossing: | |
| (mm) (horizontal) | 2 mm |
| (mm) (vertical) | 20 m |
| (mm) | 3 cm |
| average luminosity | 3 cm-2 s-1 |
| luminosity lifetime (min) | 30 |
2 The DANE collider
The DANE collider Guiducci:DAPHNE is designed to run at high luminosity in the energy region corresponding to the resonance . It consists of two independent electron and positron rings of 98 m length with beams that cross at two interaction regions with angle of 25 mrad. DANE was commissioned in 1999 and since 2000 was working with increasing luminosity for three experiments: KLOE, DEAR and FINUDA.
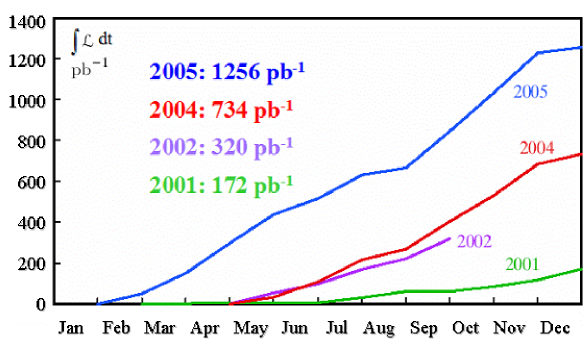
At the end of 2005 KLOE has collected an integrated luminosity of 2.5 fb-1, as shown in Fig. 1. The measurement presented here only refers to the data taken during 2001, although KLOE will use the same luminosity method for the remaining data set.
DANE works in the ”topping up” mode, injecting beams with a frequency of about three fillings per hour while the KLOE experiment is continuously taking data. The main beam parameters are presented in Table 1.
In the KLOE interaction region (IR) electron-positron beams cross with a small transverse momentum in the horizontal plane 13 MeV/c. The longitudinal and horizontal width of the beam-beam collision region is mm and mm respectively. All these quantities are measured run-by-run with very good accuracy ( keV, mm, mm) detecting large angle Bhabha events as it will be explained in the following. The beam energy spread is MeV, as determined from decays.
3 The KLOE detector
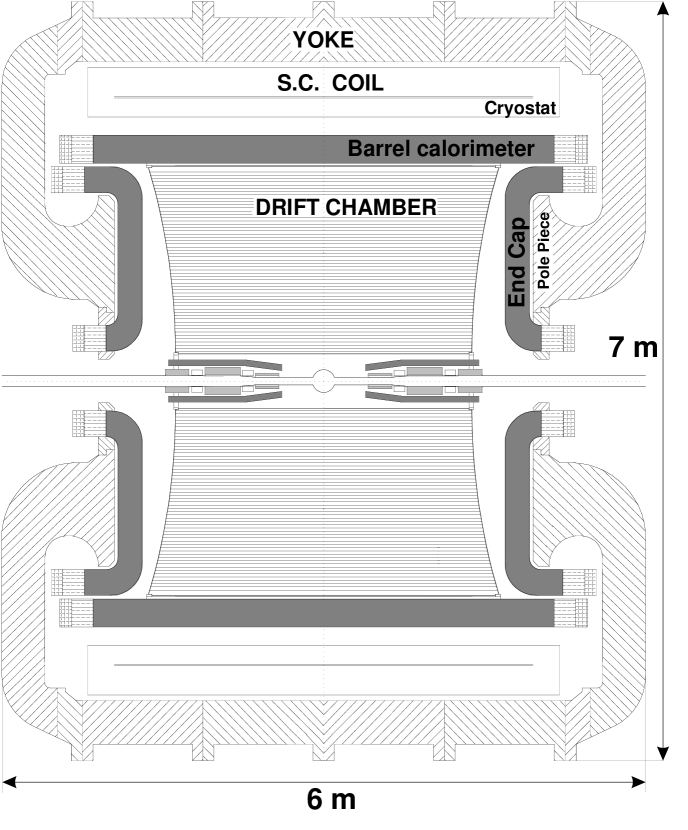
A cross view of the detector is shown in Figure 2. It consists of a large volume drift chamber (DC), a fine grained lead-scintillating fiber sampling calorimeter (EMC) both immersed in a uniform magnetic field of 0.52 T parallel to the beam bisectrix, which is taken as the axis of our coordinate system. The beam pipe around the IR has a spherical shape of 10 cm radius. Three low-beta quadrupoles on either side, at a distance of 50 cm from the IR, fill the space between the beam pipe and the DC inner wall. Two small lead-scintillating tile calorimeters are wrapped around the quadrupoles to complete the EMC hermeticity.
The drift chamber Adinolfi:2002DC , 4 m in diameter and 3.3 m long, is made of 58 concentric rings of drift cells arranged in a full-stereo geometry and is filled with a low Z gas mixture (90%He10%-C4H10). Particle trajectories are measured with a space resolution of 0.15 mm and 2 mm; the transverse momentum resolution for long tracks is 0.3% and the primary vertex is reconstructed with a space resolution 2 mm. Electrons emitted at large angle have a track length greater than 1.5 m and are measured with more than 50 points.
The calorimeter Adinolfi:2002EMC is divided in a barrel () and two end-caps. It is segmented in depth in five layers, the first four of each, and the fifth of . The barrel is divided in 24 sectors, each sector having 512 calorimeter cells of 44 cm2 read out by photomultipliers at both ends to measure the arrival time of particles and to reconstruct the space coordinates. Calorimeter clusters are reconstructed grouping together energy deposits close in space and time. For each cluster, is the sum of the cell energies, the time and position are calculated as energy-weighted averages. The energy, time and position resolutions are , = 54 ps/ ps, cm, and 1 cm.
The trigger Ambrosino:2004TRIG is based on the information from the calorimeter and the drift chamber. The EMC trigger requires two distinct energy deposits above threshold (E 50 MeV in the barrel and E 150 MeV in the end-caps). The DC trigger is based on the number of drift cells that recorded a hit and on their topology. Recognition and rejection of cosmic ray events is also done at trigger level: events with two energy deposits above 30 MeV in the fifth calorimeter layer are vetoed. The trigger is synchronized with the DANE RF divided by 4, = 10.86 ns, with an accuracy of 50 ps. The time of the bunch crossing producing an event is determined after event reconstruction.
4 The selection of Bhabha scattering events
An on-line filter selects Large Angle Bhabha (LAB) events using only calorimeter information, to minimize the CPU time necessary for the whole event reconstruction; while a more refined off-line analysis is done selecting Very Large Angle Bhabha (VLAB) events, tightening the acceptance cuts and including also the tracking information.
The LAB selection is based on the following requirements:
-
1)
at least two calorimeter clusters with energy ;
-
2)
the two clusters with the minimum polar angle acollinearity are chosen and ;
-
3)
the time cut , for the two clusters;
-
4)
both clusters with ;
-
5)
, where , being the cluster position (this cut is introduced to reject events, which have a back-to-back topology);
-
6)
the presence of at least DC hits in the event.
The precision with which LAB events are selected is about 1% and is limited by the energy resolution of the calorimeter ( 40 MeV for = 510 MeV). By adding information from the tracking chamber, the precision is considerably improved and the background of and events ( contamination at this level) is further reduced.
In the VLAB selection the tracking information gives the momentum measurement and the charge assignment, while the information on polar angles is still taken from the EMC clusters. There is no need to use the tracks for the angular information since calorimeter clusters and tracks have similar angular resolutions () and hence no further systematic uncertainty is introduced. The selection cuts of VLAB events are slightly tighter than in the LAB selection; the event must satisfy the following requirements:
-
1)
for the two tracks with the largest number of associated hits, the point-of-closest-approach to the origin (PCA) must be within cm and cm;
-
2)
the two tracks must have opposite curvature;
-
3)
both tracks must have momentum 400 MeV;
-
4)
the two EMC clusters selected by the LAB filter must have polar angle ;
-
5)
the cut on the polar angle acollinearity for the two LAB clusters is further tightened to .
5 Evaluation of efficiencies
The effective VLAB cross section is obtained from Monte Carlo, it is therefore important to check that the resolution of the variables and the efficiency of the selection are well reproduced by the detector simulation, and to correct for any mismatch between data and Monte Carlo. In particular a difference in the resolution of the kinematic variables can give rise to systematic effects at the borders of the chosen phase space. The studies presented here refer to the data sample collected in 2001 because these data have been used for the measurement of the pion form factor kloeppg . Since 2002 the cosmic ray veto has been improved and a smaller systematic error from this effect should be accounted for in later data.
5.1 Angular acceptance
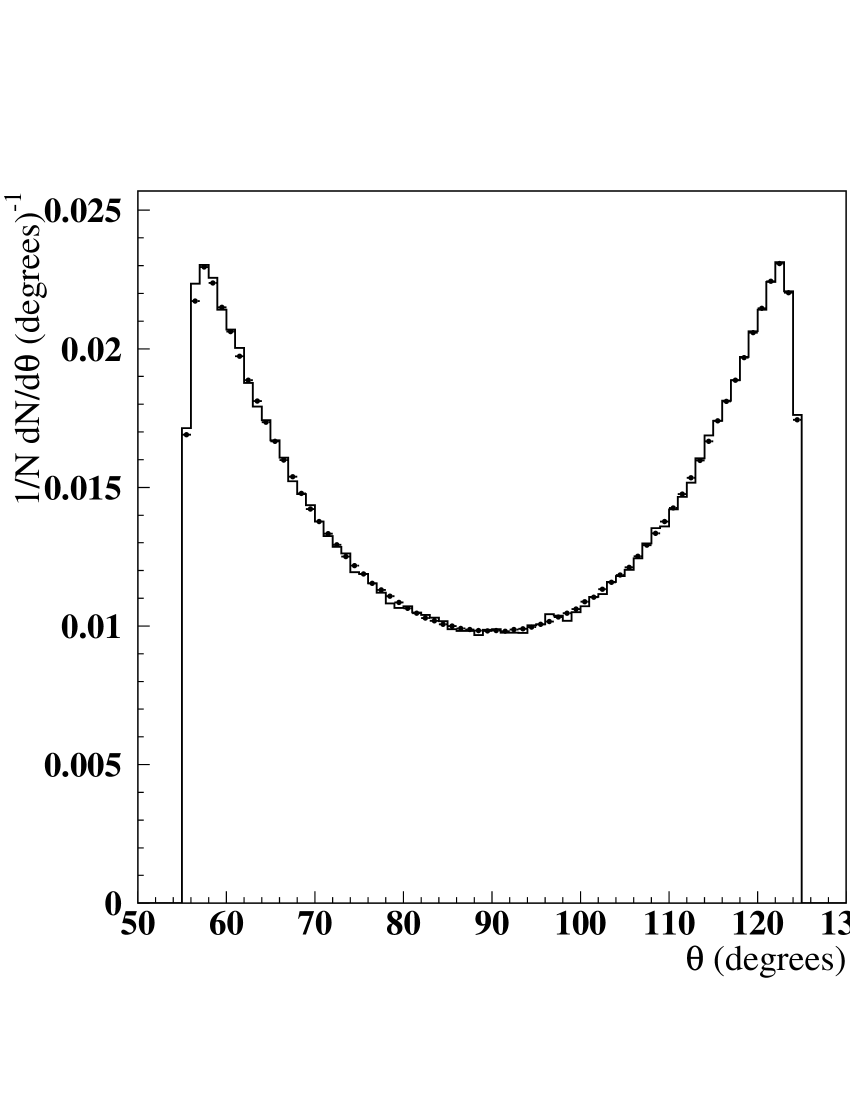
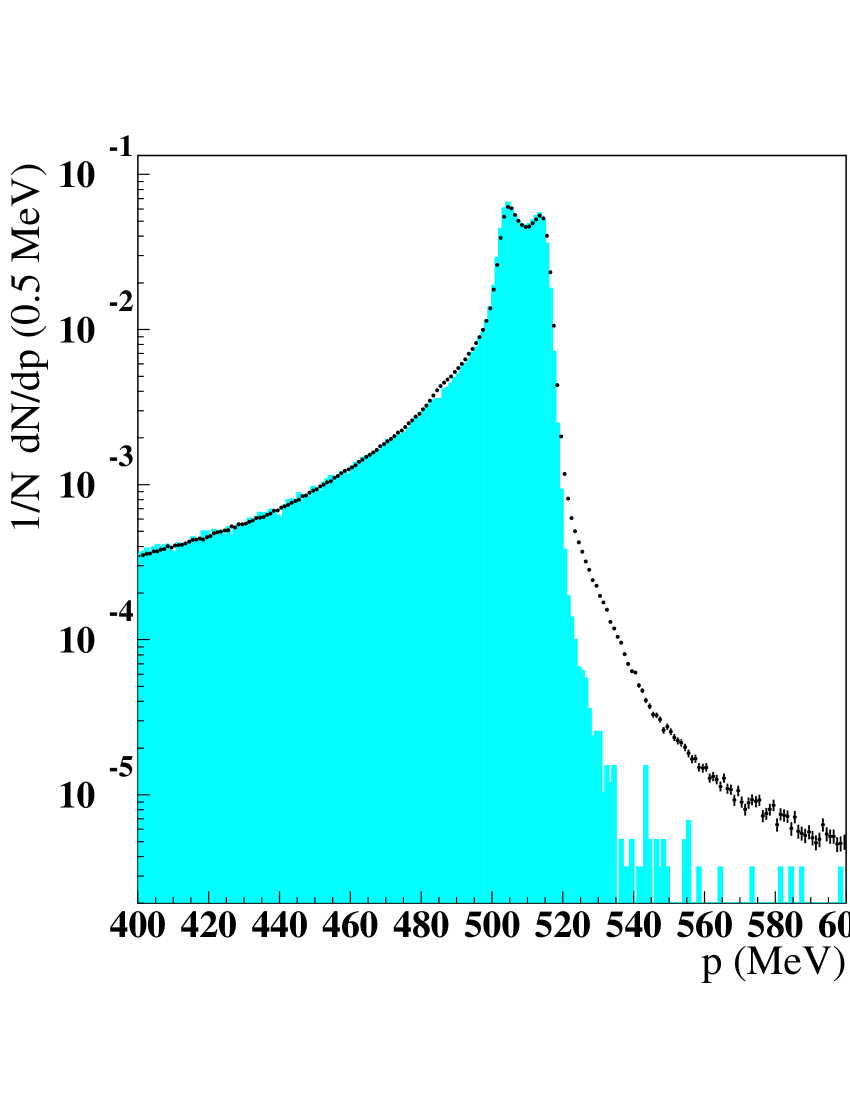
Figure 3 shows the comparison of data with the Monte Carlo simulation 111Hereafter we will implicitly refer to the event generator Babayaga, Version 3.5. This and other generators will be discussed in Sec. 7. for the distributions of momentum, , and acollinearity, . In both variables, the cuts and occur where the agreement is very good. Furthermore, both variables are cut in a region where eventual resolution mismatches between data and Monte Carlo have small effects, because far from the bulk of the distribution. Thus, any systematic error from the cuts on and is considered as negligible. The difference observed at high particle momenta is due to non-Gaussian tails in the DC reconstruction which are not simulated in Monte Carlo. However, since no high-momentum cut is applied in the selection, no systematic effect arises from this small difference.
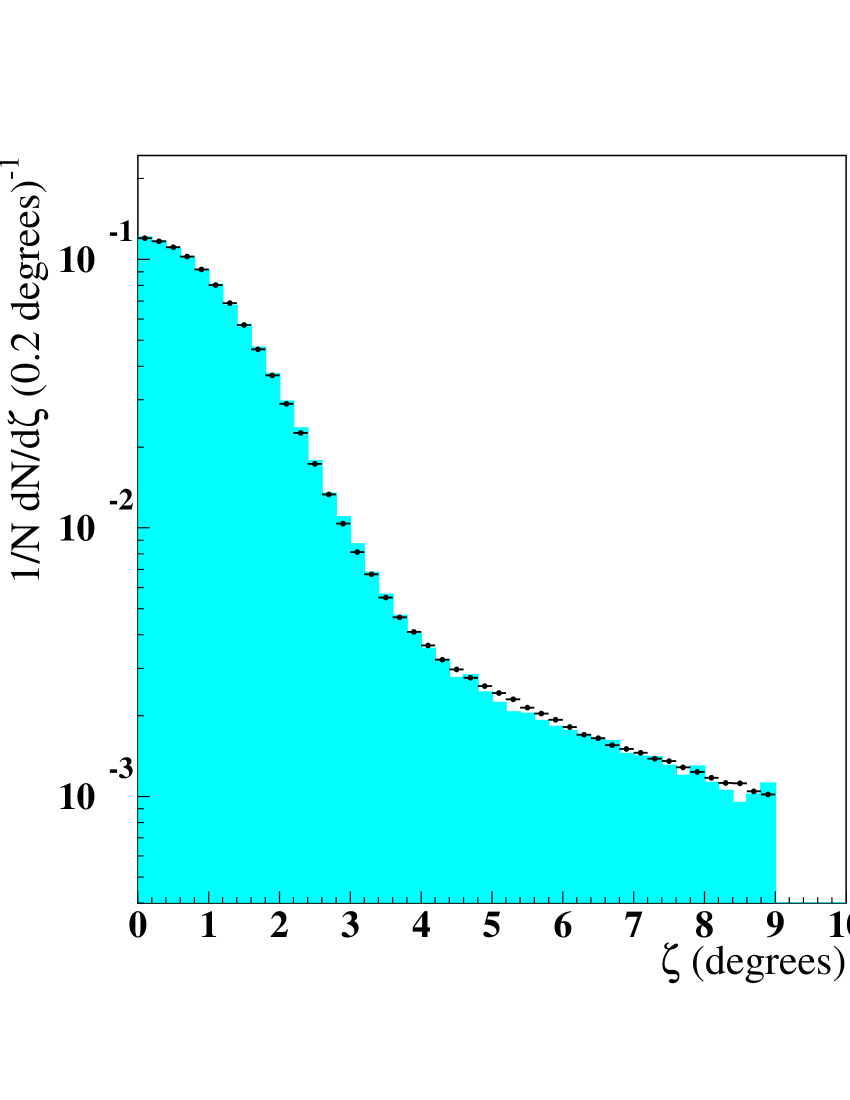
The situation is different for the requirement on the polar angle, . In this case the cut is applied in a region with a steep rise of the distribution, with a priori possible large systematic effects. Figure 4 shows the comparison of the data and the simulated distribution, both normalized to the total number of events: the overall agreement is very good. The polar angle resolution from the measurement of the calorimeter clusters is , therefore a net gain or loss of events due to a systematic difference between the polar angle resolution in data and Monte Carlo can only occur in the bins close to the borders. To evaluate the effect, the relative difference between data and Monte Carlo is computed in the border intervals (, ), after normalizing the number of Monte Carlo events, , to coincide with the number of data events, , in the central region (): the value is used both as the relative correction to the effective cross section and as systematic uncertainty on the angular acceptance. This estimate is confirmed by computing the relative variation of the luminosity as a function of the value of the cut in polar angle, :
The behaviour of as a function of shows that, in a 5∘ range, the relative variation is , consistent with the quoted systematic error.
5.2 Tracking efficiency
To evaluate the tracking efficiency we use LAB events because no tracking information is required in selecting this sample. Thus, we select events with a tagging track having and associated to one of the two LAB clusters.
In this subsample, we define the tracking efficiency as the fraction of events which fulfil the following requirements:
-
1)
at least a second track associated to the origin (as defined above), this track must be one of the two with the largest number of associated hits;
-
2)
the track must have momentum MeV and curvature opposite to the tagging track;
-
3)
the distance between the first hits of tagging and candidate track must be larger than 50 cm.
We have verified that varying the values for , , the tracking efficiency is stable and we find that the efficiency for data and Monte Carlo are:
where the errors are statistical. The relative difference is taken as the systematic uncertainty due to the tracking efficiency.
5.3 Cluster efficiency
To evaluate the cluster efficiency we select a subsample based on the tracking information. Wa ask for two and only two tracks with the following requirements:
-
–
the two tracks are connected to one and only one vertex located at cm;
-
–
both tracks are emitted at polar angle , where is measured at the vertex position;
-
–
both tracks fulfil the same requirements on the radial position of their first hit (fh) and last hit (lh) in the DC: cm and cm (these requirements exclude splitted tracks);
-
–
the electron-positron invariant mass, , must be in the range ;
-
–
the track mass, , defined as the mass associated to the momenta and under the hypothesis of a final state of two charged particles of the same mass and one photon, should be smaller than 90 MeV,
here is the average beam-beam transverse momentum measured run by run.
The last two cuts efficiently remove the background from and events. We then look for two calorimeter clusters satisfying the requirements:
-
1)
cm, being the position of the cluster in the - plane; this defines the cluster to track association;
-
2)
;
-
3)
ns.
The cluster efficiency is defined as the fraction of events in the control sample which fulfil the requirements. We have verified that varying the values for , and the efficiency is stable and we find that the values for data and Monte Carlo are in good agreement:
where the errors are statistical.
To evaluate the systematic uncertainty, the inefficiency in data has been studied and understood as due to cluster splitting, in which a cluster is split into two clusters neither of them surviving the lower energy cut. A correction of is applied to , and the following difference between data and Monte Carlo is obtained:
Since both data and Monte Carlo agree within statistical errors, we take the value as the systematic uncertainty in the cluster efficiency.
5.4 Background
Given the cut on the track momentum, , the only relevant background processes are and . The estimate of this background is based on the track mass variable, . Figure 5 shows the distribution for a sample of VLAB events: besides Bhabha scattering events, clustered at low values of , the only significant structure is the peak associated with events around . There is no evidence for background from events because of the lower cross section and of the smaller efficiency to release clusters with . We have used two methods to measure the amount of background: the first consists in fitting the track mass distribution, while in the second method we use particle identification based on time of flight method for discriminating pions (muons) from electrons, called PID function in the following.

-
1.
The PID function exploits the time of flight and the different shape of energy deposits in the calorimeter layers, of clusters associated to tracks to discriminate pions (muons) from electrons on an event-by-event basis kloeppg . The fraction of background is evaluated from events in which at least one track has been identified by the PID function as a pion,
-
2.
The distribution from Monte Carlo is well described by an exponential function in the range 100 MeV 170 MeV. We fit the distribution in this range with a Gaussian (background) plus an exponential function (signal): the relative amount of background is
Since the previous results are in agreement within statistical errors, we take the value 0.13% as the systematic uncertainty and as the background contamination in VLAB event sample.
5.5 Cosmic veto
Cosmic ray events are vetoed at the trigger level, but a fraction of these events is flagged and recorded for calibration with a downscale factor of 5. Applying the VLAB selection on the downscaled events, we estimate the total fraction of VLAB events lost due the trigger veto directly from data. The effect is stable in time and an average correction of has been applied to the effective cross section evaluated with Monte Carlo.
6 Evaluation of systematic effects
The effects on the acceptance and efficiency discussed so far do not show variations in time and therefore average corrections were applied to the whole data set. Other effects depend on the actual run conditions and there was need to determine the corrections on a run-by-run basis. As will be shown, these time dependent effects are very small. In particular they are related to energy calibration and to variations in the center of mass energy.
6.1 Calorimeter energy calibration
We have studied the effect of a variation of the calorimeter energy scale on the LAB selection, which requires two energy clusters in the interval MeV and we have computed the effect of these variations on the VLAB selection.

The 2001 data sample consists of three periods, where the EMC energy scale changed by 1%, for an energy resolution of 8%. For each period, the distribution is evaluated and compared with the Monte Carlo distribution (see Figure 6). We observe that i) the Monte Carlo overestimates the high energy tail of the distribution, and ii) there are systematic shifts in the mean value.
We have calculated the systematic effect due to overestimating the high energy tail by extrapolating the Monte Carlo distribution above MeV. The relative difference between data and Monte Carlo amounts to . The value is taken as the systematic uncertainty due to different high energy tails between data and Monte Carlo.
The effect of the shift of the energy distribution between data and Monte Carlo has been estimated by taking the difference between the mean values of the distributions as a measurement of the shift and by adding (subtracting) the events, which are gained (lost) according to this shift. The run-by-run weighted average is , and it has been considered as the relative systematic error due to variations in the calorimeter energy calibration. Furthermore we have checked that, aside from a coherent shift, the shape of the cluster energy distribution in VLAB events is the same in the three periods (see Figure 6).
The overall systematic error due to the calorimeter energy calibration is
Since the two effects tend to compensate, no correction was applied to the luminosity measurement.
6.2 Center of mass energy

The effective VLAB cross section is evaluated by Monte Carlo at the average value of the center of mass energy, . To account for variations of the beam energy, we corrected the luminosity measurement for the relative change in cross section, , where is the luminosity obtained with the nominal cross section . The VLAB events energy scale was calibrated with the well measured value of PhiMass during an energy scan EnergyScan around the resonance. Figure 7 shows as a function of time the value of measured from VLAB events: variations in never exceed a few hundred keV, and single run corrections are always smaller than 0.5%. The average correction is 0.1% and we consider this value also as the systematic uncertainty for this effect.
7 The VLAB cross section
The event generators Babayaga CarloniCalame:2000pz ; CarloniCalame:2001ny and Bhagenf Drago:1997px , developed for the large angle Bhabha scattering at DANE and based on the cross section calculated in Berends , have been interfaced with the detector simulation program GEANFI Ambrosino:2004MC for evaluating the effective cross section, as well as for estimating the systematic uncertainties. After applying the VLAB selection we find an agreement better than between the cross sections calculated with the two generators, including the event reconstruction efficiency:
The error given in the above cross section is due to the Monte Carlo statistics. The systematic theoretical uncertainty claimed by the authors is 0.5% in both cases. The radiative corrections due to the treatment of initial and final state radiation in Bhagenf and Babayaga have been compared with two other event generators: the Bhwide code Jadach:1995nk developed for LEP and the Mcgpj code Fedotovich:2003ww developed for VEPP-2M and based on the cross section calculated in Arbuzov:1997pj . Further details on the event generators and the application in the analysis can be found in reference KLOEnote . For this comparison, we applied the kinematic VLAB requirements on the generated momenta and computed the VLAB cross sections for the four generators, as shown in the table below, where errors are due to Monte Carlo statistics.
| MC code | (nb) | |
|---|---|---|
| Bhagenf | ||
| Babayaga | ||
| Mcgpj | ||
| Bhwide |
These values are obtained without considering detector smearing and loss effects and therefore the results are considerably different from the effective VLAB cross section presented before, where a full detector simulation was performed. Moreover, contributions from the decay and vacuum polarization effects are not applied, because they are the same for all generators.
The agreement among the four generators supports the systematic uncertainty of 0.5% quoted by the authors of Bhagenf and Babayaga.
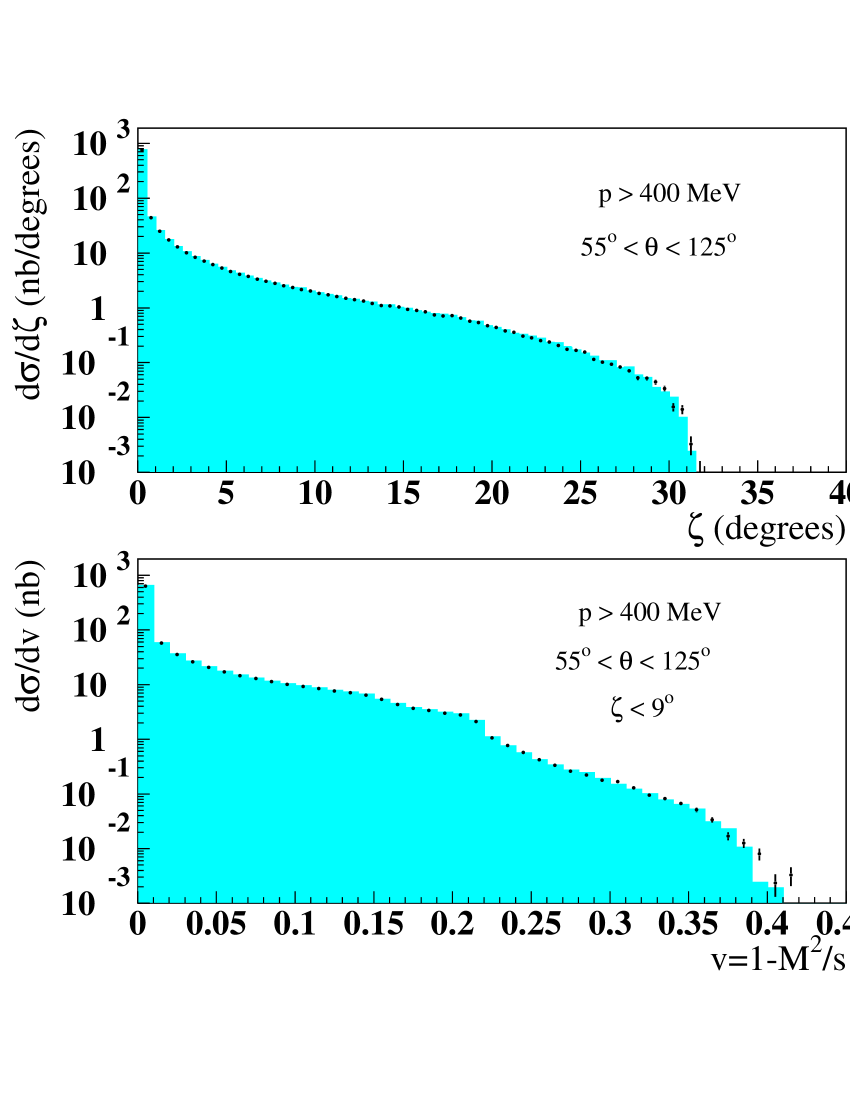
Moreover, we have compared the differential distributions for the acollinearity and the missing energy fraction , which are very sensitive to the difference in the treatment of radiative effects. Also in this case we find good agreement as can be seen in Figure 8.
8 Results
The analysis refers to the data taken during the year 2001 for an integrated luminosity of 141 pb-1. All corrections and systematic errors discussed above are summarized in Table 2. Summing all errors in quadrature, the relative experimental uncertainty for the luminosity measurement using Bhabha scattering events is .
| correction (%) | systematic error (%) | |
|---|---|---|
| angular acceptance | +0.25 | 0.25 |
| tracking | – | 0.06 |
| clustering | +0.14 | 0.11 |
| background | -0.62 | 0.13 |
| cosmic veto | +0.40 | – |
| energy calibration | – | 0.10 |
| center of mass energy | +0.10 | 0.10 |
| +0.34 | 0.32 |
Different event generators were used to evaluate the cross section, the comparison shows good agreement in the distributions of the variables used to select the events and in the value of . The value of the effective VLAB cross section has been calculated with the Babayaga event generator that has been interfaced with the GEANFI simulation program. We use a theoretical uncertainty of , that is quoted by the authors of Bhagenf and Babayaga (an improvement by more than a factor 2 is currently in progress CMCC06 ) and it is confirmed by the comparison with other event generators.
The total error of the luminosity measurement is then
Acknowledgements.
9 Acknowledgements
We thank Carlo Michel Carloni Calame, Stanislaw Jadach, Guido Montagna, Fulvio Piccinini and Alexei Sibidanov for the many fruitful discussions. We thank the DANE team for their efforts in maintaining low background running conditions and their collaboration during all data-taking. We want to thank our technical staff: G.F.Fortugno for his dedicated work to ensure an efficient operation of the KLOE Computing Center; M.Anelli for his continuous support to the gas system and the safety of the detector; A.Balla, M.Gatta, G.Corradi and G.Papalino for the maintenance of the electronics; M.Santoni, G.Paoluzzi and R.Rosellini for the general support to the detector; C.Piscitelli for his help during major maintenance periods. This work was supported in part by DOE grant DE-FG-02-97ER41027; by EURODAPHNE, contract FMRX-CT98-0169; by the German Federal Ministry of Education and Research (BMBF) contract 06-KA-957; by Graduiertenkolleg ‘H.E. Phys. and Part. Astrophys.’ of Deutsche Forschungsgemeinschaft, Contract No. GK 742; by INTAS, contracts 96-624, 99-37; and by the EU Integrated Infrastructure Initiative HadronPhysics Project under contract number RII3-CT-2004-506078.
References
- (1) N. Cabibbo and R. Gatto, Phys.Rev. 125 (1961) 1577.
- (2) G. Barbiellini et al., Nucl. Instrum. Meth. 123 (1975) 125.
- (3) H.C. Dehne et al., Nucl. Instrum. Meth. 116 (1974) 345.
- (4) C. Guiducci et al., “DANE”, presented at the Workshop on e+e- Colliders in the 1-2 GeV Range, Alghero, Italy, September 2003, e-Print Archive: physics/0403014.
- (5) A. Aloisio et al. [KLOE Coll.], Phys. Lett. B 606 (2005) 12.
- (6) M. Adinolfi et al. [KLOE Coll.], Nucl. Instrum. Meth. A 488 (2002) 51.
- (7) M. Adinolfi et al. [KLOE Coll.], Nucl. Instrum. Meth. A 482 (2002) 364.
- (8) M. Adinolfi et al. [KLOE Coll.], Nucl. Instrum. Meth. A 492 (2002) 134.
- (9) C.M. Carloni Calame et al., Nucl. Phys. B 584 (2000) 459.
- (10) C. M. Carloni Calame, Phys. Lett. B 520 (2001) 16.
- (11) E. Drago and G. Venanzoni, “A Bhabha generator for DANE including radiative corrections and resonance”, report INFN-AE-97-48.
- (12) F.A. Berends and R. Kleiss, Nucl. Phys. B 228 (1983) 537.
- (13) F. Ambrosino et al. [KLOE Coll.], Nucl. Instrum. Meth. A 534 (2004) 403.
- (14) S. Jadach, W. Placzek and B.F.L. Ward, Phys. Lett. B 390(1997) 298.
- (15) G.V. Fedotovich and A.L. Sibidanov, Nucl. Phys. B(Proc. Suppl.) 131 (2004) 9.
- (16) A. B. Arbuzov et al., JHEP 9710 (1997) 001.
- (17) A. Denig and F. Nguyen, “The KLOE luminosity measurement”, KLOE note n.202, July 2005, www.lnf.infn.it/kloe/pub/knote/kn202.ps.
- (18) R.R. Akhmetshin et al. [CMD–2 Coll.], Phys. Lett. B 578 (2004) 285.
- (19) F. Ambrosino et al. [KLOE Coll.], Phys. Lett. B 608 (2005) 199.
- (20) C. M. C. Calame, “Babayaga at NLO”, presented at the Workshop, “ Collisions from to ”, Novosibirsk, Russia, February 2006, www.inp.nsk.su/conf/phipsi06/.