HIGH PRECISION STUDY OF CP-VIOLATING CHARGE ASYMMETRY IN DECAYS
Abstract
A precise measurement of the direct CP violating charge asymmetry parameter in decays by the NA48/2 experiment at CERN SPS is presented. The experiment has been designed not to be limited by systematic uncertainties in the asymmetry measurement. A preliminary result for the charge asymmetry has been obtained with a sample of selected events corresponding to the full collected statistics. The precision of the result is limited by the statistics used.
Introduction
More than 40 years after its discovery[1], the phenomenon of CP violation still plays a central role in present and future particle physics investigations. For a long time the effect seemed to be confined to a peculiar sector of particle physics. However, two important discoveries took place recently. In the late 1990’s, following an earlier indication by NA31[2], the NA48 and KTeV experiments firmly established the existence of direct CP violation[3, 4] by measuring a non-zero parameter in the decays of neutral kaons into two pions. During the last five years, the -factory experiments Babar and Belle have discovered a series of indirect[5] and direct[6] CP violating effects in the system of neutral mesons.
In order to explore possible non-Standard Model (SM) enhancements to heavy-quark loops, which are at the core of direct CP-violating processes, all manifestations of direct CP violation have to be studied experimentally. In kaon physics, besides the parameter already measured in decays, the most promising complementary observables are decay rates of GIM-suppressed flavour-changing neutral current decays and the charge asymmetry between and decays into three pions.
Direct CP violation in decay amplitude (as in the case) provides a strong qualitative test of the way the SM accommodates CP violation. However, its quantitative exploration to constrain the fundamental parameters of the theory is difficult due to non-perturbative hadronic effects. Still, an intense theoretical programme is under way to improve such predictions, which will ultimately allow the direct CP violation measurements to be used as strong quantitative constraints on the SM.
The matrix element squared is conventionally parameterized by a polynomial expansion[7]
| (1) |
where , , are the so called linear and quadratic Dalitz plot slope parameters () and the two Lorentz invariant kinematic variables and are defined as
| (2) |
Here is the charged pion mass, and are the kaon and pion four-momenta, the indices correspond to the two identical (“even”) pions and the index to the pion of different charge (the “odd” pion). A term linear in is forbidden in (1) due to symmetry considerations. A difference of slope parameters and describing positive and negative kaon decays, respectively, is a manifestation of direct CP violation usually defined by the corresponding slope asymmetry
| (3) |
where is the slope difference and is the average slope. The asymmetry of integrated decay rates is expected to be strongly suppressed with respect to the slope asymmetry[8]. The SM predictions for [9] vary from a few to a few . Existing theoretical calculations involving processes beyond the SM[10] allow a wider range of , including substantial enhancements up to a few . Several experiments have searched for the asymmetry in both and decay modes[11]. The upper limits reached so far are at the level of a few , and are limited by systematic uncertainties.
The NA48/2 experiment is carried out in the framework of kaon physics programme at the CERN SPS. Its primary aim is to measure the asymmetries and in and decays, respectively, with a precision at least one order of magnitude better than the existing limits, which would significantly reduce the existing gap between experiments and theory.
A measurement of performed with approximately a half of the NA48/2 data sample has been published[12]. The current paper presents a preliminary result based on the full data sample.
1 Beams and detectors
High precision measurement of (at the level of ) requires not only high statistics, but also a dedicated experimental approach. A beam line transporting two simultaneous charged beams of opposite signs was designed and built as a key element leading to cancellations of main systematic uncertainties, allowing decays of and to be recorded at the same time. Regular alternation of magnetic fields in all the beam line elements and the spectrometer magnet was adopted to symmetrize the acceptance for the two beams. The layout of the beams and detectors is shown schematically in Fig. 1.
The setup is described in a right-handed orthogonal coordinate system with the axis directed downstream along the beam, and the axis directed vertically up.
The beams are produced by 400 GeV protons impinging on a beryllium target of 40 cm length and 2 mm diameter at zero incidence angle. Charged particles with momentum GeV/ are selected symmetrically for positive and negative particles by an achromatic system of four dipole magnets with null total deflection, which splits the two beams in the vertical plane and then recombines them on a common axis. They then pass through a defining collimator and a series of four quadrupoles designed to produce horizontal and vertical charge-symmetric focusing of the beams towards the detector. Finally they are again split and recombined in a second achromat, where three stations of a MICROMEGAS type detector operating in TPC mode form the kaon beam spectrometer (KABES) (however, not used in the present analysis).
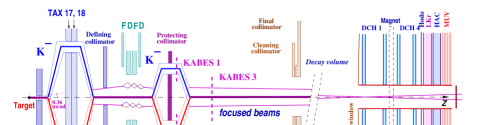
Downstream of the second achromat both beams follow the same path. After passing the cleaning and the final collimators they enter the decay volume, housed in a 114 m long cylindrical vacuum tank with a diameter of 1.92 m for the first 65 m, and 2.4 m for the rest. With protons per burst of s duration incident on the target, the positive (negative) beam flux at the entrance of the decay volume is () particles per pulse, of which () are (). The flux ratio is about . The fraction of beam kaons decaying in the decay volume is about .
The decay volume is followed by a magnetic spectrometer used for the reconstruction of decays. The spectrometer is housed in a tank filled with helium at nearly atmospheric pressure, separated from the vacuum tank by a thin ( radiation lengths) Kevlar-composite window. A thin-walled aluminium beam tube of cm diameter traversing the centre of the spectrometer (and all the other detectors) allows the undecayed beam particles and the muon halo from decays of beam pions to continue their path in vacuum. The spectrometer consists of four drift chambers (DCH): two located upstream and two downstream of the dipole magnet, which provides a horizontal transverse momentum kick of about 120 MeV/ to the charged particles. The DCHs have a shape of a regular octagon with transverse size of about 2.8 m and fiducial area of about 4.5 m2. Each chamber is composed of eight planes of sense wires arranged in four couples of staggered planes (so called views) oriented horizontally, vertically, and along each of the two orthogonal directions. The momentum resolution of the magnetic spectrometer is ( is expressed in GeV/), corresponding to a reconstructed invariant mass resolution of about MeV/.
The magnetic spectrometer is followed by a scintillator hodoscope consisting of a plane of horizontal and a plane of vertical strips, each plane is arranged in four quadrants (strip widths are 6.5 cm for central counters and 9.9 cm for peripheral ones). The hodoscope is in turn followed by a liquid krypton electromagnetic calorimeter (LKr), a hadronic calorimeter (HAC), and a muon detector (MUV).
The decays are triggered with a two-level system. At the first level (L1), the rate of kHz is reduced to kHz by requiring coincidences of hits in the two planes of the scintillator hodoscope in at least two quadrants. The second level (L2) is based on a hardware system computing coordinates of DCH hits from DCH drift times and a farm of asynchronous microprocessors performing fast reconstruction of tracks and running the decision taking algorithm. The L2 algorithm requires at least two tracks to originate in the decay volume with the closest distance of approach of less than 5 cm. L1 triggers not satisfying this condition are examined further and accepted if there is a reconstructed track that is not kinematically compatible with a decay of a having momentum of 60 GeV/ directed along the axis. The resulting trigger rate is about 10 kHz.
The description of other components of the NA48 detector less relevant for the present analysis can be found elsewhere[3].
NA48/2 collected data during two runs in 2003 and 2004, with 50 days of efficient data taking each. About triggers were totally recorded.
2 Measurement method
The measurement method is based on comparing the reconstructed spectra of and decays and . Given the actual values of the slope parameters , , and [7] and the precision of the current measurement, the ratio of spectra of is in good approximation proportional to , so can be extracted from a linear fit to the ratio , and can be evaluated.
Charge symmetrization of the experimental conditions is to a large extent achieved by using simultaneous and collinear and beams with similar momentum spectra. However, the presence of magnetic fields in both the beam line (achromats, focusing quadrupoles, etc.) and the magnetic spectrometer, combined with some asymmetries in detector performance, introduces residual charge asymmetries. In order to equalize the local effects on the acceptance, the polarities of all the magnets in the beam line were reversed during the data taking on an approximately weekly basis (corresponding to the periodicity of SPS technical stops), while the polarity of the spectrometer magnet was alternated on a more frequent basis (approximately once per day in 2003 and once in 3 hours in 2004).
Data collected over a period with all the four possible setup configurations (i.e. combinations of beam line and spectrometer magnet polarities) spanning about two weeks of efficient data taking represent a “supersample”, which is treated as an independent and self-consistent set of data for asymmetry measurement. Nine supersamples numbered 0 to 8 were collected in two years of data taking (supersamples 0–3 in 2003 and supersamples 4–8 in 2004).
Each supersample contains four sets of simultaneously collected and samples corresponding to the four different setup configurations (totally eight data samples). To measure the charge asymmetry, exploiting the cancellations of systematic biases emerging due to polarity reversals, the following “quadruple ratio” involving the eight corresponding spectra, composed as a product of four ratios with opposite kaon sign, and deliberately chosen setup configurations in numerator and denominator, is considered:
| (4) |
In the notation for the ratios, the indices () denote to beam line polarities corresponding to passing along the upper (lower) path in the achromats, respectively, while the indices () represent spectrometer magnet polarities (opposite for and ) corresponding to the “even” (i.e. the two identical) pions being deflected to negative (positive) , i.e. towards the Salève (Jura) mountains, respectively. A fit of the quadruple ratio (4) with a function results in two parameters: the normalization and the difference of slopes . The normalization is sensitive to the flux ratio, while is not.
The quadruple ratio technique logically completes the procedure of magnet polarity reversal, and allows a three-fold cancellation of systematic biases:
-
•
due to spectrometer magnet polarity reversal, local detector biases cancel between and samples with decay products reaching the same parts of the detector in each of the four ratios appearing in the quadruple ratio ;
-
•
due to the simultaneous beams, global time-variable biases cancel between and samples in the product of and ratios;
-
•
due to beam line polarity reversal, local beam line biases, resulting in slight differences in beam shapes and momentum spectra, largely cancel between the and ratios.
Remaining systematic biases due to the presence of permanent magnetic fields (Earth’s field, vacuum tank magnetization) are minimized by using azimuthally symmetric geometrical acceptance cuts discussed in the next section.
The method is independent of the flux ratio and the relative sizes of the samples collected with different magnet configurations. However, the statistical precision is limited by the smallest of the samples involved, so the balance of sample sizes was controlled during the data taking. The result remains sensitive only to time variations of asymmetries in the experimental conditions which have a characteristic time smaller than corresponding field alternation period, and in principle should be free of systematic biases.
Due to the method described above, no Monte Carlo (MC) corrections to the acceptance are required. Nevertheless, a detailed GEANT-based MC simulation was developed as a tool for systematic studies, including full detector geometry and material description, simulation of time-variable local DCH inefficiencies, time variations of the beam geometry and DCH alignment. A large MC production was carried out, providing a sample of a size comparable to that of the data ( generated events).
3 Data analysis
Several stages of data compaction and filtering were necessary in order to reduce the data volume from TB of raw data to TB of the final sample, while reducing the number of events in the sample to . The principal requirement of the filtering algorithm is the presence of at least 3 reconstructed tracks in the event, which is not passed by about of the recorded triggers.
Tracks are reconstructed from hits in DCHs using the measured magnetic field map of the spectrometer analyzing magnet rescaled according to the recorded current. Three-track vertices compatible with a decay topology are reconstructed by extrapolation of track segments from the upstream part of the spectrometer back into the decay volume, taking into account the stray magnetic fields due to the Earth and magnetization of the vacuum tank, and multiple scattering at the Kevlar window. The stray field correction is based on a three-dimensional field map measured in the entire vacuum tank. It reduces the observed azimuthal variation of the reconstructed invariant mass by more than an order of magnitude to a level below 50 keV/. The kinematics of the events is calculated using the reconstructed track momenta and directions at the vertex.
Event selection includes rejection of trigger buffer overflow111Trigger buffer overflow indicates that a corresponding event has an enhanced number of hits in DCHs and therefore saturates the L2 trigger processor leading to significant reduction of the efficiency. events, requirements on vertex charge, quality, and position (within the decay volume, and laterally within the beam), limits on the reconstructed momentum: and invariant mass: MeV/ (the latter condition corresponds to roughly five times the resolution). The selection leaves a sample of events which is practically background free, as is the dominant three-track decay mode of the charged kaon.
Fine alignment of the magnetic spectrometer
The transverse positions of DCHs and individual wires were realigned every 2–4 weeks of data taking using data collected in special runs in which muon tracks were recorded with no magnetic field in the spectrometer. This allows an alignment precision of m to be reached. However, time variations of DCH alignment on a shorter time scale can potentially bias the asymmetry, since an uncorrected shift of a DCH along the axis leads to charge-antisymmetric mismeasurement of the momenta. An unambiguous measure of the residual misalignment is the difference between the average reconstructed invariant masses for and decays (). A 1 m shift of a DCH along the axis induces a mass shift of keV/ (the proportionality factor varies among the DCHs). Monitoring of revealed significant (up to 200 m) movements of the DCHs between individual alignment runs. Introduction of time-dependent corrections to the measured momenta based on the observed reduces the effect on the slope difference by more than an order of magnitude to a negligible level of .
Correction for beam geometry instabilities
The most important feature determining the geometric acceptance is the beam tube traversing the centres of all DCHs. Moreover, the beam optics can control the average transverse beam positions to mm, leaving a sizable random charge-asymmetric bias to the acceptance. In order to compensate for this effect, inner radius cuts cm are introduced for the distances of pion impact points at the first and the last DCHs from the actual average measured beam position in DCH1 and its extrapolation from upstream of the magnet in DCH4. These cuts cost of the statistics, leading to a sample of events.
The minimum distance of 11.5 cm is chosen to ensure that the region of the beam tube and the adjacent central insensitive areas of the DCHs are securely excluded by the cut. The average beam positions are continuously monitored separately for and by calculating the momentum-weighted centre of gravity of the three pions in the planes of DCHs upstream of the magnet. A bias introduced by the fact that the average beam positions are themselves affected by the acceptance is negligible. In addition to the time variation of the average positions, also the dependencies of the beam position on kaon momentum ( mm in the horizontal plane, cm in the vertical plane) and time in spill ( mm) are monitored and taken into account. A precision of m in the determination of beam position is sufficient to reduce systematic effects to a negligible level.
Residual charge-asymmetric effects originate from permanent (irreversible) magnetic fields in the decay volume coupling to time-dependent DCH inefficiencies and beam migrations. The corresponding fake asymmetries have been estimated not to exceed .
Trigger efficiency correction
Only charge-asymmetric trigger inefficiencies dependent on can possibly bias the measurement. Inefficiencies of the trigger components are measured as functions of using control data samples from low bias triggers collected along with the main triggers. Thus time variations of inefficiencies can be accounted for and the statistical errors on the inefficiency measurements are propagated into the final result. Control trigger condition for L1 efficiency measurement requires at least one coincidence of hits in the two planes of the scintillator hodoscope. Control triggers for L2 efficiency measurement are L1 triggers recorded regardless of the L2 response. The statistics of each of the two control samples is roughly 1% of the main sample.
The inefficiency of the L1 trigger, due to hodoscope inefficiency, was measured to be and found to be stable in time. Due to temporary malfunctioning of particular hodoscope channels, some fractions of data are affected by higher inefficiency (up to ), the source of the inefficiency being localized in space. This kind of inefficiency was reduced to the common level (and symmetrized) in the selected data sample by applying appropriate geometric cuts to the pion impact points on the hodoscope surface for the relevant supersamples. This procedure cost 7.1% of the statistics, and led to the final sample of events. Due to the time stability of the L1 inefficiency, no correction is applied, and an uncertainty of , limited by the statistics of the control sample, is attributed.
For the L2 trigger, corrections to spectra are introduced for the rate-independent part of the inefficiency, which is time-dependent due to instabilities of the local DCH inefficiencies affecting the trigger more than the reconstruction due to lower redundancy. The integral inefficiency for the selected sample is normally close to , but some periods are affected by higher inefficiency of up to 1.5% (its sources not being trivially localized in space). The L2 inefficiency correction to the whole statistics amounts to , where the error is statistical due to the limited size of the control sample. The symmetry of the rate-dependent part of the inefficiency of was checked separately with MC simulation of pile-up effects and a study of the dependence of the result on the number of allowed accidental tracks.
Asymmetry fits and cross-checks
After applying the corrections described above, is extracted by fitting the quadruple ratio of the spectra (4) independently for each supersample. The numbers of events selected in each supersample, the “raw” values of obtained without applying the trigger corrections and the final values of with the L2 trigger corrections applied are presented in Table 1. The independent results obtained in the nine supersamples are shown in Figure 2(a): the individual measurements are compatible with a .
| Supersample | ||||
| decays in | decays in | raw | corrected | |
| 0 | 448.0 | 249.7 | ||
| 1 | 270.8 | 150.7 | ||
| 2 | 265.5 | 147.8 | ||
| 3 | 86.1 | 48.0 | ||
| 4 | 232.5 | 129.6 | ||
| 5 | 142.4 | 79.4 | ||
| 6 | 193.8 | 108.0 | ||
| 7 | 195.9 | 109.1 | ||
| 8 | 163.9 | 91.4 | ||
| Total | 1998.9 | 1113.7 |
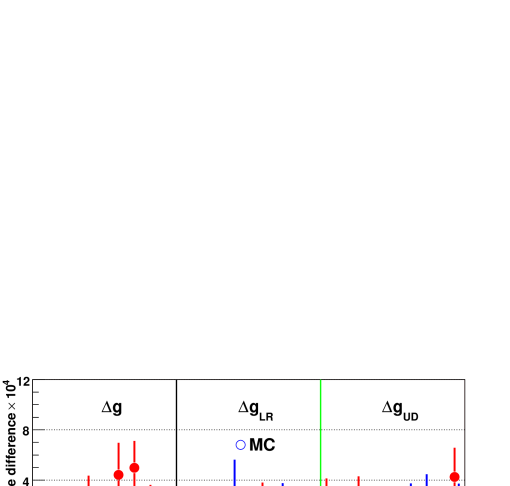
As a systematic check, to measure the size of the systematic biases cancelling due to the quadruple ratio technique, two other quadruple ratios of the eight spectra were formed. These are the products of four ratios of spectra of same sign kaons recorded with different setup configurations, therefore any physical asymmetry cancels in these ratios, while the setup asymmetries do not. The fake slope difference introduced by global time-variable biases does not cancel in ratios with opposite spectrometer polarities and identical beam line polarities in numerator and denominator, or equivalently, in the adopted notation
| (5) |
Similarly, the fake slope difference introduced by the differences of the two beam paths does not cancel in ratios with opposite beam line polarities and identical spectrometer polarities, which look in the following way in the adopted notation:
| (6) |
The measured fake slope differences and in the nine supersamples are presented in Figure 2(b) and (c) for both data and MC. The size of these control quantities demonstrates that the cancellation of the first-order systematic biases in (4), due to residual time-variable imperfections in the apparatus, is at the level of a few ; therefore second order effects are negligible. Moreover, the comparison with MC simulations shows that the sizes of the apparatus asymmetries are well understood in terms of local inefficiencies and beam optics variations.
Limits for residual systematic effects
The measurement of pion momenta is based on the knowledge of the magnetic field in the spectrometer magnet. The variation of the current in the magnet can be monitored with a relative precision of . Smaller variations are continuously controlled with a precision of by the deviation of the measured charge-averaged kaon mass from the nominal value. A time-dependent correction can be introduced by scaling the reconstructed pion momenta symmetrically for positive and negative tracks. However, this rather large momentum scale effect is charge symmetric by design, due to the simultaneous beams. A conservative upper limit of for the corresponding systematic uncertainty was obtained by comparing the results evaluated with and without the correction.
In a considerable fraction of the selected events () at least one of the pions undergoes a decay in the decay volume and the spectrometer reconstructs the resulting muon. The tails of the reconstructed invariant mass distribution are dominated by these events. Rejection of events with decays in MC analysis did not lead to any significant change of the result. By varying the accepted invariant mass interval in a wide range (5–25 MeV/) a conservative systematic uncertainty of was attributed to effects due to pion decays.
Taking into account that the composition of the beams is not charge symmetric, event distortions caused by pile-up with products of another kaon decay or a beam halo particle traversing the sensitive region of the spectrometer is a potential source of systematic bias. To study the pile-up effects, an accidental activity generator, tuned using the measured beam and halo fluxes, composition and kinematic distributions, was introduced into the MC, and a production of correlated pairs of an initial event and a perturbed piled-up event was carried out. No charge-asymmetric effects on distributions either in the reconstruction or in the second level trigger were observed down to a level of , limited by MC statistics.
Biases due to resolution effects were studied by using various methods of variable calculation from the measured track momenta (including a 4C kinematic fit) differing in resolution as a function of itself. The result is stable within .
Charge-asymmetric material effects have been found to be negligible by evaluating the effect of hadronic interactions in the material in front of and in the chambers taking into account the pion spectra.
A summary of the systematic uncertainties and trigger corrections is presented in Table 2.
| Systematic effect | Correction, uncertainty |
|---|---|
| Spectrometer alignment | |
| Acceptance and beam geometry | |
| Momentum scale | |
| Pion decay | |
| Pile-up | |
| Resolution and fitting | |
| Total systematic uncertainty | |
| Level 1 trigger | |
| Level 2 trigger |
Conclusions
The difference in the linear slope parameter of the Dalitz plot for decays of and , measured with the full NA48/2 data sample, is found to be
| (7) |
Converted to the direct CP violating charge asymmetry in decays using the PDG value of the Dalitz plot slope [7], this leads to
| (8) |
Analysis based on the full data sample has made a notable improvement in the final uncertainty with respect to the published analysis based on about a half of the data sample[12]. The result has times better precision than the best measurement before NA48/2, and the precision is still limited mainly by the available statistics (the uncertainty due to the trigger inefficiency is of statistical nature).
The result is compatible with the Standard Model predictions, however due to its high precision it can be used to constrain extensions of the Standard Model predicting enhancements of the charge asymmetry.
References
- 1 . J.H. Christenson et al., Phys. Rev. Lett. 13, 138 (1964).
-
2 .
H. Burkhardt et al. (NA31), Phys. Lett. B206, 169 (1988).
G. Barr et al. (NA31), Phys. Lett. B317, 233 (1993). -
3 .
V. Fanti et al. (NA48), Phys. Lett. B465, 335 (1999).
A. Lai et al. (NA48), Eur. Phys. J. C22, 231 (2001).
J.R. Batley et al. (NA48), Phys. Lett. B544, 97 (2002). -
4 .
A. Alavi-Harati et al. (KTeV), Phys. Rev. Lett. 83, 22 (1999).
A. Alavi-Harati et al. (KTeV), Phys. Rev. D67, 012005 (2003). -
5 .
B. Aubert et al. (Babar), Phys. Rev. Lett. 87, 091801 (2001).
K. Abe et al. (Belle), Phys. Rev. Lett. 87, 091802 (2001). -
6 .
K. Abe et al. (Belle), Phys. Rev. Lett. 93, 021601 (2004).
B. Aubert et al. (Babar), Phys. Rev. Lett. 93, 131801 (2004). - 7 . S. Eidelman et al. (Particle Data Group), Phys. Lett. B592, 1 (2004).
- 8 . G. Isidori, L. Maiani, A. Pugliese, Nucl. Phys. B381, 522 (1992).
-
9 .
A.A. Belkov, A.V. Lanyov, G. Bohm, hep-ph/0311209.
E. Gamiz, J. Prades, I. Scimemi, JHEP 10, 042 (2003).
G. D’Ambrosio, G. Isidori, Int. J. Mod. Phys. A13, 1 (1998).
E.P. Shabalin, Phys. Atom. Nucl. 68, 88 (2005). -
10 .
E.P. Shabalin, ITEP preprint 8-98 (1998).
G. D’Ambrosio, G. Isidori, G. Martinelli, Phys. Lett. B480, 164 (2000). -
11 .
W.T. Ford et al., Phys. Rev. Lett. 25, 1370 (1970).
K.M. Smith et al., Nucl. Phys. B91, 45 (1975).
G.A. Akopdzhanov et al. (TNF–IHEP), Eur. Phys. J. C40, 343 (2005). - 12 . J.R. Batley et al. (NA48/2), Phys. Lett. B634, 474 (2006).