FERMI NATIONAL ACCELERATOR LABORATORY
FERMILAB-TM-2347-E
TEVEWWG/top 2006/01
CDF Note 8162
DØ Note 5064
18-March-2006
Combination of CDF and DØ Results
on the Mass of the Top Quark
The Tevatron Electroweak Working Group111WWW access at
http://tevewwg.fnal.gov
The members of the TEVEWWG who contributed significantly to the
analysis described in this note are:
E. Brubaker (brubakee@fnal.gov), F. Canelli (canelli@fnal.gov), R. Demina (demina@fnal.gov), R. Erbacher (robine@fnal.gov), I. Fleck (fleck@fnal.gov), D. Glenzinski (douglasg@fnal.gov), G. Gutierrez (gaston@fnal.gov), M. W. Grünewald (mwg@fnal.gov), A. Juste (juste@fnal.gov), T. Maruyama (maruyama@fnal.gov), A. Quadt (quadt@fnal.gov), E. Thomson (thomsone@fnal.gov), C. Tully (tully@fnal.gov), E. W. Varnes (varnes@fnal.gov), D. O. Whiteson (danielw@fnal.gov), U.K. Yang (ukyang@fnal.gov).
for the CDF and DØ Collaborations
Abstract
We summarize the top-quark mass measurements from the CDF and DØ experiments at Fermilab. We combine published Run-I (1992-1996) measurements with the most recent preliminary Run-II (2001-present) measurements using up to of data. Taking correlated uncertainties properly into account the resulting preliminary world average mass of the top quark is , which corresponds to a total uncertainty of . The top-quark mass is now known with a precision of 1.3% — a 20% improvement relative to the previous combination.
1 Introduction
The experiments CDF and DØ, taking data at the Tevatron proton-antiproton collider located at the Fermi National Accelerator Laboratory, have made several direct experimental measurements of the top-quark pole mass, . The pioneering measurements were based on about of Run-I (1992-1996) data [1, 2, 3, 4, 5, 6, 7, 8, 9, 10, 11, 12] and include results from the (all-j), the (l+j), and the (di-l) decay channels222Here or . Decay channels with explicit tau lepton identification are presently under study and are not yet used for measurements of the top-quark mass.. Results using approximately of Run-II (2001-present) data have been recently published in the l+j and di-l channels [13, 14, 15]. The Run-II measurements summarized here are the most recent preliminary results in the l+j and di-l channels using of data and improved analysis techniques [16, 17, 18, 19].
This note reports the world average top-quark mass obtained by combining five published Run-I measurements [2, 3, 5, 7, 10, 11] with the most recent preliminary Run-II measurements from CDF [16, 17] and DØ [18, 19]. The combination takes into account the statistical and systematic uncertainties and their correlations using the method of references [20, 21] and supersedes previous combinations [22, 23]. The most precise individual measurements of are now the preliminary measurements in the l+j channel from Run II. These are (CDF, [16]) and (DØ, [18]). These have weights in the new combination of 58% and 21%, respectively.
The input measurements and error categories used in the combination are detailed in Section 2 and 3, respectively. The correlations used in the combination are discussed in Section 4 and the resulting world average top-quark mass is given in Section 5. A summary and outlook are presented in Section 6.
2 Input Measurements
For this combination nine measurements of are used, five published Run-I results and four preliminary Run-II results. In general, the Run-I measurements all have relatively large statistical uncertainties and their systematic uncertainty is dominated by the total jet energy scale (JES) uncertainty. In Run-II both CDF and DØ take advantage of the larger samples available and employ new analysis techniques to reduce both these uncertainties. In particular the JES is constrained using an in-situ calibration based on the invariant mass of decays in the l+j channel. The Run-II DØ analysis in the l+j channel constrains the response of light-quark jets using the in-situ decays. The JES determined in this manner is then propagated to their measurement in the di-l channel. Residual JES uncertainties associated with and -dependencies as well as uncertainties specific to the response of -jets are treated separately. Similarly, the Run-II CDF analysis in the l+j channel also constrains the JES using the in-situ decays. The JES is also determined using “external” calibration samples as was done for the Run-I measurements. This external JES is applied as an additional constraint in this CDF analysis to improve further the total JES uncertainty. Small residual JES uncertainties arising from and -dependencies and the modeling of -jets are included in separate error categories. The Run-II CDF measurement in the di-l channel uses only the externally determined JES, some parts of which are correlated with the externally determined Run-I JES as noted below.
The CDF Run-II measurement in the l+j channel requires special treatment in order to account more accurately for the correlations of the JES uncertainties since the fit uses information from both the in-situ and external JES calibrations. In the combination we treat this one measurement as two separate inputs - one which includes only the in-situ JES calibration, (l+j)i, and a second which includes only the JES as determined from the external calibration samples, (l+j)e. We correlate the JES related error categories as described below while taking the rest of the error categories to be 100% correlated between these two inputs. The combination of just these two inputs using these correlations yields the identical central value, statistical, JES, and total systematic uncertainty as the measurement reported in reference [16]. The correlations between these two inputs and the rest of the inputs are as described in Section 4.
The inputs used in the combination are summarized in Table 1 with their uncertainties sub-divided into the categories described in the next Section.
| Run-I published | Run-II preliminary | |||||||||
| CDF | DØ | CDF | DØ | |||||||
| all-j | l+j | di-l | l+j | di-l | (l+j)i | (l+j)e | di-l | l+j | di-l | |
| Lumi () | 110 | 105 | 110 | 125 | 125 | 680 | 680 | 750 | 370 | 370 |
| Result | 186.0 | 176.1 | 167.4 | 180.1 | 168.4 | 173.4 | 173.4 | 164.5 | 170.6 | 176.6 |
| iJES | 0.0 | 0.0 | 0.0 | 0.0 | 0.0 | 2.2 | 0.0 | 0.0 | 0.0 | 0.0 |
| aJES | 0.0 | 0.0 | 0.0 | 0.0 | 0.0 | 0.0 | 0.0 | 0.0 | 0.8 | 1.2 |
| bJES | 0.6 | 0.6 | 0.8 | 0.7 | 0.7 | 0.6 | 0.6 | 0.5 | 0.7 | 1.2 |
| cJES | 3.0 | 2.7 | 2.6 | 2.0 | 2.0 | 0.0 | 2.0 | 2.2 | 0.0 | 0.0 |
| dJES | 0.3 | 0.7 | 0.6 | 0.0 | 0.0 | 0.0 | 0.6 | 0.8 | 3.4 | 3.1 |
| rJES | 4.0 | 3.4 | 2.7 | 2.5 | 1.1 | 0.0 | 2.2 | 1.1 | 0.0 | 0.0 |
| Signal | 1.8 | 2.6 | 2.8 | 1.1 | 1.8 | 0.7 | 0.7 | 0.8 | 0.5 | 1.2 |
| BG | 1.7 | 1.3 | 0.3 | 1.0 | 1.1 | 0.5 | 0.5 | 1.2 | 0.4 | 0.2 |
| Fit | 0.6 | 0.0 | 0.7 | 0.6 | 1.1 | 0.8 | 0.8 | 0.8 | 0.5 | 0.7 |
| MC | 0.8 | 0.1 | 0.6 | 0.0 | 0.0 | 0.3 | 0.3 | 0.5 | 0.0 | 0.0 |
| UN/MI | 0.0 | 0.0 | 0.0 | 1.3 | 1.3 | 0.0 | 0.0 | 0.0 | 0.0 | 0.0 |
| Syst. | 5.7 | 5.3 | 4.9 | 3.9 | 3.6 | 2.6 | 3.3 | 3.1 | 3.7 | 3.8 |
| Stat. | 10.0 | 5.1 | 10.3 | 3.6 | 12.3 | 1.7 | 1.7 | 4.5 | 2.8 | 11.2 |
| Total | 11.5 | 7.3 | 11.4 | 5.3 | 12.8 | 3.1 | 3.7 | 5.5 | 4.6 | 11.8 |
3 Error Categories
We employ the same error categories as used for the previous world average [23]. They have evolved to include a detailed breakdown of the various sources of uncertainty and aim to lump together sources of systematic uncertainty that share the same or similar origin. For example, the “Signal” category discussed below includes the uncertainties from ISR, FSR, and PDF - all of which affect the modeling of the signal. Additional categories have been added in order to accommodate specific types of correlations. For example, the jet energy scale (JES) uncertainty is sub-divided into several components in order to more accurately accommodate our best estimate of the relevant correlations. Each error category is discussed below.
- Statistical:
-
The statistical uncertainty associated with the determination.
- iJES:
-
That part of the JES uncertainty which originates from in-situ calibration procedures and is uncorrelated among the measurements. In the combination reported here it corresponds to the statistical uncertainty associated with the JES determination using the invariant mass in the CDF Run-II l+j measurement. Residual JES uncertainties, which arise from effects not considered in the in-situ calibration, are included in other categories.
- aJES:
-
That part of the JES uncertainty which originates from differences in detector response between -jets and light-quark jets. It is specific to the DØ Run-II measurements and is taken to be uncorrelated with the DØ Run-I and CDF measurements.
- bJES:
-
That part of the JES uncertainty which originates from uncertainties specific to the modeling of -jets and which is correlated across all measurements. For both CDF and DØ this includes uncertainties arising from variations in the semi-leptonic branching fraction, -fragmentation modeling, and differences in the color flow between -jets and light-quark jets. These were determined from Run-II studies but back-propagated to the Run-I measurements, whose rJES uncertainties (see below) were then corrected in order to keep the total JES uncertainty constant.
- cJES:
-
That part of the JES uncertainty which originates from modeling uncertainties correlated across all measurements. Specifically it includes the modeling uncertainties associated with light-quark fragmentation and out-of-cone corrections.
- dJES:
-
That part of the JES uncertainty which originates from limitations in the calibration data samples used and which is correlated between measurements within the same data-taking period (ie. Run I or Run II) but not between experiments. For CDF this corresponds to uncertainties associated with the -dependent JES corrections which are estimated using di-jet data events. For DØ Run-II this corresponds to uncertainties associated with the light-quark response as determined using the invariant mass in the l+j channel and propagated to the di-l channel. The residual -dependent and -dependent uncertainties for the DØ Run-II measurements are also included here since they are constrained using Run-II jet data samples.
- rJES:
-
The remaining part of the JES uncertainty which is correlated between all measurements of the same experiment independent of data-taking period, but is uncorrelated between experiments. This is dominated by uncertainties in the calorimeter response to light-quark jets. For CDF this also includes small uncertainties associated with the multiple interaction and underlying event corrections.
- Signal:
-
The systematic uncertainty arising from uncertainties in the modeling of the signal which is correlated across all measurements. This includes uncertainties from variations in the ISR, FSR, and PDF descriptions used to generate the Monte Carlo samples that calibrate each method. It also includes small uncertainties associated with biases associated with the identification of -jets.
- Background:
-
The systematic uncertainty arising from uncertainties in modeling the dominant background sources and correlated across all measurements in the same channel. These include uncertainties on the background composition and shape. In particular uncertainties associated with the modeling of the QCD multi-jet background (all-j and l+j), uncertainties associated with the modeling of the Drell-Yan background (di-l), and uncertainties associated with variations of the fragmentation scale used to model W+jets background (all channels) are included.
- Fit:
-
The systematic uncertainty arising from any source specific to a particular fit method, including the finite Monte Carlo statistics available to calibrate each method.
- Monte Carlo:
-
The systematic uncertainty associated with variations of the physics model used to calibrate the fit methods and correlated across all measurements. For CDF it includes variations observed when substituting PYTHIA [24, 25, 26] (Run I and Run II) or ISAJET [27] (Run I) for HERWIG [28, 29] when modeling the signal. Similar variations are included for the DØ Run-I measurements. The DØ Run-II measurements use ALPGEN [30] to model the signal and the variations considered are included in the Signal category above.
- UN/MI:
-
This is specific to DØ and includes the uncertainty arising from uranium noise in the DØ calorimeter and from the multiple interaction corrections to the JES. For DØ Run-I these uncertainties were sizable, while for Run-II owing to the shorter integration time and in-situ JES determination, these uncertainties are negligible.
These categories represent the current preliminary understanding of the various sources of uncertainty and their correlations. We expect these to evolve as we continue to probe each method’s sensitivity to the various systematic sources with ever improving precision. Variations in the assignment of uncertainties to the error categories, in the back-propagation of the bJES uncertainties to Run-I measurements, in the approximations made to symmetrize the uncertainties used in the combination, and in the assumed magnitude of the correlations all negligibly effect () the combined and total uncertainty.
4 Correlations
The following correlations are used when making the combination:
-
•
The uncertainties in the Statistical, Fit, and iJES categories are taken to be uncorrelated among the measurements.
-
•
The uncertainties in the aJES and dJES categories are taken to be 100% correlated among all Run-I and all Run-II measurements on the same experiment, but uncorrelated between Run I and Run II and uncorrelated between the experiments.
-
•
The uncertainties in the rJES and UN/MI categories are taken to be 100% correlated among all measurements on the same experiment.
-
•
The uncertainties in the Background category are taken to be 100% correlated among all measurements in the same channel.
-
•
The uncertainties in the bJES, cJES, Signal, and Generator categories are taken to be 100% correlated among all measurements.
Using the inputs from Table 1 and the correlations specified here, the resulting matrix of total correlation co-efficients is given in Table 2.
| Run-I published | Run-II preliminary | ||||||||||
|---|---|---|---|---|---|---|---|---|---|---|---|
| CDF | DØ | CDF | DØ | ||||||||
| l+j | di-l | all-j | l+j | di-l | (l+j)i | (l+j)e | di-l | l+j | di-l | ||
| CDF-I | l+j | 1.00 | |||||||||
| CDF-I | di-l | 0.29 | 1.00 | ||||||||
| CDF-I | all-j | 0.32 | 0.19 | 1.00 | |||||||
| DØ-I | l+j | 0.26 | 0.15 | 0.14 | 1.00 | ||||||
| DØ-I | di-l | 0.11 | 0.08 | 0.07 | 0.16 | 1.00 | |||||
| CDF-II | (l+j)i | 0.13 | 0.07 | 0.05 | 0.10 | 0.04 | 1.00 | ||||
| CDF-II | (l+j)e | 0.57 | 0.32 | 0.39 | 0.29 | 0.12 | 0.41 | 1.00 | |||
| CDF-II | di-l | 0.30 | 0.19 | 0.21 | 0.19 | 0.11 | 0.06 | 0.40 | 1.00 | ||
| DØ-II | l+j | 0.07 | 0.04 | 0.03 | 0.06 | 0.02 | 0.07 | 0.06 | 0.03 | 1.00 | |
| DØ-II | di-l | 0.04 | 0.03 | 0.02 | 0.03 | 0.02 | 0.04 | 0.04 | 0.03 | 0.24 | 1.00 |
The measurements are combined using a program implementing a numerical minimization as well as the analytic BLUE method [20, 21]. The two methods used are mathematically equivalent, and are also equivalent to the method used in an older combination [31], and give identical results for the combination. In addition, the BLUE method yields the decomposition of the error on the average in terms of the error categories specified for the input measurements [21].
5 Results
The combined value for the top-quark mass is:
| (1) |
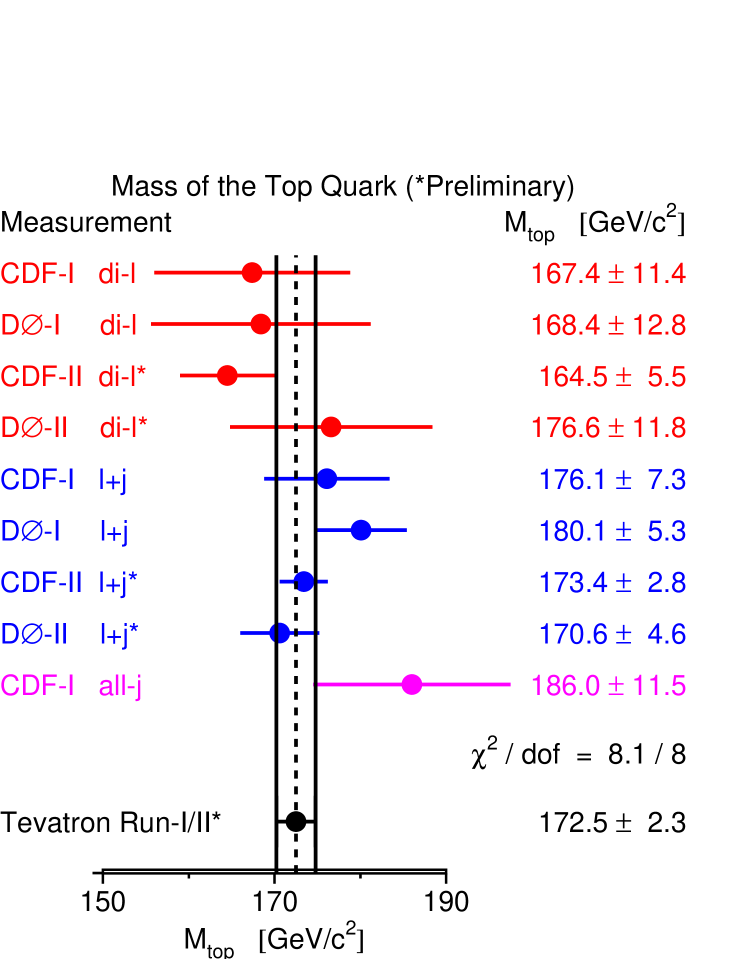
with a of 8.1 for 8 degrees of freedom, which corresponds to a probability of 42% indicating good agreement among all the input measurements. The total uncertainty can be sub-divided into the contributions from the various error categories as: Statistical (), total JES (), Signal (), Background (), Fit (), Monte Carlo (), and UN/MI (), for a total Systematic (), where all numbers are in units of . The pull and weight for each of the inputs are listed in Table 3. The input measurements and the resulting world average mass of the top quark are summarized in Figure 1.
In the previous combination, for the CDF Run-II l+j measurement using 320 of data, the in-situ and external JES calibrated inputs each carried approximately the same weight. In the combination reported here, the weight of the CDF Run-II l+j input using the in-situ JES calibration carries three times the weight of its counterpart using the external JES calibration. This trend is expected to continue since the in-situ JES uncertainty is expected to improve as the statistics of the sample increase with larger data sets. In contrast the uncertainty on the external JES calibration already has large contributions from modeling uncertainties which may not be reduced with larger data sets.
The weight of the CDF Run-I l+j measurement is negative. In general, this situation can occur if the correlation between two measurements is larger than the ratio of their total uncertainties. This is indeed the case here, where the CDF Run-I l+j measurement is 57% correlated with the externally calibrated CDF Run-II l+j measurement, but with a total uncertainty that is about twice as large. In these instances the less precise measurement will usually acquire a negative weight. While a weight of zero means that a particular input is effectively ignored in the combination, a negative weight means that it affects the resulting central value and helps reduce the total uncertainty. See reference [20] for further discussion of negative weights.
| Run-I published | Run-II preliminary | |||||||||
| CDF | DØ | CDF | DØ | |||||||
| l+j | di-l | all-j | l+j | di-l | (l+j)i | (l+j)e | di-l | l+j | di-l | |
| Pull | ||||||||||
| Weight [%] | ||||||||||
Although the from the combination of all measurements indicates that there is good agreement among them, and no input has an anomalously large pull, it is still interesting to also fit for the top-quark mass in the all-j, l+j, and di-l channels separately. We use the same methodology, inputs, error categories, and correlations as described above, but fit for the three physical observables, , , and . The results of this combination are shown in Table 4 and have of 3.6 for 6 degrees of freedom, which corresponds to a probability of 73%. These results differ from a naive combination, where only the measurements in a given channel contribute to the determination in that channel, since the combination here fully accounts for all correlations, including those which cross-correlate the different channels. Using the results of Table 4 we calculate the chi-squared consistency between any two channels, including all correlations, as , , and . These correspond to chi-squared probabilities of 8%, 25%, and 8%, respectively, and indicate that the determinations of from the three channels are consistent with one another.
| Parameter | Value () | Correlations | ||
|---|---|---|---|---|
| 1.00 | ||||
| 0.20 | 1.00 | |||
| 0.11 | 0.32 | 1.00 | ||
6 Summary
A preliminary combination of measurements of the mass of the top quark from the Tevatron experiments CDF and DØ is presented. The combination includes five published Run-I measurements and four preliminary Run-II measurements. Taking into account the statistical and systematic uncertainties and their correlations, the preliminary world-average result is: .
The mass of the top quark is now known with an accuracy of 1.3%, limited by the systematic uncertainties, which are dominated by the jet energy scale uncertainty. This systematic is expected to improve as larger data sets are collected since new analysis techniques constrain the jet energy scale using in-situ decays. It can be reasonably expected that with the full Run-II data set the top-quark mass could be known to better than 1%. To reach this level of precision further work is required to determine more accurately the various correlations present, and to understand more precisely the -jet modeling, Signal, and Background uncertainties which may limit the sensitivity at larger data sets. Limitations of the Monte Carlo generators used to calibrate each fit method may also become important as the precision reaches the level and will warrant further study in the future.
References
- [1] The CDF Collaboration, F. Abe et al., Measurement of the top quark mass and production cross section from dilepton events at the Collider Detector at Fermilab, Phys. Rev. Lett. 80 (1998) 2779, hep-ex/9802017.
- [2] The CDF Collaboration, F. Abe et al., Measurement of the top quark mass with the Collider Detector at Fermilab, Phys. Rev. Lett. 82 (1999) 271, hep-ex/9810029.
- [3] The CDF Collaboration, F. Abe et al., Measurement of the top quark mass with the Collider Detector at Fermilab, Erratum: Phys. Rev. Lett. 82 (1999) 2808, hep-ex/9810029.
- [4] The DØ Collaboration, B. Abbott et al., Measurement of the top quark mass using dilepton events, Phys. Rev. Lett. 80 (1998) 2063, hep-ex/9706014.
- [5] The DØ Collaboration, B. Abbott et al., Measurement of the top quark mass in the dilepton channel, Phys. Rev. D60 (1999) 052001, hep-ex/9808029.
- [6] The CDF Collaboration, F. Abe et al., Measurement of the top quark mass, Phys. Rev. Lett. 80 (1998) 2767, hep-ex/9801014.
- [7] The CDF Collaboration, T. Affolder et al., Measurement of the top quark mass with the Collider Detector at Fermilab, Phys. Rev. D63 (2001) 032003, hep-ex/0006028.
- [8] The DØ Collaboration, S. Abachi et al., Direct measurement of the top quark mass, Phys. Rev. Lett. 79 (1997) 1197, hep-ex/9703008.
- [9] The DØ Collaboration, B. Abbott et al., Direct measurement of the top quark mass at DØ, Phys. Rev. D58 (1998) 052001, hep-ex/9801025.
- [10] The DØ Collaboration, V. M. Abazov et al., A precision measurement of the mass of the top quark, Nature 429 (2004) 638, hep-ex/0406031.
- [11] The CDF Collaboration, F. Abe et al., First observation of the all hadronic decay of pairs, Phys. Rev. Lett. 79 (1997) 1992.
- [12] The DØ Collaboration, V. M. Abazov et al., Measurement of the top quark mass in all-jet events, Phys. Lett. B606 (2005) 25, hep-ex/0410086.
- [13] The CDF Collaboration, A. Abulencia et al., Precision Top Quark Mass Measurement in the Lepton+Jets Topology in Collisions as TeV, Phys. Rev. Lett. 96 (2006) 022004, hep-ex/0510049.
- [14] The CDF Collaboration, A. Abulencia et al., Top Quark Mass Measurement Using the Template Method in the Lepton+Jets Channel at CDF II, Phys. Rev. D73 (2006) 032003, hep-ex/0510048.
- [15] The CDF Collaboration, A. Abulencia et al., Top Quark Mass Measurement from Dilepton Events at CDF II, submitted to Phys. Rev. Lett., hep-ex/0512070.
- [16] The CDF Collaboration, A. Abulencia et al., Measurement of the Top Quark Mass using the Template Method in the Lepton plus Jets Channel With In Situ Calibration at CDF-II, CDF Conference Note 8125.
- [17] The CDF Collaboration, D. Acosta et al., Measurement of the Top Quark Mass in the Dilepton Channel using a Matrix Element Method with 750 pb-1, CDF Conference Note 8090.
- [18] The DØ Collaboration, V.M. Abazov et al., Top Quark Mass Measurement with the Matrix Element Method in the Lepton+Jets Final State at DØ Run II, DØ-note 5053-CONF.
- [19] The DØ Collaboration, V.M. Abazov et al., Measurement of the Top Quark Mass in the Dilepton Channel, DØ-note 5032-CONF.
- [20] L. Lyons, D. Gibaut, and P. Clifford, How to combine correlated estimates of a single physical quantity, Nucl. Instrum. Meth. A270 (1988) 110.
- [21] A. Valassi, Combining correlated measurements of several different physical quantities, Nucl. Instrum. Meth. A500 (2003) 391.
- [22] The CDF Collaboration, the DØ Collaboration and the Tevatron Electroweak Working Group, Combination of CDF and DØ results on the top-quark mass, hep-ex/0404010.
- [23] The CDF Collaboration, the DØ Collaboration and the Tevatron Electroweak Working Group, Combination of CDF and DØ results on the top-quark mass, hep-ex/0507091.
- [24] H.-U. Bengtsson and T. Sjostrand, The Lund Monte Carlo for hadronic processes: PYTHIA version 4.8, Comput. Phys. Commun. 46 (1987) 43.
- [25] T. Sjostrand, High-energy physics event generation with PYTHIA 5.7 and JETSET 7.4, Comput. Phys. Commun. 82 (1994) 74.
- [26] T. Sjostrand et al., High-energy-physics event generation with PYTHIA 6.1, Comput. Phys. Commun. 135 (2001) 238, hep-ph/0010017.
- [27] F. E. Paige and S. D. Protopopescu, ISAJET: A Monte Carlo event generator for pp and interactions, BNL Reports 38034 and 38774 (1986) unpublished.
- [28] G. Marchesini et al., HERWIG: A Monte Carlo event generator for simulating hadron emission reactions with interfering gluons. Version 5.1 - April 1991, Comput. Phys. Commun. 67 (1992) 465.
- [29] G. Corcella et al., HERWIG 6: An event generator for hadron emission reactions with interfering gluons (including supersymmetric processes), JHEP 01 (2001) 010, hep-ph/0011363.
- [30] M. L. Mangano, M. Moretti, F. Piccinini, R. Pittau, and A. D. Polosa, ALPGEN, a generator for hard multiparton processes in hadronic collisions, JHEP 07 (2003) 001, hep-ph/0206293.
- [31] The Top Averaging Collaboration, L. Demortier et al., Combining the top quark mass results for Run 1 from CDF and DØ, FERMILAB-TM-2084 (1999).