Search for neutrinoless decays
and
Abstract
We have searched for neutrinoless lepton decays into or , where stands for an electron or muon, for a charged light hadron, or , and for a neutral vector meson, , and , using a 158 fb-1 data sample collected with the Belle detector at the KEKB collider. Since the number of events observed are consistent with the expected background, we set upper limits on the branching fractions in the range of for various decay modes at the 90% confidence level.
keywords:
TAU Lepton Flavor ViolationPACS:
11.30.-j , 12.60.-i , 13.35.Dx , 14.60.Fg, , , , , , , , , , , , , , , , , , , , , , , , , , , , , , , , , , , , , , , , , , , , , , , , , , , , , , , , , , , , , , , , , , , , , , , , , , , , , , , , , , , , , , , , , , , , , , , , , , , , , , , , , , , , , and
1 Introduction
In the Standard Model (SM), lepton-flavor-violating (LFV) decays of charged leptons are forbidden, or highly suppressed even if the effect of neutrino mixing is taken into account [1]. In contrast, LFV decay processes are expected to appear with much larger branching fractions than those in the SM if there are contributions from new physics. Searches for LFV decay processes may thus reveal new physics beyond the SM. Some models predict LFV decays of leptons at a level accessible at the high luminosity -factories [2, 3]. In this paper, we report on a search for LFV in fourteen decay modes into neutrinoless final states with one charged lepton and two charged pseudoscalar mesons : , , , , , , , , , , , , and , and eight modes in which decays into one lepton and one vector meson: , , , , , , and .111Charge conjugate decay modes are implied throughout the paper. Current upper bounds on the branching fractions for these decays are of the order of at 90% confidence level (CL) and have been set in the CLEO experiment using a data sample of 4.79 fb-1 [4]. Very recently CLEO results on modes were improved by the BaBar experiment and upper limits in the range were obtained from a data sample [5]. We present here results of a new search based on a data sample of 158.0 fb-1 corresponding to -pairs collected with the Belle detector [6] at the KEKB asymmetric-energy collider [7] operating at or near the resonance.
2 Event Selection
The Belle detector is a general purpose detector with excellent capabilities for precise vertex determination and particle identification. Tracking of charged particles is performed using a three-layer double-sided silicon vertex detector (SVD) and a fifty-layer cylindrical drift chamber (CDC) located in a 1.5 T magnetic field. Charged hadrons are identified by combining information from the CDC, signal pulse-heights from aerogel erenkov counters (ACC) and timing information from time-of-flight scintillation counters (TOF). Photons are reconstructed using a CsI(Tl) electromagnetic calorimeter (ECL). Muons are detected by fourteen layers of resistive plate counters interleaved with iron plates (KLM).
We use TAUOLA [8] for Monte Carlo (MC) event generation of -pair signals and KKMC [9] to implement initial and final state radiation. The KKMC MC program predicts a cross-section of at the center-of-mass energy of KEKB. We calculate the number of -pair events from the cross section and measured integrated luminosity fb-1. The MC data is processed through the Belle detector simulation program based on GEANT3 [10] to determine signal efficiencies. We use the CLEO QQ event generator [11] for hadronic events and AAFHB [12] for two-photon events, and study their contributions to the background of each decay mode.
We search for -pair events in which one decays into the (3-prong) final state. The other dominantly decays into one charged particle and any number of neutrals (1-prong) with a branching fraction of 85.35% [13]. We require that there be four charged tracks with zero net charge and any number of photons in an event. We reconstruct the trajectory of a charged track from hits in the SVD and CDC, and require that a reconstructed transverse momentum be larger than 0.1 GeV/ and polar angle be within the range 25, with respect to the direction opposite to the beam. For all charged tracks, the distance of the closest approach to the interaction point (IP) is required to be within 1 cm transversely and 3 cm along the beam. Photons are selected from neutral ECL clusters with an energy threshold 0.1 GeV and are separated by at least 30 cm from the extrapolated projection point of any charged track. The tracks and photons in an event are divided into two hemispheres in the center-of-mass system (CMS), with a plane perpendicular to the thrust axis calculated from the momenta of all charged tracks and photons. We select 3-prong vs. 1-prong topology events, i.e. three charged tracks are in one hemisphere and one charged track in the other. We define the former hemisphere as the signal side and the latter as the tag side. The number of photons on the signal side should be less than or equal to two, to allow for photons from initial and final state radiation or photons radiated from electron tracks.
Electrons are identified by an electron likelihood that includes the value measured with the CDC, the ratio of the cluster energy from the ECL to the track momentum measured with CDC, ACC hits and shower shape in ECL [14]. With this likelihood, electrons are selected with an average efficiency of 85% over the whole momentum range of those in the signal MC. The momentum of a charged track in the laboratory system should be greater than 0.3 GeV/ to avoid poorly identified electrons. In order to correct for the energy loss due to bremsstrahlung, the momentum of an electron track is recalculated adding the momentum of radiated photon clusters if an ECL cluster with energy less than 1.0 GeV is detected within a cone angle of 10∘ along the electron flight direction.
The muon likelihood is formed from two variables: the difference between the range calculated from the momentum of the particle and that measured with the KLM, as well as the value of the KLM hits with respect to the extrapolated track [15]. The average efficiency is evaluated as 90% from signal MC for muon in the momentum range for LFV decays. For muons, should be larger than 0.6 GeV/ for the same reason as in the electron case.
Tracks that do not satisfy the requirements for electron or muon candidates are classified as hadrons. To distinguish kaons from pions, we use a likelihood ratio which is calculated from , time-of-flight and the hits in the ACC. We achieve kaon efficiencies of 85% in the barrel and 80% in the endcap region. In these cases, should be larger than 0.5 GeV/. The remaining tracks are treated as pions.
Vector mesons are reconstructed in the following decay modes: , and . We calculate the vector meson mass, . We then fit the distribution of the signal MC with two Gaussian distributions to take into account the effects of the intrinsic width of the resonances and the detector resolution.
The width of the signal windows for each decay modes is , where is the standard deviation of the broader Gaussian component: 445 MeV/ 1092 MeV/, 730 MeV/ 1064 MeV/ and 1005 MeV/ MeV/.
The background that remains after applying all the selection criteria based on event topology and particle identification is dominated by Bhabha events. This background is effectively reduced by requiring the invariant masses calculated for all combinations of two oppositely charged tracks to be greater than 0.2 GeV, assuming the electron mass.
Backgrounds from and events are suppressed by the selection criteria listed above, however the background from continuum events with the light quarks , and ( continuum) is not negligible. Since these backgrounds often include decays, we require that the number of photons on the tag side not exceed 1. If the tag is an electron or muon, the requirement effectively suppresses the continuum background. For tags where the tag side is a pion, the selected events are investigated further as follows.
We measure the flight length using information on IP and vertex position that is reconstructed from the tracks on the signal side. Since leptons travel significant distance before decaying (m), this feature can be used to suppress background. Since -pair events have a more jet-like shape than continuum events and are distinguishable by use of shape variables. We use a normalized second Fox-Wolfram moment [16] to represent the event shape. Figure 1 shows the and distributions for -pair and continuum events. We calculate the two-dimensional probability density function (PDF) in the vs. plane, and form a likelihood ratio , where and are the PDFs for -pair signal and continuum background, respectively.
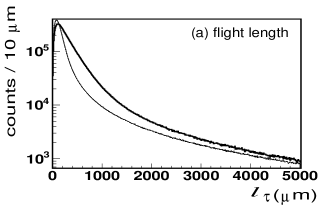
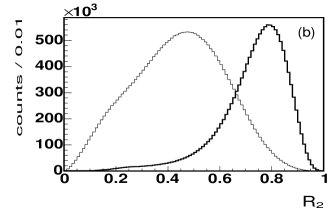
The condition is optimized using MC. This condition removes 60% of continuum background, while 90% of the signal is kept when the track on the tag side is a pion. After combination of all selections including the and likelihood ratio requirements, the continuum background is suppressed by a factor of .
We calculate the missing four-momentum for each event. In signal events, it is possible to reconstruct a mass from the missing momentum, 1-prong charged track momentum and all momenta of photons on the tag side, since there is no neutrino emission from the signal decays. Figure 2 shows the distributions of the mass on the tag side for the signal events and continuum background MC. There is a clear peak at the mass in the signal distribution, while the distribution for background process is smooth.
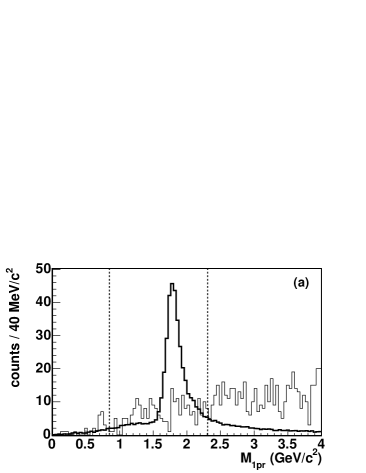
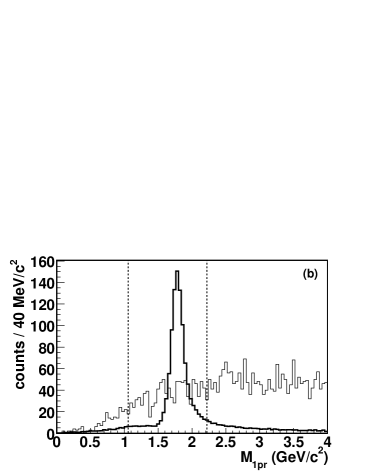
Comparing the yield of these distributions, we optimize the central value and width of the signal windows independently for electron and muon modes: 0.85 GeV 2.31 GeV for the and modes, and 1.06 GeV 2.22 GeV for the and modes.
To identify signal decays, we reconstruct the invariant mass and CMS energy of selected events. We then calculate the energy difference and mass difference , where is the beam CMS energy and is the nominal mass. The signal events should have and around zero. We define the signal region in the - plane using the signal MC. Signal MC distributions have tails on the lower sides of and due to effects from initial and final state radiation, bremsstrahlung of electrons and ECL energy leakage. We consider signal MC events as properly reconstructed if they satisfy the conditions GeV 0.32 GeV and GeV/ 0.25 GeV/. We thus define a rectangular signal region that contains 90% of properly reconstructed signal events. The boundaries of the signal region are summarized in Table 1.
| Mode | (GeV) | (GeV/) |
|---|---|---|
| - +0.04 | - +0.011 | |
| - +0.04 | - +0.011 | |
| - +0.03 | - +0.011 | |
| - +0.03 | - +0.011 | |
| - +0.04 | - +0.011 | |
| - +0.04 | - +0.010 | |
| - +0.04 | - +0.010 | |
| - +0.04 | - +0.008 | |
| - +0.04 | - +0.009 | |
| - +0.03 | - +0.009 | |
| - +0.03 | - +0.009 | |
| - +0.03 | - +0.009 | |
| - +0.03 | - +0.008 | |
| - +0.03 | - +0.007 | |
| - +0.04 | - +0.012 | |
| - +0.04 | - +0.011 | |
| - +0.04 | - +0.010 | |
| - +0.03 | - +0.008 | |
| - +0.03 | - +0.011 | |
| - +0.03 | - +0.010 | |
| - +0.03 | - +0.009 | |
| - +0.03 | - +0.007 |
3 Results
The signal MC events are generated assuming a uniform decay angular distribution of . Signal detection efficiencies , evaluated from the MC, are listed in the fourth column of Table 2 and vary from 2.68% to 5.30%. The actual decay angle distribution, however, depends on the model for the LFV interaction. In order to evaluate the possible effect of correlations, we examine and interactions using the formulae given in Ref. [17] and the relative differences in the efficiencies from the uniform distribution () are taken as systematic errors of detection efficiencies.
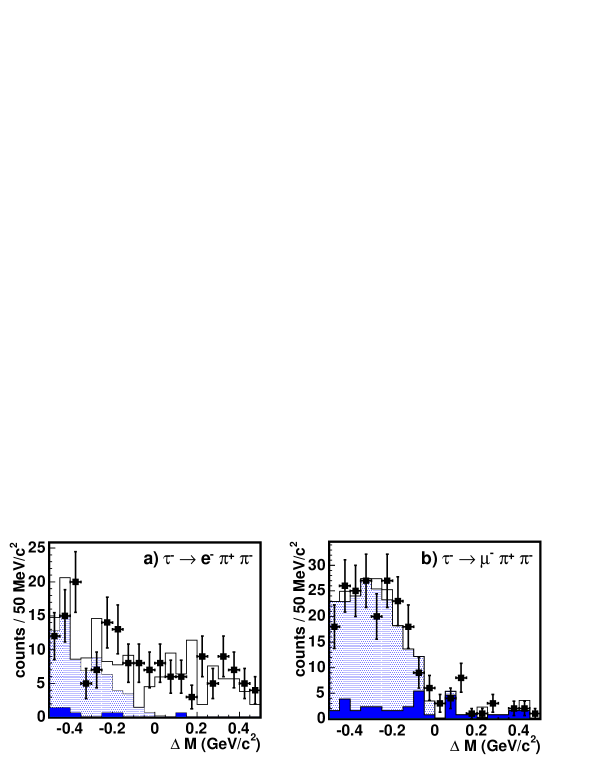
After all selection requirements, some events remain in the signal region. From MC, we evaluate the number of background events from continuum and -pair production. We then scale to the data by the factor , where is the cross section of this process, and is the number of generated events of the process. In the and modes, there is a contribution from two-photon , , , and processes. Since the equivalent luminosity for the MC simulation of two-photon processes is much smaller than , the contribution of the two-photon processes is estimated from a fit to the data in the sideband region, in which the contributions of continuum and -pair are fixed from MC and the two-photon shape is taken from MC with the normalization floated. For all modes the sideband region is , while the signal region is blinded. The shape of the distribution is obtained after applying only the particle identification requirements. We verify that this shape does not change when additional selection criteria are applied by comparing the distribution before all selections and after each of them is successively imposed. It is known that separation is different for data and MC. We measure identification efficiency and fake rate for both of them using calibration samples obtained from decays and apply a correction to the MC distributions. The distributions of data and expected background for the and modes after the corrections are shown in Figure 3. The number of expected background events in the signal region for each studied decay mode is given in the fifth column of Table 2. The uncertainty in the background expectation is dominated by MC statistics.
| Mode | (%) | Detection | Expected | Observed | Upper limit on | |
|---|---|---|---|---|---|---|
| LFV | Total | efficiency (%) | background | events | BF (90% CL) | |
| 5.3 | 7.5 | 5.30 | 2.621.07 | 6 | 7.3 | |
| 2.3 | 5.8 | 5.14 | 0.000.26 | 1 | 2.0 | |
| 2.1 | 8.8 | 4.37 | 0.760.26 | 2 | 4.8 | |
| 7.7 | 11.5 | 4.44 | 0.730.30 | 1 | 3.4 | |
| 20.5 | 21.2 | 3.99 | 0.910.25 | 3 | 7.2 | |
| 17.4 | 18.2 | 4.11 | 1.270.41 | 0 | 1.6 | |
| 12.8 | 13.9 | 4.03 | 0.740.22 | 0 | 1.9 | |
| 21.9 | 22.5 | 3.12 | 0.340.20 | 0 | 3.0 | |
| 5.4 | 7.6 | 3.06 | 0.090.07 | 0 | 3.1 | |
| 15.8 | 18.0 | 3.43 | 2.350.44 | 1 | 2.7 | |
| 19.1 | 20.9 | 3.32 | 1.850.32 | 3 | 7.3 | |
| 25.4 | 26.8 | 3.53 | 2.530.38 | 1 | 2.9 | |
| 8.7 | 12.2 | 2.76 | 0.480.19 | 2 | 8.0 | |
| 38.2 | 39.2 | 2.70 | 0.090.06 | 0 | 4.4 | |
| 5.3 | 7.5 | 5.03 | 2.551.04 | 5 | 6.5 | |
| 17.4 | 18.2 | 4.12 | 0.760.34 | 0 | 3.0 | |
| 20.5 | 21.2 | 3.68 | 0.160.10 | 0 | 4.0 | |
| 21.9 | 22.5 | 2.94 | 0.040.04 | 0 | 7.3 | |
| 2.1 | 8.8 | 4.40 | 0.260.12 | 0 | 2.0 | |
| 19.1 | 20.9 | 3.61 | 0.370.14 | 0 | 3.9 | |
| 15.8 | 18.0 | 3.42 | 0.490.19 | 0 | 4.0 | |
| 8.7 | 12.2 | 2.68 | 0.000.18 | 0 | 7.7 | |
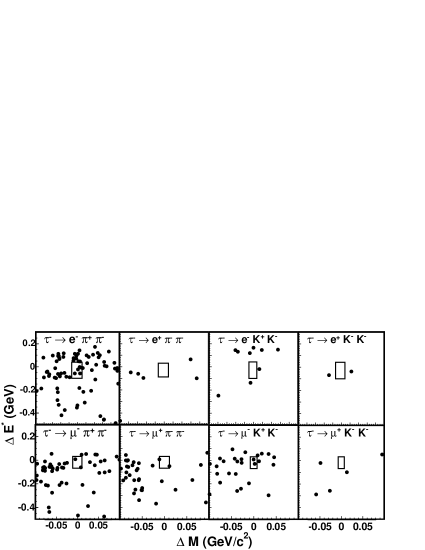
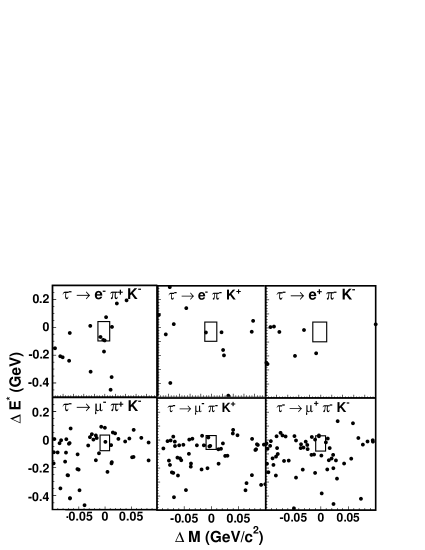
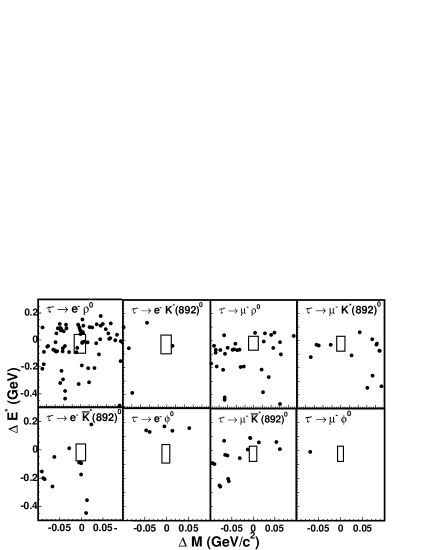
The vs. plots for the experimental data for all decay modes are shown in Figure 4. The numbers of events observed in the signal regions are listed in the sixth column of Table 2. They are consistent with those expected from background distributions. We set the upper limits on the number of the signal events at 90% CL using the prescription of Feldman and Cousins [18]. The main systematic uncertainties on the detection efficiency come from track reconstruction (1.0% per track), electron identification (1.1% per electron), muon identification (5.4% per muon), kaon/pion separation (1.0% per kaon and pion), trigger efficiency (1.4%), statistics of the signal MC (1.0%) and uncertainties of the branching fractions of vector meson decays (1.2% for ). The uncertainty on the number of -pair events mainly comes from the luminosity measurement (1.4%). The systematic uncertainties due to the angular distribution of LFV decays are summarized in the second column of Table 2, together with the total systematic errors , which are used to evaluate the total errors of the sensitivities. To evaluate , we use the Poisson probability density function, which is convolved with the uncertainties on the sensitivities and expected background assuming the Gaussian shape [19, 20].
Upper limits on the branching fractions are calculated as and , where is the total number of the -pairs produced, is the inclusive branching fraction for the 1-prong decay of and is the branching fraction of vector meson decay into charged hadrons. We use and from the 2005 web update of Ref. [13]. The resulting upper limits on the branching fractions are summarized in the last column of Table 2.
4 Discussion
Our final results for 90% upper limits on the branching fractions for the modes, shown in Table 2, are in the range . Our results for and modes are one order of magnitude more restrictive than those obtained in the CLEO experiment [4] except for a few decay modes. The results for modes are comparable to those from BaBar [5].
While in many extensions of the Standard Model the predicted values of the branching fractions of LFV decays are very small and out of reach for current experiments, some models allow enhancements of such decays to a level very close to the experimentally accessible range at the factories. For example, detailed analysis of various LFV lepton decays in the framework of MSSM show that at small and appropriate values of other model parameters the branching ratio of the decay can be as high as [21].
The improved sensitivity to rare lepton decays achieved in this work can be used to constrain the parameters of models with heavy Dirac neutrinos [3]. In this model the expected branching fractions of various LFV decays are evaluated in terms of combinations of the model parameters. These combinations, denoted and for decays involving an electron and a muon, respectively, can vary from 0 to 1. Our best 90% upper limit for the modes with an electron, , can be set from the decay. The best corresponding limit for modes with a muon studied in this work is set from the mode, . This bound is more restrictive than any other limits set on LFV decays of the .
Our results can also be used to constrain energy scale of new physics in models with dimension-six effective fermionic operators that induce mixing [22]. From our upper limits for the branching fractions of , and the bounds TeV, TeV and TeV, respectively, can be obtained for the models with vector operators.
5 Summary
We have searched for LFV decays and using a 158.0 fb-1
( -pair events) data sample in the Belle experiment.
No evidence for a signal of these decay
modes is observed and upper limits on the branching fractions are set in the range
, which are one order of magnitude more restrictive than
those previously obtained by the CLEO experiment. For modes, the
results are comparable to recent limits from BaBar [5].
We thank the KEKB group for the excellent operation of the
accelerator, the KEK cryogenics group for the efficient
operation of the solenoid, and the KEK computer group and
the National Institute of Informatics for valuable computing
and Super-SINET network support. We acknowledge support from
the Ministry of Education, Culture, Sports, Science, and
Technology of Japan and the Japan Society for the Promotion
of Science; the Australian Research Council and the
Australian Department of Education, Science and Training;
the National Science Foundation of China and the Knowledge Innovation Program of Chinese Academy of Sciencies under contract No. 10575109 and IHEP-U-503; the Department of Science and Technology of
India; the BK21 program of the Ministry of Education of
Korea, and the CHEP SRC program and Basic Research program
(grant No. R01-2005-000-10089-0) of the Korea Science and
Engineering Foundation; the Polish State Committee for
Scientific Research under contract No. 2P03B 01324; the
Ministry of Science and Technology of the Russian
Federation; the Slovenian Research Agency; the Swiss National Science Foundation; the National Science Council and
the Ministry of Education of Taiwan; and the U.S.
Department of Energy.
References
- [1] W.J. Marciano and A.I. Sanda, Phys. Lett. B 67, 303 (1977); B.W. Lee and R.E. Shrock, Phys. Rev. D 16, 1444 (1977); T.P. Cheng and L.F. Li, Phys. Rev. D 16, 1425 (1977).
- [2] A. Ilakovac, Phys. Rev. D 54, 5653 (1996).
- [3] A. Ilakovac, Phys. Rev. D 62, 036010 (2000).
- [4] D.W. Bliss et al. (CLEO Collaboration), Phys. Rev. D 57, 5903 (1998).
- [5] B.Aubert et al. (BaBar Collaboration), Phys. Rev. Lett. 95, 191801 (2005).
- [6] A. Abashian et al. (Belle Collaboration), Nucl. Instr. and Meth. A 479, 117 (2002).
- [7] S. Kurokawa and E. Kikutani, Nucl. Instr. and Meth. A 499, 1 (2003), and other papers included in this Volume.
- [8] KORALB(v2.4)TAUOLA(v2.6); S. Jadach and Z. Wa̧s, Comp. Phys. Commun. 85, 453 (1995); ibid, 64, 267 (1991); S. Jadach, Z.Wa̧s, R. Decker, and J.H.Kühn, Comp. Phys. Commun. 76, 361 (1993); ibid, 70, 69 (1992); ibid, 64, 275 (1991); E. Barberio and Z. Was, Comp. Phys. Commun. 64, 275 (1990).
- [9] S. Jadach, B.F.L. Ward, Z. Wa̧s, Comp. Phys. Commun. 130 260 (2000).
- [10] R. Brun et al., GEANT 3.21, CERN Report DD/EE/84-1, 1984.
- [11] see httpwww.lns.cornell.edupublicCLEOsoftQQ.
- [12] F.A. Berends, P.H. Daverveldt, and R. Kleiss, Comp. Phys. Commun. 40, 285 (1986).
- [13] S. Eidelman et al. (Particle Data Group), Phys. Lett. B 592, 1 (2004).
- [14] K. Hanagaki et al., Nucl. Instr. and Meth. A 485, 490 (2002).
- [15] A. Abashian et al., Nucl. Instr. and Meth. A 491, 69 (2002).
- [16] G. C. Fox and S. Wolfram, Phys. Rev. Lett. 41, 1581 (1978).
- [17] R. Kitano and Y. Okada, Phys. Rev. D 63, 113003 (2001).
- [18] G.J. Feldman and R.D. Cousins, Phys. Rev. D 57, 3873 (1998).
- [19] R.D. Cousins and V.L Highland, Nucl. Instr. and Meth. A 320, 331 (1992) .
- [20] J. Conrad, O. Botner, A. Hallgren and Carlos P. de los Heros, Phys. Rev. D 67, 012002 (2003).
- [21] A. Brignole and A. Rossi, Nucl. Phys. B 701, 3 (2004).
- [22] D. Black et al., Phys. Rev. D 66, 053002 (2002).