Determining the upper limit of for the
Abstract
By fitting the values between 3.7 and 5.0 GeV measured by the BES collaboration, the upper limit of the electron width of the newly discovered resonance is determined to be 580 eV/ at 90% C.L. Together with the BaBar measurement on , this implies a large decay width of final states.
1 Introduction
Recently, in studying the initial state radiation events, (: initial state radiation photon) with 233 fb-1 data collected around GeV, the BaBar Collaboration observed an accumulation of events near 4.26 GeV/ in the invariant-mass spectrum of [1]. The fit to the mass distribution yields events with a mass of MeV/ and a width of MeV/. In addition, the following product is calculated
| (1) |
Since the resonance is produced in initial state radiation from collision, its quantum number . However, this new resonance seems rather different from the known charmonium states with in the same mass scale, such as , , and . Being well above the threshold, instead of decaying predominantly into final states, the shows strong coupling to the final state. So this new resonance does not seem to be a usual charmonium state. The strange properties exhibited by the have triggered many theoretical discussions [2]-[12].
One suggestion is that the is the first orbital excitation of a diquark-antidiquark state () [2, 3]. By virtue of this scheme, the mass of such a state is estimated to be 4.28 GeV/, which is in good agreement with the observation. A crucial prediction of the scheme is that the decays predominantly into .
Another opinion favors a hybrid explanation [4, 5, 6, 7]. In the light of the lattice inspired flux-tube model, the calculation shows that the decays of hybrid meson are suppressed to pairs of ground state conventional mesons [13, 14]. This implies that decays of into , , and are suppressed whereas and are small, and , if above threshold, would dominate (-wave charmonia are denoted by ). So it is interesting to search for the possible decay of .
The third interpretation we wish to mention is provided by Ref. [8], which suggests that the is the second most massive state in the charmonium family. The author ascribes the lack of in hadrons to the interference of - waves, and also estimates
| (2) |
Besides the above interpretations, there are other kinds of proposals. The lattice study in Ref. [9] suggests that the behaves like a molecule. In Ref. [10], it is proposed that the new state might be a baryonium, containing charms, configured as -. In Ref. [11], the is considered as a - molecule while in Ref. [12], the is considered as an - molecule. However, all aforementioned speculations need further experimental judgment.
Most recently, CLEOc collected 13.2 pb-1 data at GeV and investigated 16 decay modes with charmonium or light hadrons [15], and the channels with more than 3 statistical significance are (11), (5.1), and (3.7). No compelling evidence is found for any other decay modes for the , nor for the and resonances [15]. These measurements disfavor the - molecular model [11], baryonium model [10], and high charmonium state explanation [8]. So far as other surviving speculations are concerned, such as charmonium hybrid [4, 5, 6, 7], tetraqark model [2, 3], molecule suggestion, and - molecule explanation [12], further experimental studies are needed to make more definitive conclusions.
Since the was observed in annihilation, it is expected that it contributes to the total hadronic cross section in annihilation (or the value, in other words). The most recent such data on measurements are from the BES experiment [18, 19], as shown in Fig. 1 for from 3.7 to 5.0 GeV. If we look in detail within the range from 4.25 to 4.30 GeV (refer to the inset of Fig. 1), it seems there is a bump around 4.27 GeV. Has this structure a connection with the ? We try to answer this question in this Letter. As there are other resonances nearby, we shall fit the full spectrum between 3.7 to 5.0 GeV in order to get the information on the .

2 Fit to the -resonances
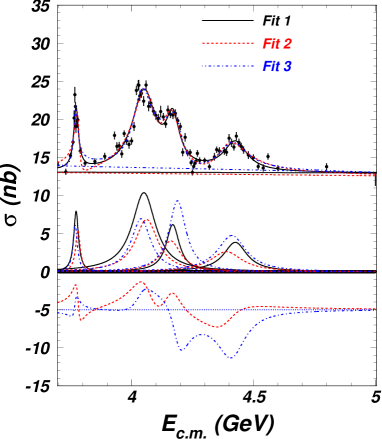
The values [18, 19] used in this analysis were measured with the Beijing Spectrometer (BESII), which is a conventional solenoidal detector expounded in Ref. [16]. In the analysis below, the values are converted into a cross section by multiplying the Born order cross section of . These cross sections are plotted in Fig. 2. There are clear peaks of , , , and . The data points have been used to obtained the parameters of the -resonances [17].
To acquire the resonance parameters, we could simply fit the data set with cross section formula, each resonance with a Breit-Wigner
| (3) |
where , , and are the mass independent electronic, hadronic and total widths, respectively, for a vector resonance of mass produced in the head-on collision of and . Notice that in our analysis; the approximation is actually adopted hereinafter. The summation of all the cross sections within the range we are studying is
| (4) |
where indices , , , and denote four resonances , , , and , respectively.
In the -family resonance region, if we assume that all two-body states are decay products of resonance, and not produced directly in continuum, we could therefore treat resonance and continuum incoherently. Nevertheless, for the four wide resonances, they are close and are expected to have some same decay final states, there must be interference between any two of the resonances. Therefore the amplitudes corresponding to each resonance, with the following form
| (5) |
have to be added coherently to give the total amplitude that, once squared, will contain interferences of the type . If the resonances are quite broad, the interference effect can also distort the resonance shape, the width might appear broader or narrower, and the position of the peak can be displaced as well. In this case, the total cross section is
| (6) |
where is given in Eq. (5).
So far as the amplitude is concerned, in principle, there are presumably relative phases between different amplitudes besides the phase due to complex Breit-Wigner formula itself. So a more comprehensive total cross section would be the summation of amplitudes together with an additional phase, viz.
| (7) |
Since what we actually obtain is the squared modulus of amplitudes, only three relative phases could be detected in practice.
The standard chi-square estimator is constructed as follows
| (8) |
where indicates the experimentally measured cross section at the -th energy point, while is the corresponding theoretical expectation at this energy point, which is composed of two parts
| (9) |
where denotes the contribution from continuum. Since there is little evidence in the data for any substantial variation of the continuum background within the studied energy region, we parameterize the continuum cross section with a linear function
| (10) |
as has been used in Ref. [17]. Here we consider the continuum contribution as the background for measurement of resonance parameters, that is .
In Eq. (9) denotes the contribution from resonances. The fit results are displayed in Fig. 2 where Fit 1, Fit 2, and Fit 3 correspond to the three cross section forms , , and , as expressed in Eqs. (4), (6), and (7), respectively. Although the synthetic curves for three fits are almost the same, as we expected, the interference effect deforms each resonance significantly, according to Fig. 2, and become narrower while and become wider when interference effects are included. There exist constructive interferences as well as destructive ones, and the interference behaviors for amplitudes with and without extra phases are also very distinct. The fit results indicate that is very sensitive to the fit strategy, and the largest difference between various amalgamation strategies could reach 50%.
Since , , , and have similar decay features, that is, all decay dominantly to final states, we prefer the synthetic scheme of amplitude with phase which takes into account all possible interactions between resonances.
So far as the is concerned, the study of the BaBar Collaboration [1] implies that this new state may not be a common charmonium state, whose decay feature is rather distinctive from other -family members, and this also obtains support from recent CLEOc measurements [15]. So it is favorable to perform the incoherent addition for the contribution of the to the total cross sections in Eqs. (4), (6), or (7).
In addition, two other effects should be taken into account. First, there are theoretical arguments in some references [3, 4, 5, 6] that the may be due to a threshold effect just as the , so the width of the could be energy dependent as follows:
| (11) |
Here the subscript “” explicitly denotes the threshold effect, , is the classical interaction radius, is the momentum,
and is the momentum at resonance peak, viz.
Second, the has been observed decaying into the final state and this kind of decay can be expressed by the amplitude with the form of Eq. (5) which is different from that of the decay into with threshold effect. Furthermore, although the present data display the distinctive feature of the from other charmonium resonances, some connections presumably exist which could lead to the interference effects of the with other -family members. With all these considerations in mind, we split the amplitude of the into two parts. One is the amplitude of the threshold part, which is defined as follows:
| (12) |
where the total decay width is defined as the summation of two parts :
Here the first term is the energy dependent partial decay width for the threshold part while the second term is the energy independent partial decay width for the non-threshold part (denoted by ). We introduce a factor to indicate the ratio of to at the resonance peak, that is
Notice the energy independence of , we have , then
In this case, the amplitude of the non-threshold part is given by the following expression
| (13) |
Without the knowledge of , we first set in the study in Sect. 3 and leave the variation effect of to Sect. 4.
By virtue of the above discussion, the synthetic cross section within the region studied takes the following form
| (14) |
Under such a scheme, the upper limit of the production of the in annihilation is determined, as expounded in the following section.
3 Determination of of the
Various fits to the data tell us that with limited knowledge on the nature of the resonances and comparatively meager data, we could only determine the of the by a scan method. Specifically, we fix the mass of the at 4.259 GeV/ measured by the BaBar Collaboration [1], and scan over the MeV/ (8 MeV/ step) and eV/ (10 eV/ step) parameter space. In order to avoid some grotesque fit results due to random effect of the on the resonances nearby, in the scan procedure, the lower and upper bounds of the masses (total widths) are fixed to be 4100 and 4220 MeV/ (30 and 250 MeV/) and 4350 and 4500 MeV/ (30 and 300 MeV/) for and , respectively.
For each pair of eV/) and MeV/), fitting the data with the determined from Eq. (8), we obtain a best estimated as a function of the and , or equivalently a relative likelihood, viz.
| (15) |
Instead of using this directly, we further construct a weighted likelihood as follows
| (16) |
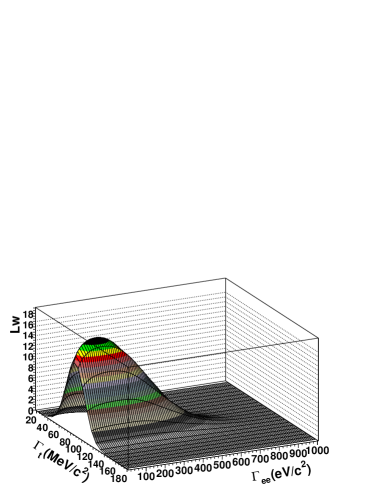
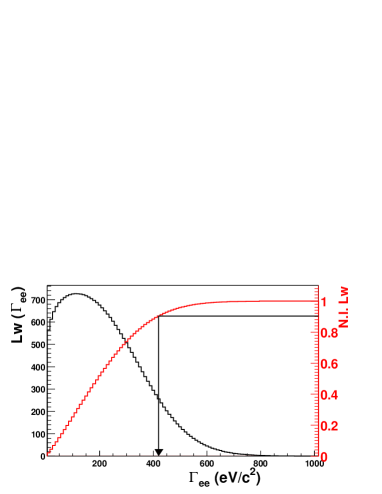
where is an arbitrary normalization factor and the Gaussian term indicates that the possible total width () of the is considered to distribute as a Gaussian with the mean value MeV/ and the standard deviation MeV/, which have been determined by the BaBar Collaboration [1]. The weighted likelihood () as a function of the and of the is shown in Fig. 3(a). Summing with respect to , we obtain the variation of versus as shown in Fig. 3(b). The integral of the likelihood curve gives the upper limit of of the at 90% confidence level (C.L.):
| (17) |
(a) w.r.t. v.s.
(b) w.r.t.
By virtue of Fig. 3(a), we sum up with respect to to 90% fraction of the total area then obtain the upper limit of at 90% C.L. for each . So we obtain the variation of the upper limit of versus as shown in Fig. 4. All the points are almost in a straight line, which indicates the ratio of the two quantities, or the upper limit of the branching fraction of does not depend on the total width. Taking the slope of the solid line in Fig. 4, we get
at 90% C.L.

4 Other possibilities
Although it is reasonable to treat all the -resonances coherently as we once mentioned in Sect. 2, one may argue that other possibilities could exist since there is limited information about the properties of these -resonances. Thereby it’s better to take a variety of effects into consideration.
First, there are three schemes for summation of resonances in this analysis: through cross sections, amplitudes, or amplitudes together with relative phases, as discussed in Sect. 2, the corresponding results are , , eV at 90% C.L. respectively, where the last one has been given in the previous section.
Second, we consider the effect of different background shapes in the fit. In Sect. 2, we adopt the first order polynomial to depict the background, nevertheless, higher order polynomial can be used to delineate the background as well.
In addition, we notice one background shape once adopted by DASP group, who tried to take into account the threshold effect of the charmed mesons [20],
| (18) |
with
| (19) |
where describes the contribution from continuum; ranging from 1 to 6 indicates the , , , , , thresholds, respectively. are free parameters111 It should be noticed that since the threshold has been taken into account in description of the , the parameter is set to be zero in the corresponding fit.; are the velocities of the relevant particles; and is a oversimplified form factor defined above.
The fit results show that the effect of polynomial background is at the same level with or smaller than that of the DASP background, so as an estimation, we adopt the linear and the DASP backgrounds as two typical cases for background description. Comparing with those of linear background fit, the results of DASP background fit for three summation schemes of resonances are , , eV at 90% C.L. respectively,
Last, we also consider the possible effect of the fraction on the measured of the . Our fits indicate that with the increasing of factor the upper limit of decreases and . The upper limit for varies from to eV when changes from to .
Taking all the aforementioned possibilities into account, we adopt the most conservative result as our final estimation, that is
| (20) |
at 90% C.L.
5 Discussion
According to our study, the conservative estimation for the upper limit of of the is about 580 eV/ at 90% C.L., which is almost two times larger than the estimation presented in Eq. (2).
Utilizing our upper limit eV/ for the , together with the relation of Eq. (1), we obtain the lower limit of the branching fraction at 90% C.L. to be
This means that the partial width keV/ at 90% C.L., which is much larger than the corresponding partial widths of (89.1 keV/) [21] and (44.6 keV/) [21, 22].
CLEOc measured the cross section for channel to be 58 pb-1 [15], which is consistent with the BaBar result, 50 pb-1 [1]. As an estimation, we regard the central value calculated in Eq. (1) to be the same for CLEOc and BaBar, but adopt the improved accuracy provided by CLEOc, then we can obtain the following lower limits at 90% C.L.
and
where denotes (37), (8), (3), (5), (1), (0), (0), and (1). Here the numbers of the observed events by CLEOc are presented in parentheses.
As we notice up to now only results on hidden-charm final states were reported about the ; measurements involving open-charm are anxiously awaited to confirm existing speculations or provide clues for further theoretical inquiry. In addition, more accurate is still needed for a better understanding of the nature of the .
Acknowledgments
We would like to thank Dr. H.B. Li for friendly discussion.
References
- [1] BaBar Collaboration, B. Aubert et al., Phys. Rev. Lett. 95 (2005) 142001.
- [2] D. Ebert, R.N. Faustov, and V.O. Galkin, hep-ph/0512230. Phys. Lett. B 634 (2006) 214.
- [3] L. Maiani et al., Phys. Rev. D 72 (2005) 031502.
- [4] S.L. Zhu, Phys. Lett. B 625 (2005) 212.
- [5] E. Kou and O. Pene, Phys. Lett. B 631 (2005) 164.
- [6] F.E. Close and P.R. Page, Phys. Lett. B 628 (2005) 215.
- [7] X.Q. Luo and Y. Liu, hep-lat/0512044.
- [8] F. J. Llanes-Estrada, Phys. Rev. D 72 (2005) 031503.
- [9] T.-W. Chiu and T.H. Hsieh (TWQCD Collaboration), Phys. Rev. D 73 (2006) 094510.
- [10] C.F. Qiao, hep-ph/0510228.
- [11] X. Liu, X.Q. Zeng and X. Q. Li, Phys. Rev. D 72 (2005) 054023.
- [12] C.Z. Yuan, P. Wang and X.H. Mo, Phys. Lett. B 634 (2006) 399.
- [13] N. Isgur and J. Paton, Phys. Rev. D 31 (1985) 2910; N. Isgur, R. Kokoski and J. Paton, Phys. Rev. Lett. 54 (1985) 869.
- [14] F.E. Close and P.R. Page, Nucl. Phys. B 443 (1995) 233.
- [15] CLEO Collaboration, T.E. Coan et al., Phys. Rev. Lett. 96 (2006) 162003.
- [16] BES Collaboration, J. Z. Bai et al., Nucl. Instrum. Methods A 344 (1994) 319; Nucl. Instrum. Methods A 458 (2001) 627.
- [17] K.K. Seth, Phys. Rev. D 72 (2005) 017501.
- [18] BES Collaboration, J. Z. Bai et al., Phys. Rev. Lett. 84 (2000) 594.
- [19] BES Collaboration, J. Z. Bai et al., Phys. Rev. Lett. 88 (2002) 101802.
- [20] DASP Collaboration, R. Brandelik et al., Phys. Lett. B 76 (1978) 361.
- [21] Particle Data Group, S. Eidelman et al., Phys. Lett. B 592 (2004) 1.
- [22] CLEO Collaboration, N.E. Adam et al., Phys. Rev. Lett. 96 (2006) 082004.