T. E. Coan
Y. S. Gao
F. Liu
Southern Methodist University, Dallas, Texas 75275
M. Artuso
S. Blusk
J. Butt
J. Li
N. Menaa
R. Mountain
S. Nisar
K. Randrianarivony
R. Redjimi
R. Sia
T. Skwarnicki
S. Stone
J. C. Wang
K. Zhang
Syracuse University, Syracuse, New York 13244
S. E. Csorna
Vanderbilt University, Nashville, Tennessee 37235
G. Bonvicini
D. Cinabro
M. Dubrovin
A. Lincoln
Wayne State University, Detroit, Michigan 48202
D. M. Asner
K. W. Edwards
Carleton University, Ottawa, Ontario, Canada K1S 5B6
R. A. Briere
I. Brock
Current address: Universität Bonn, Nussallee 12, D-53115 Bonn
J. Chen
T. Ferguson
G. Tatishvili
H. Vogel
M. E. Watkins
Carnegie Mellon University, Pittsburgh, Pennsylvania 15213
J. L. Rosner
Enrico Fermi Institute, University of
Chicago, Chicago, Illinois 60637
N. E. Adam
J. P. Alexander
K. Berkelman
D. G. Cassel
J. E. Duboscq
K. M. Ecklund
R. Ehrlich
L. Fields
R. S. Galik
L. Gibbons
R. Gray
S. W. Gray
D. L. Hartill
B. K. Heltsley
D. Hertz
C. D. Jones
J. Kandaswamy
D. L. Kreinick
V. E. Kuznetsov
H. Mahlke-Krüger
T. O. Meyer
P. U. E. Onyisi
J. R. Patterson
D. Peterson
E. A. Phillips
J. Pivarski
D. Riley
A. Ryd
A. J. Sadoff
H. Schwarthoff
X. Shi
S. Stroiney
W. M. Sun
T. Wilksen
M. Weinberger
Cornell University, Ithaca, New York 14853
S. B. Athar
P. Avery
L. Breva-Newell
R. Patel
V. Potlia
H. Stoeck
J. Yelton
University of Florida, Gainesville, Florida 32611
P. Rubin
George Mason University, Fairfax, Virginia 22030
C. Cawlfield
B. I. Eisenstein
I. Karliner
D. Kim
N. Lowrey
P. Naik
C. Sedlack
M. Selen
E. J. White
J. Wiss
University of Illinois, Urbana-Champaign, Illinois 61801
M. R. Shepherd
Indiana University, Bloomington, Indiana 47405
D. Besson
University of Kansas, Lawrence, Kansas 66045
T. K. Pedlar
Luther College, Decorah, Iowa 52101
D. Cronin-Hennessy
K. Y. Gao
D. T. Gong
J. Hietala
Y. Kubota
T. Klein
B. W. Lang
R. Poling
A. W. Scott
A. Smith
University of Minnesota, Minneapolis, Minnesota 55455
S. Dobbs
Z. Metreveli
K. K. Seth
A. Tomaradze
P. Zweber
Northwestern University, Evanston, Illinois 60208
J. Ernst
State University of New York at Albany, Albany, New York 12222
H. Severini
University of Oklahoma, Norman, Oklahoma 73019
S. A. Dytman
W. Love
V. Savinov
University of Pittsburgh, Pittsburgh, Pennsylvania 15260
O. Aquines
Z. Li
A. Lopez
S. Mehrabyan
H. Mendez
J. Ramirez
University of Puerto Rico, Mayaguez, Puerto Rico 00681
G. S. Huang
D. H. Miller
V. Pavlunin
B. Sanghi
I. P. J. Shipsey
B. Xin
Purdue University, West Lafayette, Indiana 47907
G. S. Adams
M. Anderson
J. P. Cummings
I. Danko
J. Napolitano
Rensselaer Polytechnic Institute, Troy, New York 12180
Q. He
J. Insler
H. Muramatsu
C. S. Park
E. H. Thorndike
University of Rochester, Rochester, New York 14627
(February 20, 2006)
Abstract
Using data collected with the CLEO detector operating at the
CESR collider at -,
we investigate 15 charmonium decay modes of the
, , and resonances. We confirm,
at 11 significance,
the BaBar discovery,
make the first observation of
(), and find the first
evidence for ().
We measure cross-sections at
as =,
=, and
=, in which the
uncertainties are statistical and systematic, respectively.
Upper limits are placed on other decay rates
from all three resonances.
pacs:
14.40.Gx,13.25.Gv
††preprint: CLNS 06/1952††preprint: CLEO 06-02
The region at center-of-mass energies
above charmonium open-flavor production threshold
is of great interest to theory due to its richness
of states, the properties of which are
not well-understood. Prominent structures
in the hadronic cross-section are the
, the , and the PDG .
Their main characteristics are large total widths,
two orders of magnitude larger than for the
lower-lying states of , and
weaker couplings to leptons than the and .
Decays to closed-charm final states are not favored
due to the availability of open-charm channels.
Recently, observations of new charmonium-like states in
the same energy region
have been reported homelessmesons .
Most of these have been observed to decay through open charm.
However, an enhancement in the invariant mass spectrum of
the closed-charm final state
has also been observed by BaBar
in initial state radiation (ISR),
BaBar4260ISR .
A weaker signal was observed in
the decay BaBar4260BDecay .
The observed lineshape can be described by a single
resonance, termed , of mass ,
width , and
coupling
. It is located
quite unexpectedly at a local minimum of the hadronic cross-section.
Since it is observed in ISR, the new state must have
, and
therefore it can be studied directly in collisions at threshold.
No other evidence for a resonance at this mass
has been identified BaBarppbar , leaving the existence
and possible charmonium-like nature of this
state
uncertain.
Many interpretations have been
suggested;
to be compatible with the absence of a corresponding
enhancement in open charm production,
most favor an unconventional explanation of ,
such as hybrid charmonium ClosePage ; hybrids ,
tetraquarks Ebert ; Maiani ; TWQCD ,
or hadronic molecules LZL ; Qiao ; WMY .
One proposal Estrada argues that is conventional:
It identifies with the vector state,
and relies upon interference effects
to produce the dip in open-charm cross-section
and a hypothesized large coupling to of the ,
commonly associated with the .
To further clarify the nature of , investigation of
both open and closed charm is necessary.
Here, we report production cross-sections measurements
of 16 final states containing a
, , , or ,
in the , , and energy region,
motivated by the range of experimental tests suggested so
far ClosePage ; hybrids ; Ebert ; Maiani ; TWQCD ; LZL ; Qiao ; WMY ; Estrada .
We use data taken during a scan of center-of-mass energies
3.97-4.26 GeV, complementing
a sample
of an integrated luminosity
at
previously acquired.
Collisions were registered with the CLEO detector CLEO at the
CESR collider CESR .
The scan data naturally separate into three regions:
the (-,
),
the (4.12-4.20 GeV,
26.3),
and (13.2).
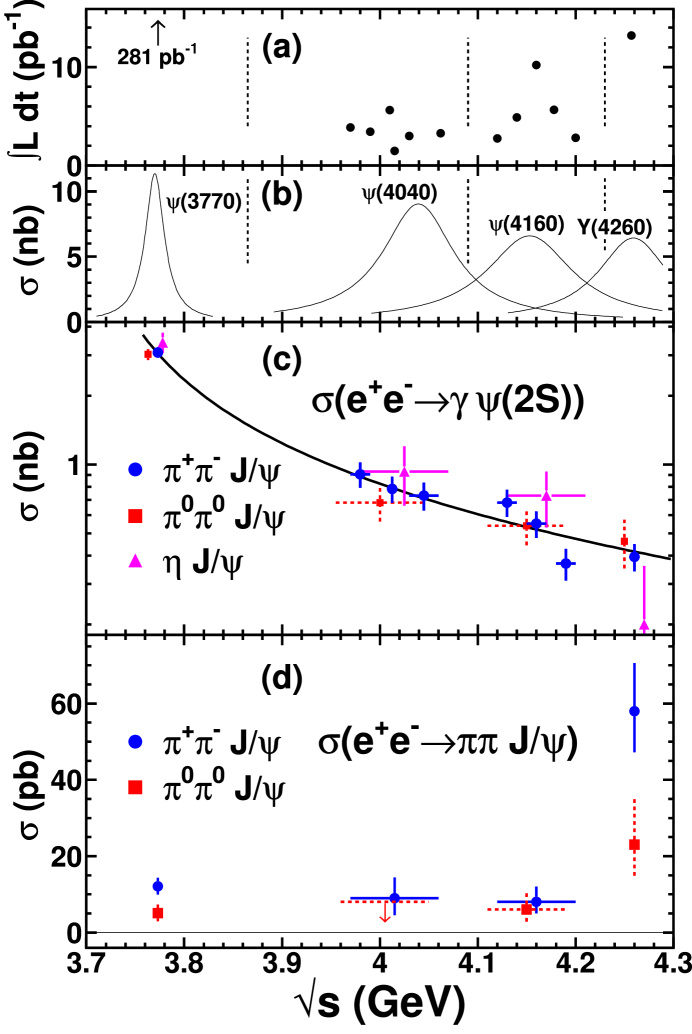
Fig. 1(a) shows a profile of vs.
and Fig. 1(b) the Born-level
Breit-Wigner lineshapes PDG
for the four resonances between =3.7 and 4.4 GeV,
also indicating the grouping of scan points.
We estimate the number of resonances produced
by folding together the luminosities with the resonance
Breit-Wigner cross-sections NewRFit ,
including radiative corrections ISR ; RadiativeCorrections ,
and arrive at
(9311) [(11515)]
[] mesons,
where the dominant errors are the uncertainties on
resonance parameters.
The CLEO detector CLEO features a solid angle coverage of for
charged and neutral particles.
The charged particle tracking system operates in a 1.0 T magnetic field
parallel to the beam axis and achieves a momentum resolution of
0.6% at momenta of . The CsI crystal
calorimeter attains
photon energy resolutions of for =
and at .
Particle identification is performed with the specific
ionization loss () and the Ring Imaging Cherenkov detector (RICH).
Muons of momentum are separated from pions
by their penetration of the calorimeter, solenoid coil,
and up to three 36-cm-thick slabs of magnet iron
for subsequent detection by wire chambers behind each slab.
The integrated luminosity was measured
using , , and
events LUMINS ; Babayaga .
The final states analyzed here are listed in Table 1.
We require all particles in each final state to be reconstructed, and
four-momentum conservation is enforced.
Mass windows for the following
light hadron decays are set, based on MC studies:
(110-150 MeV);
, (450-650 MeV);
, (930-980 MeV);
(730-830 MeV); and
(1.00-1.04 GeV).
We identify a or through
its decay into , = or .
A lepton candidate is
identified by
the ratio of the energy deposited in the
calorimeter, , to the measured momentum, .
Muon pair candidates must satisfy 0.25
for at least one of the tracks and 0.5 for the other;
both electrons must have 0.85 and
a consistent with the value expected for an electron.
Pions faking muons are additionally suppressed
by requiring at least one muon candidate per
muon pair to leave a signature in the muon system.
A lepton pair is classified as a
candidate if the invariant mass of the decay
products lies within 3.04-3.14 [3.64-3.73] GeV.
We also use the decay ,
where we require 3.64-3.73 GeV.
A decay is tagged
by the highest energy photon in the event
having an energy within (60,40) MeV
of =.
Events with
in the or mass ranges are excluded.
Any calorimeter shower other than the two
radiative transition photon candidates
must have 50 MeV.
We select , events () by demanding that
as well as the mass recoiling against the
match PDG within .
For , the kaons have momenta that
are too low for use of the RICH detector, so rejection
is achieved by requiring that at least one of
the candidates have momentum in the range 0.2-0.5
and have within three
standard deviations of the expected value for a .
For and or ,
candidates must be positively
identified as a kaon using a likelihood based upon
both and RICH responses, but none of the candidates
in either decay can be so identified as kaons.
For the mode, both the mass of the
decay products and the
mass recoiling against the
must lie within 50 MeV of PDG .
Similarly, for , the mass recoiling against
must lie in the range 0.94-1.10 GeV.
For and ,
we require that and
that neither pion candidate be
identified as an electron via and as above. These cuts
suppress , events
in which the pair from the photon conversion
is mistaken for the .
For as well as
the
and modes
that end in ,
background from Bhabha events
is diminished by requiring .
For modes with a or
we restrict the missing momentum , computed from the measured event
momenta according to Eq. (6) of Ref. gammaeePsi2S ,
to further reduce background.
Signal events will have ; selection windows
are set separately for each mode according to the
measurement resolution predicted
by MC simulation, and range from ()
and 15 MeV () to (35,75) MeV ().
Backgrounds in the
modes from hadrons
are estimated from the yields seen in the data with
the restrictions on and adjusted to correspond
to masses either below or above .
The sideband windows, and either
=2.900.15 GeV or 3.300.15 GeV,
are considerably wider than the signal regions,
allowing for the accumulation of more
statistics in the background estimates, and therefore are scaled
down by the sideband/signal window width ratios
prior to subtraction from the
signal yields.
The sideband scale factors
are verified in MC simulations of hadrons.
We perform a mass sideband subtraction for
the ,
as a result of which all observed events can be attributed to
background, and for and ,
also reducing the yield substantially; photon energy
sidebands are used to estimate background in .
Background in , , and
modes produced in decay (with
) is summed along with that
from the sidebands in Table 1, and
comprises 10-40% of the total background in those modes.
Other modes could
be subjected to similar subtractions, but due to the absence
of significant event populations, we forgo this option,
and use uncorrected yields to compute (conservative) upper limits.
The evtgen event generator EvtGen , which includes
final state radiation PHOTOS , and a geant-based GEANT
detector simulation are used to model the physics processes.
The generator implements a relative -wave (-wave) configuration
between the ( or ) and
the or .
Detection efficiencies (Table 1)
range from 4-38%,
not including the effects of the intermediate
branching fractions PDG ; psiprimexjpsiprl
for ,
, ,
, or hadrons,
but including those for , , ,
, and decay.
Already included are the effects
of ISR, which reduce efficiencies by relative fractions
of 8-21%.
The radiative return process
results in final states which are nearly identical to some of
our signal modes, and thereby affords an opportunity to verify
our understanding of efficiencies, background, and luminosity.
To gather such events, we alter only the -windows of the event
selections, as such events will congregate
not near but rather around .
The cross-section for this process can be calculated by integrating the
convolution of a Breit-Wigner lineshape (approximated by a -function)
with the ISR kernel from Eq. (28) of Ref. ISR :
(1)
This curve as well as the cross-section measurements
using , =, ,
and psiprimexjpsiprl ,
are shown in Figure 1(c).
The CLEO value for gammaeePsi2S
sets the scale of the theoretical curve in the figure.
The predicted number of
observed radiative return events for
the three channels
together in all the scan data is 82021,
which compares favorably to 82529 events seen.
Table 1 lists cross-section results for
the region.
Cross-section central values and errors are shown
when the statistical significance (the likelihood that
the observed event yield is due entirely to background)
exceeds ;
otherwise upper limits at 90% confidence level (CL)
are shown.
Poisson fluctuations of the background are taken into
account in the computation of statistical uncertainties.
Cross-sections for vs.
are shown in Fig. 1(d);
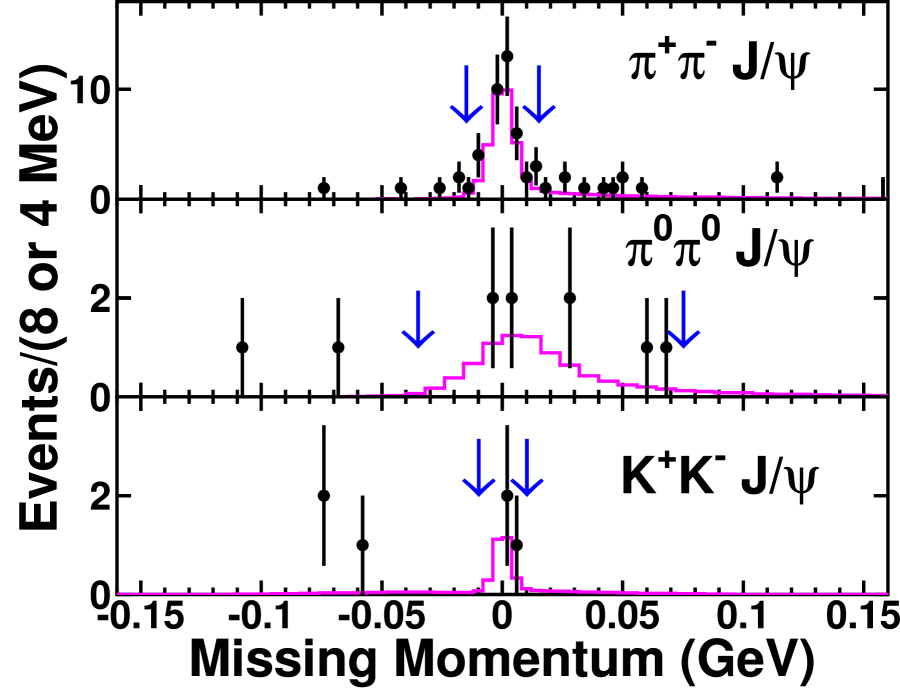
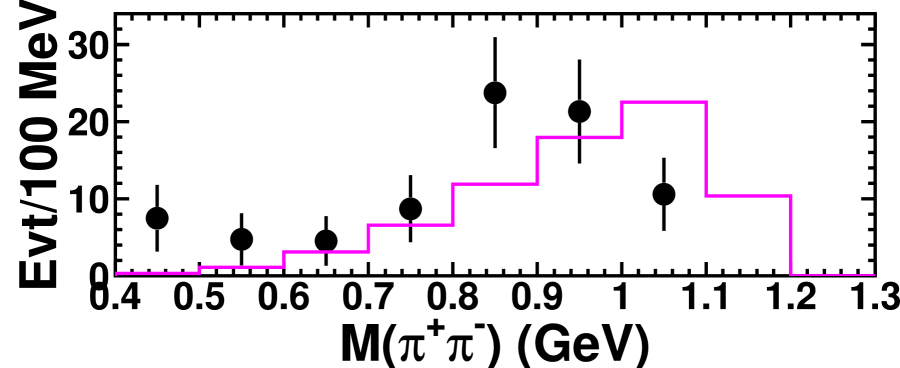
selected missing momentum and dipion mass distributions
appear in Figs. 2 and 3, respectively.
The yields for are consistent with the rate
observed multibody from at =3.67 GeV.
Systematic uncertainties arise
from the following sources: luminosity (2%), charged particle
tracking (1% per track), particle
identification (1% per high momentum , , or ;
5% per in ), 3% per pair
for muon chamber modeling, and a mode-dependent
contribution amounting to
50% of the total estimated background.
Statistical uncertainties dominate.
The total systematic error excluding the background
uncertainty amounts to approximately 10% for most channels
(up to 30% for modes and ).
The only charmonium channels with more than 2.5 statistical significance are,
at =4.260 GeV,
(11),
(5.1),
and (3.7);
in the dataset,
(3.6) and
(2.6); and
in the dataset,
(3.3).
The -region yields of and
are consistent with being due entirely to
the low-side tail BaBar4260ISR .
No compelling evidence is found
for any other decays in the three resonance regions, and
corresponding upper limits on cross-sections (and,
for and datasets, on
branching fractions) are set.
In particular, we find
0.4%
and
0.4%.
These correspond to
partial widths of less than
in both cases,
to be compared with the central values for
and of
and PDG , respectively.
While statistics are low, no prominent narrow features emerge
in , and the distribution is somewhat softer than
the -like MC prediction.
This analysis provides a high-significance
confirmation of the BaBar signal of .
The observation of the mode
disfavors the molecular model LZL .
The fact that the rate is about half that of
disagrees with the prediction of
the baryonium model Qiao . Our evidence of
significant production is not compatible
with these two models either. No evidence of a large
signal from the is observed, making
the conventional = assignment Estrada
less attractive. The results are compatible with hybrid charmonium
interpretations ClosePage ; hybrids ,
but open-charm studies will be required to make
more definitive conclusions.
A large coupling to and
a small one to signals hybrid
charmonium ClosePage , whereas a dominant
() could favor a ClosePage ; Maiani
( Ebert ) tetraquark model.
We gratefully acknowledge the effort of the CESR staff
in providing us with excellent luminosity and running conditions.
This work was supported by
the A.P. Sloan Foundation,
the National Science Foundation,
and the U.S. Department of Energy.
References
(1)
S. Eidelman et al. (Particle Data Group),
Phys. Lett. B 592, 1 (2004),
and 2005 partial update for edition 2006.
(2)
E.J. Eichten, K. Lane, and C. Quigg,
Phys. Rev. D 73, 014014 (2006);
E. Swanson, hep-ph/0601110 (2006).
(3)
B. Aubert et al. (BABAR Collaboration),
Phys. Rev. Lett. 95, 142001 (2005)
[arXiv:hep-ex/0506081].
(4)
B. Aubert et al. (BABAR Collaboration),
Phys. Rev. D 73, 011101(R) (2006)[arXiv:hep-ex/0507090].
(5)
B. Aubert et al. (BABAR Collaboration),
arXiv:hep-ex/0512023 (2005).
(6)
F.E. Close and P.R. Page, Phys. Lett. B 628, 215 (2005).
(7)
S.-L. Zhu, Phys. Lett. B 625, 212 (2005);
E. Kou and O. Pene, Phys. Lett. B 631, 164 (2005);
X.L. Luo and Y. Liu, hep-lat/0512044 (2005).
(8) D. Ebert, R.N. Faustov, and V.O. Galkin, hep-ph/0512230 (2005)
(accepted by Phys. Lett. B).
(9) L. Maiani et al., Phys. Rev. D 72, 031502 (2005),
(10)
T.-W. Chiu and T.H. Hsieh (TWQCD Collaboration), hep-lat/0512029 (2005).
(11) X. Liu, X.-Q. Zeng, and X.-Q. Li,
Phys. Rev. D 72, 054023 (2005).
(12) C.-F. Qiao, hep-ph/0510228 (2005).
(13)
C.Z. Yuan, P. Wang, and X.H. Mo, hep-ph/0511107 (2005).
(14) F.J. Llanes-Estrada,
Phys. Rev. D 72, 031503 (2005).
(15)
Y. Kubota et al. (CLEO Collaboration),
Nucl. Instrum. Meth. A 320, 66 (1992);
M. Artuso et al.,
Nucl. Instrum. Meth. A 554, 147 (2005)
[arXiv:physics/0506132];
D. Peterson et al.,
Nucl. Instrum. Meth. A 478, 142 (2002).
(25)
R. Brun et al., Geant 3.21,
CERN Program Library Long Writeup W5013 (1993),
unpublished.
(26) N.E. Adam et al. (CLEO Collaboration),
Phys. Rev. Lett. 94, 232002 (2005).
(27) R.A. Briere et al. (CLEO Collaboration),
Phys. Rev. Lett. 95, 062001 (2005).
Table 1:
For each mode , for three center-of-mass regions:
the detection efficiency, ;
the number of signal [background] events in data,
[];
the cross-section ;
and the branching fraction of or to ,
. Upper limits are at 90% CL. ’–’ indicates that the
channel is kinematically or experimentally inaccessible.
Channel
()
(pb)
()
(pb)
()
(pb)
37
12
3.7
38
13
3.7
38
37
2.4
20
1
1.9
21
5
0.9
22
8
0.3
–
7
1
0.07
21
3
0.07
19
12
9.5
16
15
8.8
16
5
2.7
23
2
22
1
22
1
–
11
4
2.5
11
0
1.5
21
1
21
0
22
0
–
–
6
1
–
12
0
19
0
–
–
15
0
–
–
9
11
11.5
26
9
8.1
26
11
8.7
26
1
3.3
25
6
8.0
26
10
8.6
27
4
3.3
6
0
8
0
9
0
4
0
8
0
9
0
17
26
3.0
17
17
6.0
18
7
5.5
Figure 1: (a) vs. (circles).
(b) Born-level Breit-Wigner cross-sections for resonances in this
energy region; the curve has an arbitrary vertical scale.
(c) cross-section measurements
vs. from
(circles), (squares, dashed lines), and
(triangles) overlaid with the theoretical prediction as described
in the text.
(d) Cross-sections for (circles)
and (squares, dashed lines) vs. .
Some points in (c) and (d)
are offset in by 10 MeV for display purposes.Figure 2: The missing momentum () distribution for
(top), (middle), and (bottom) in
the data at
(circles), and the
signal shape as predicted by MC simulation
(solid line histogram) scaled to the net signal size.Figure 3: The efficiency-corrected dipion invariant mass distribution for the
final state in the
signal region at for the data (circles)
and the signal shape (solid line histogram) as predicted by -like MC simulation
scaled to the net signal size.