Backgrounds in Neutrino Appearance Signal at MiniBooNE
Abstract
The MiniBooNE (Booster Neutrino Experiment) experiment is a precise search for neutrino oscillations but is crucially sensitive to background processes that would mimic an oscillation signal. The background sources include intrinsic from kaon and muon decays, mis-identified , gammas from radiative delta decays, and muon neutrino events mis-identified as electrons. A summary of these backgrounds and the tools to handle them is presented.
1 Introduction
The MiniBooNE experiment will confirm or refute the LSND result [1] with higher statistics and different sources of systematic error. While LSND observed an excess of events in a beam, the MiniBooNE is a search. The MiniBooNE detector is located 541 from a neutrino source on the Booster neutrino beam line at Fermi National Accelerator Laboratory. Details of the beam line, the detector, major physics interactions and a blind-analysis strategy can be found in Ref.[2]. The interaction point, event time, energies, and the particle tracks are recorded from the times and charges of the PMT hits in the detector. The detector is calibrated over the full energy range from 50 to 1000 using all event types. Stopping cosmic ray muons are used to calibrate the energy scale for muon-type events and measure the position and angle reconstruction resolution, when their path length can be identified. This is accomplished with a scintillator hodoscope on the top of the detector, combined with scintillation cubes at various positions within the detector volume. Observed Michel electrons from muon decay are used to calibrate the energy scale and reconstruction resolution of electron-type events at the 52.8 Michel endpoint. Reconstructed events provide another electron-like calibration source. The photons that are emitted in decays span a considerable range to over 1000 . The mass derived from reconstructed energies and directions of two -rays has a peak at 136.30.8 . This is in an excellent agreement with 135.0 expectation, providing a check on the energy scale and the reconstruction over the full energy range of interest for appearance analysis.
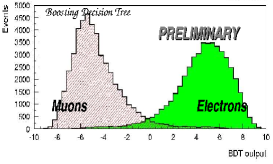
The events described in the calibration procedure are used as a basis for a particle identification (PID). PID is performed by different algorithms that use the difference in characteristics of the Cerenkov rings and scintillation light associated with electrons, muons, protons or ’s. These algorithms include a maximum likelihood method, neural net, and boosted decision trees [3]. The left part of Fig. 1 shows an example of a boosted decision tree where the muon/electron separation was measured with cosmic ray muons and associated electrons. The overlap region in the electron distribution defines a fraction of muons mis-identified as electrons. Similar PID separation is performed between electrons and other types of the detected events.
2 The Backgrounds in the Appearance Signal
The beam that arrives at the detector is almost pure with a small (0.6%) contamination of coming from muon and kaon decays in the decay pipe. The from -decay are directly tied to the observed interactions. Taking into account a small solid angle subtended by the MiniBooNE detector, the pion energy distribution can be determined from the energy of the observed events. The pion energy spectrum is then used to predict the from -decay. A second source of originates from -decay. This component will be constrained using data from two low energy production experiments: HARP experiment at CERN [4] and E910 experiment at BNL [5]. An additional check will be performed by a system called LMC (Little Muon Counters), measuring the muons from pion and kaon decays coming at wide angles from the decay pipe [6].

An important background component comes from neutral production of . Most are identified by the reconstruction of two Cherenkov rings produced by two decay -rays. However, the decay of can appear much like primary electron emerging from a charged current interaction if one of the gammas from the decay overlaps the other, or is too low in energy to be detected. Over 99% of the NC are rejected in the appearance analysis.
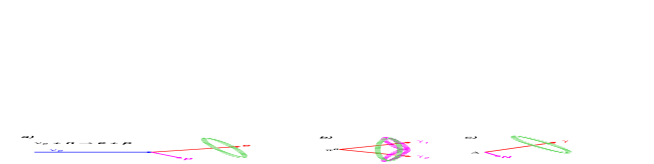
In addition to its primary decay , the resonance has a branching fraction of 0.56% to final state. The -ray may mimic an electron from interaction. The rate of production in neutral current interactions can be estimated from the data, using the sample of reconstructed decays. Fig. 2 illustrates the imitation of the signal by and events.
Most events can be easily identified by their penetration into the veto region when exiting muons fire the veto, or by muons stopping in the inner detector and producing a Michel electron after a few microseconds.
| Event Class | Cross-check |
|---|---|
| HARP, LMC, External Data | |
| E910, External Data | |
| MiniBooNE Data | |
| NuMI, MiniBooNE Data | |
| Other (, etc) | NuMI, MiniBooNE Data |
Another handle on the background comes from the energy and/or PID output distributions of the signal and various background components. Figure 1 (right) shows the energy distribution of the background summed with an oscillation signal for and . A fit to the energy distribution results in an enhanced sensitivity as the intrinsic events show a high energy tail while mis-identified are much narrower.
An important cross-check of electron event reconstruction and particle identification comes from NuMI events observed in the MiniBooNE detector [7]. NuMI events consist of , , , and over the range of the energies relevant to the appearance analysis in MiniBooNE. A complete list of cross-checks is given in Table 1.
References
- [1] A. Aguilar et al., Phys. Rev. D 64 (2001) 112007.
- [2] J.M. Conrad, these proceedings; S.J. Brice, Nucl.Phys.Proc.Suppl 143, 115 (2005); M.O. Wascko, these proceedings.
- [3] B.P. Roe et al., Nucl.Inst.Meth.A 543, 577 (2005).; H-J. Yang, B.P. Roe and J. Zhu, Nucl.Inst.Meth.A 555, 370 (2005).
- [4] The HARP Experiment at CERN, http://harp.web.cern.ch/harp/.
- [5] The E910 Experiment at BNL, http://www.phy.bnl.gov/ẽ910/html/home.html.
- [6] R. Nelson, these proceedings.
- [7] A. A. Aguilar-Arevalo, these proceedings.