Measurement of the Analyzing Power in Elastc Scattering in the CNI Region with a Polarized Atomic Hydrogen Gas Jet Target
Abstract
A precise measurement of the analyzing power in proton-proton elastic scattering in the region of 4-momentum transfer squared has been performed using a polarized atomic hydrogen gas jet target and the 100 GeV/ RHIC proton beam. The interference of the electromagnetic spin-flip amplitude with a hadronic spin-nonflip amplitude is predicted to generate a significant of 4–5%, peaking at . This kinematic region is known as the Coulomb Nuclear Interference region. A possible hadronic spin-flip amplitude modifies this otherwise calculable prediction. Our data are well described by the CNI prediction with the electromagnetic spin-flip alone and do not support the presence of a large hadronic spin-flip amplitude.
pacs:
13.88.+e, 13.85.Dz, 29.25.PjInterference phenomena in hadron collisions have often led to spectacular spin effects in the final state. This, for instance, occurs in the elastic scattering of transversely polarized protons at small angles, where the interference of a small spin-flip amplitude, that otherwise would be difficult to detect, with a large spin-nonflip amplitude leads to a sizeable analyzing power . The region of low 4-momentum transfer squared is associated with long distance phenomena and therefore is in the domain of non-perturbative QCD. Polarized experiments in this region allow us to explore the spin properties of QCD at large distances. is a measure of the left–right asymmetry of the cross section in the scattering plane normal to the beam or target polarization.
In high energy and elastic scattering at very low , the dominant contribution to comes from the interference between the electromagnetic (Coulomb) spin-flip amplitude, which is generated by the proton’s anomalous magnetic moment, and the hadronic (nuclear) spin-nonflip amplitudes, which can be related to the total cross section via the optical theorem (thus Coulomb Nuclear Interference). reaches a predicted maximum value of about 4–5% around and decreases with increasing Kop74 ; But78 . In general, the form of and the position of its maximum depend on the parameters describing the hadronic amplitudes: , the ratio between the real and imaginary parts of the forward scattering amplitude, the Bethe phase shift , and the nuclear slope parameter But99 .
A potential hadronic spin-flip amplitude interfering with the electromagnetic spin-nonflip one introduces a deviation in shape and magnitude for calculated with no hadronic spin-flip But99 . A measurement of in the CNI region, therefore, can be a sensitive probe for the hadronic spin-flip amplitude. This effect is measured by the ratio between the single spin-flip () and the spin-nonflip (, ) hadronic amplitudes:
| (1) |
where is the proton mass. In the simplest hypothesis the reduced spin-flip amplitude is assumed to be proportional to and But99 . The dependence of the hadronic spin-flip amplitude, however, is tightly connected with the structure of hadrons at large distances and carries information on the static properties and on the constituent quark structure of the nucleon Pre02 .
Within Regge phenomenology, one can probe the long standing issue of the magnitude of the Pomeron spin-flip Kop89 ; But99 . In a diquark enhanced picture of the proton, for instance, the magnitude of the hadronic spin-flip amplitude is associated with the diquark separation, the smaller this separation the bigger the effect Kop89 . In the impact model based on the rotating matter picture for a polarized proton the spin-orbit coupling provides a helicity-flip amplitude Sof79 . Hadronic spin-flip contributions may also have their origins in instantons Ans93 .
A first measurement of at , though much less precise, had been performed by the E704 experiment at Fermilab using the 200 GeV/ polarized proton beam obtained from the decay of hyperons E704 . Recently, has been measured also at by colliding the RHIC polarized proton beams Bue05 .
In this Letter we report on a precise measurement of the analyzing power in the CNI region of at using an internal polarized atomic hydrogen gas jet target and the 100 GeV/ RHIC proton beam. The RHIC collider accelerates transversely polarized protons in bunches of opposite polarization Ale03 . By averaging over the bunch polarizations and several accelerator fills, one obtains an unpolarized proton beam.
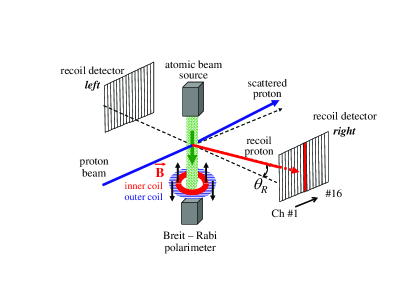
Figure 1 shows the schematic layout of this experiment, located at the 12 o’clock interaction point of RHIC. The polarized atomic hydrogen beam crossed the RHIC proton beams from above. The two RHIC beams were radially displaced by about 10 mm, so that only the beam circulating clockwise (the blue beam) interacted with the jet target. The polarization of the atomic beam was directed vertically. In the CNI region at high energies recoil protons from elastic scattering emerge close to with respect to the incident beam direction. The scattered beam protons did not exit the beam pipe and were not detected. In the covered region, however, the elastic process is fully constrained by the recoil particle alone.
The polarized hydrogen jet is produced by an atomic beam source in which molecular hydrogen is dissociated by a radio frequency (RF) discharge. Hydrogen atoms emerge through a 2 mm diameter nozzle cooled to 70 K and enter a set of sextupole magnets that spin separate and focus the atomic beam according to the electron spin. Nuclear polarization of the atoms is obtained using two RF transitions that induce spin-flips in the hydrogen atoms. To avoid depolarization of the atoms a set of Helmholtz coils around the interaction point provided a very uniform vertical magnetic holding field (0.12 T).
The target polarization was constantly monitored with a Breit-Rabi polarimeter located below the interaction point. The net proton polarization was . A measured contamination of the atomic beam by hydrogen atoms bound into molecules resulted in a small dilution of the target polarization. Taking into account this dilution, the target polarization was . The proton polarization was reversed every 600 s by turning on one or the other of two RF coils. The efficiency of the spin-flip transitions was above 99%. Most systematic effects associated with the spin-asymmetry extraction thus cancel. The atomic jet achieved a polarized beam intensity of H atoms/s at a speed of , which is the highest intensity recorded to date. At the interaction point the target profile is nearly gaussian with a FWHM of 6.5 mm. The areal density of the target is . For more details see Zel05 .
The recoil protons were detected using an array of silicon detectors located to the left and to the right of the beam at a distance . On each side, the detectors cover an aziumuthal angle of centered on the horizontal mid-plane. Since the momenta of the recoil protons are very low, a second set of Helmholtz coils, coaxial to the first one with the current circulating in the opposite direction, was used to cancel the deflection of the recoil proton trajectory induced by the inner coils. The resulting total magnetic field integral seen by the recoil protons is nearly zero, and the deviation from the original trajectory was less than 3 mm for the lowest momentum detected protons, leading to an almost identical acceptance for the left and right detectors.
Each array consisted of 3 silicon detectors segmented horizontally, in size, with a read out pitch for a total of 16 channels per detector. The detectors were thick. Recoil protons with kinetic energies up to 7 MeV were fully absorbed. More energetic protons punched through the detectors, depositing only a fraction of their energy. The energy calibration of the silicon detectors was performed using two sources of different energies ( and ), which allowed us also to estimate the thickness of the detector’s entrance window () and correct for it. The detectors were read out with waveform digitizers (WFD) that performed simultanously the function of peak sensing ADC’s and constant fraction discriminators, and provided a deadtime free data acquisition system.
The recoil detectors provided energy (), recoil polar angle (), and time of flight (ToF) measurements for the recoil particles. The 4-momentum transfer squared is given by . The ToF is measured with respect to the bunch crossing given by the accelerator RF clock. Typical resolutions were , , and . The angular resolution receives contributions from the spatial resolution of the detector ( mrad) and the jet target profile. The ToF resolution comes from the intrinsic time resolution of the detectors () and the length of the RHIC beam bunches ().
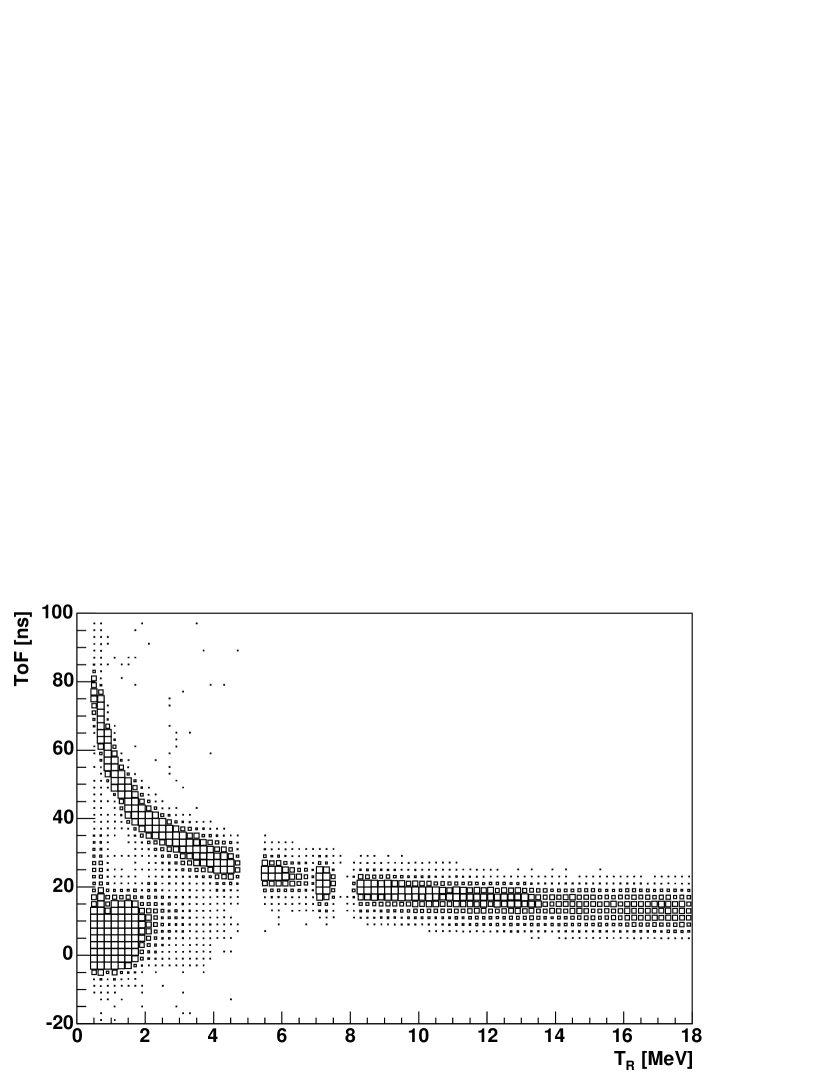
Recoil protons were identified using the non-relativistic relation shown in Figure 2. Recoil protons of given could be clearly separated from prompt particles on the ToF basis. Below 7 MeV recoil protons are fully absorbed in the detectors. Above 7 MeV, is corrected for punch-through using the detector thickness and the energy loss in silicon Berxx . Events were selected in a ToF interval of ns around the expected ToF value for recoil protons of a given .
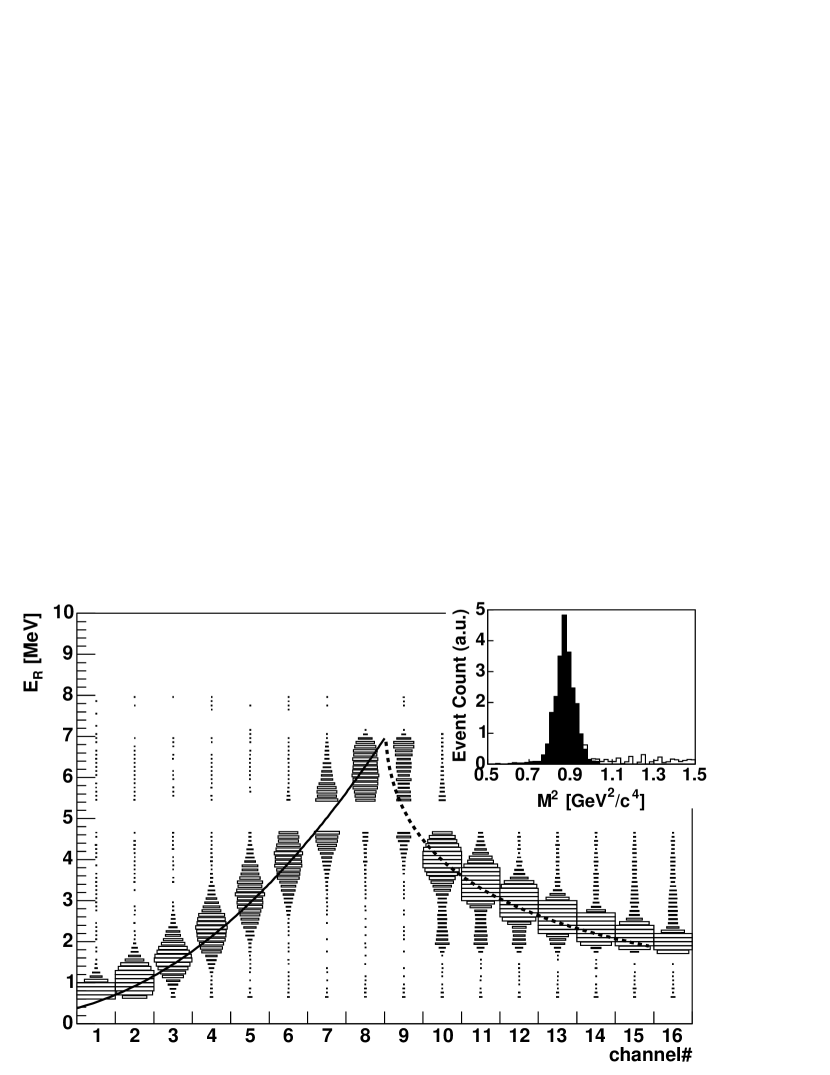
elastic scattering events are identified on the basis of the – relation . Figure 3 shows the measured – correlation for ToF selected events. In the scatter plot is measured by the detector channel number in mrad steps. is the energy deposited by the recoil protons in the detectors. The locus on the left in Figure 3 is generated by fully absorbed protons, while the locus on the right is due to punch through protons. The full line is the kinematic expectation for elastic scattering for fully absorbed protons. The dashed line shows the expected energy deposited in the detector by more energetic protons for .
For each bin (see Table 1) elastic events were selected in 3 adjacent detector channels centered around the expected angle. On the basis of the measured and the mass of the undetected scattered beam particle (the missing mass ) can be reconstructed. For elastic scattering . The channel for diffractive dissociation opens at . The selected elastic events are well separated from the inelastic threshold for (see inset). The contamination from inelastic channels for larger was estimated to be less than 0.5%.
was extracted from the geometrical mean of spin sorted event yields Ohl73 :
| (2) |
where is the number of selected elastic scattering events detected on the left(right) of the beam, and the arrows give the direction of the target polarization. In this expression flux factors, acceptances, and efficiencies factor out and appear only as third order corrections. Data were gathered in 14 bins (see Table I).
The level of background under the signal was estimated from empty target runs with and without beam, and sidebands in the strip distributions for fixed recoil energy bins. These backgrounds were flat. The background included source background, beam scraping, and beam scattering from residual target gas. The overall background level was dependent on the bin: it increased from 6% to 9% for the lowest bins (0.6 to 7.4 MeV) and for the punch-through bins (8.0 to 17.0 MeV). The final values were corrected for source background and beam gas scattering. The background originating from the unpolarized residual target gas and the target tails has been already accounted for as a dilution of the target polarization.
The major sources of systematic uncertainties come from the error on the target polarization giving an overall 2.0% normalization uncertainty, the false and acceptance asymmetries, event selection criteria, and the background. The background uncertainty from the residual target gas is included in the target polarization uncertainty, which is from two independent measurements.
Figure 4 displays the analyzing power as a function of in the range at . These data are summarized in Table 1.
The data are compared to the CNI prediction with no hadronic spin-flip But99 using for the hadronic amplitudes , , , Blo85 . The major uncertainty in the CNI prediction comes from the parametrization of the hadronic amplitudes and the approximate knowledge of the parameter. The is 13.4 for 14 degrees of freedom.
The data were also fitted with the CNI prediction allowing for a hadronic spin-flip contribution (Eq. 1, dashed line in Figure 4). The quality of the fit is similar to the case with no hadronic spin-flip ( d.o.f.). The values obtained for are and , and the correlation parameter between and is . The results of the fit are shown as inset in Figure 4.
These data are consistent with no hadronic spin-flip and do not support the presence of a large hadronic spin-flip amplitude at this energy. data from proton-carbon elastic scattering over a similar kinematic range at the same Jin04 and lower Toj02 energies, on the contrary, deviate substantially from the simple CNI prediction and require a substantial hadronic spin-flip contribution.
In summary, we have measured for elastic scattering at over the range of . Our data are well described by the CNI prediction, in which is generated by the proton’s anomalous magnetic moment alone, and do not support the presence of a large hadronic spin-flip contribution. Measurements of similar precision at higher as well as lower energies, and using different nuclear targets are required to fully disentangle the role of the hadronic spin-flip amplitudes, their energy dependence and the different behavior between proton and nuclear targets.
We would like to thank Collider Accelerator Department and the Instrumentation Division at BNL for
their work on the silicon detectors and electronics.
This work is performed under the auspices of U.S. DOE contract
Nos. DE-AC02-98CH10886 and W-31-109-ENG-38, DOE grant No. DE-FG02-88ER40438,
NSF grant PHY-0100348, and with support from RIKEN, Japan.
| (MeV) | (stat. sys. norm.) | ||
|---|---|---|---|
| 0.6 – 1.0 | 0.0015 | ||
| 1.0 – 1.4 | 0.0022 | ||
| 1.4 – 1.8 | 0.0030 | ||
| 1.8 – 2.2 | 0.0037 | ||
| 2.2 – 2.5 | 0.0044 | ||
| 3.0 – 3.5 | 0.0061 | ||
| 3.5 – 4.2 | 0.0071 | ||
| 4.2 – 4.7 | 0.0084 | ||
| 5.7 – 7.4 | 0.0118 | ||
| 8.0 – 9.3 | 0.0165 | ||
| 9.3 – 10.6 | 0.0187 | ||
| 10.6 – 12.0 | 0.0212 | ||
| 14.5 – 16.0 | 0.0287 | ||
| 16.0 – 17.0 | 0.0309 |
References
- (1) B.Z. Kopeliovich and L.I. Lapidus, Sov. J. Nucl. Phys. 19, 114 (1974).
- (2) N.H. Buttimore, E. Gotsman, and E. Leader, Phys. Rev. D 18, 694 (1978).
- (3) N.H. Buttimore et al., Phys. Rev. D 59, 114010 (1999).
-
(4)
E. Predazzi and O.V. Selyugin, Eur. Phys. J. A 13, 471 (2002);
A.F. Martin and E. Predazzi, Phys. Rev. D 66, 034029 (2002). - (5) B.Z. Kopeliovich and B.G. Zakharov, Phys. Lett. B 226, 156 (1989).
- (6) C. Bourelly, J. Soffer, and T.T. Wu, Phys. Rev. D 19, 3249 (1979); Nucl. Phys B. 247, 15 (1984).
- (7) M. Anselmino and S. Forte, Phys. Rev. Lett. 71, 223 (1993).
- (8) N. Akchurin et al., Phys. Rev. D 48, 3026 (1993).
- (9) S. Bültmann et al., Phys. Lett. B 632, 167 (2006).
- (10) I. Alekseev et al., Nucl. Inst. Meth. A 499, 392 (2003).
-
(11)
A. Zelenski et al., Nucl. Inst. and Meth. A 536, 248 (2005);
T. Wise et al., Nucl. Inst. and Meth. A 559, 1 (2006). -
(12)
M.J. Berger et al.,
NIST database
http://www.nist.gov/PhysRefData/Star/Text - (13) G.G. Ohlsen and P.W. Keaton, Nucl. Inst. Meth. 109, 41 (1973).
- (14) M.M. Block and R.N. Cahn, Rev. Mod. Phys. 57, 563 (1985).
- (15) O. Jinnouchi et al., Proc. International Spin Physics Symposium SPIN2004, p. 515.
- (16) J. Tojo et al., Phys. Rev. Lett. 89, 052302 (2002).