Search for a Lorentz invariance violation in atmospheric neutrino oscillations using MACRO data
Miriam Giorgini
Dept of Physics, Univ. of Bologna and INFN,
V.le C. Berti Pichat 6/2, Bologna, I-40127, Italy
E-mail: miriam.giorgini@bo.infn.it
Invited talk at C2CR 2005, From Colliders to Cosmic Rays,
Prague, Czech Republic, 7-13 September 2005.
Abstract
The energy spectrum of neutrino-induced upward-going muons in MACRO was analysed in terms of special relativity principles violating effects, keeping standard mass-induced atmospheric neutrino oscillations as the dominant source of transitions. The data disfavour these exotic possibilities even at a sub-dominant level, and stringent C.L. limits are placed on the Lorentz invariance violation parameters. These limits can also be re-interpreted as upper bounds on the parameters describing violation of the Equivalence Principle.
1 Introduction
The phenomenon of neutrino flavour oscillations, induced by flavour-mass eigenstate mixing, is now considered a solid explanation of both solar and atmospheric neutrino data [1, 2, 3, 4, 5]. In particular, the deficit of atmospheric muon neutrinos is well described by the two flavour oscillations, with maximal mixing between flavour and mass eigenstates [3, 4]. This solution is strongly favoured over alternative solutions, like oscillations [6, 7], oscillations [4, 5] and other exotic possibilities, such as violation of relativity principles [8, 9, 10, 11, 12], neutrino decoherence [8, 13] and neutrino radiative decays [13, 14].
However, these alternative mechanisms have been considered under the hypothesis that each one solely accounts for the observed effects. It means that they are considered independent and mutually exclusive. Here we analyse the possibility of a mixed scenario: one mechanism, the mass-induced flavour oscillations, is considered dominant and a second mechanism is included in competition with the former. We studied, as sub-dominant mechanism, neutrino flavour transitions induced by violations of relativity principles, i.e. violation of the Lorentz invariance (VLI) or of the equivalence principle (VEP).
In this mixed scenario, we assume that neutrinos can be described in terms of three distinct bases: flavour eigenstates, mass eigenstates and velocity eigenstates, the latter being characterised by different maximum attainable velocities (MAVs), and consider that only two families contribute to the atmospheric neutrino oscillations. Thus, we may write
| (1) |
In Eq. (1) the index or for mass and velocity eigenstates, respectively. When both mass-induced and VLI-induced neutrino oscillations are considered simultaneously, the survival probability can be expressed as [10, 11, 12]
| (2) |
where the global mixing angle and the term are given by:
| (3) |
The terms and in Eq. (3) contain the relevant physical information
| (4) |
where the muon neutrino pathlength is expressed in km, the neutrino energy in GeV and the oscillation parameters and are in eV2 and units, respectively. The unconstrained phase refers to the connection between the mass and velocity eigenstates.
Note that in the limit () we recover pure mass-induced (VLI-induced) oscillations and the functional form of the oscillation probabilities exhibits an () dependence on the neutrino energies and pathlengths. Moreover, in the limiting cases of pure oscillations, the survival probabilities do not depend on the sign of the mixing angle and/or on the sign of the and parameters; this is not so in the case of mixed oscillations, as can be seen from Eq. (4), where the relative sign between the mass-induced and VLI-induced oscillation terms is important. The whole domain of variability of the parameters can be accessed with the requirements , , and .
The same formalism also applies to violation of the equivalence principle, after substituting with the adimensional product ; is the difference of the coupling constants for neutrinos of different types to the gravitational potential [15].
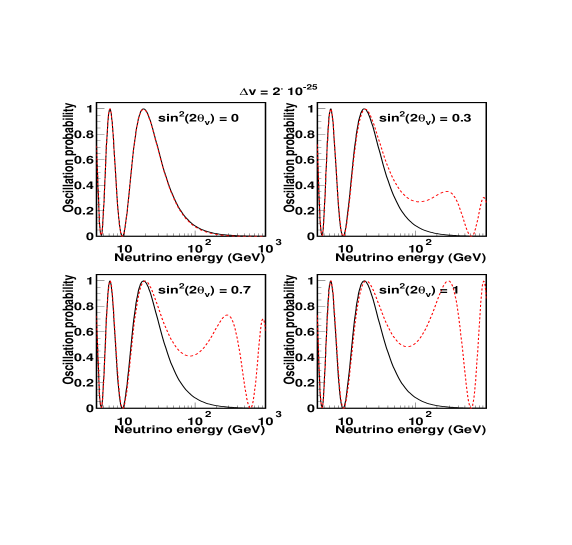
As shown in [11, 12, 16], the most sensitive tests of VLI can be made by analysing the high energy tail of atmospheric neutrinos at large pathlength values. As an example, Fig. 1 shows the energy dependence of the oscillation probability as a function of the neutrino energy, for neutrino mass-induced oscillations alone and for both mass and VLI-induced oscillations for and different values of the parameter. Note the large sensitivity for large neutrino energies and large mixing angles. Given the very small neutrino mass ( eV), neutrinos with energies larger than 100 GeV are extremely relativistic, with Lorentz factors larger than .
In the next section we summarise the main results of the global analysis of MACRO neutrino data [3], which used the information from i) the zenith angle distribution of upward-throughgoing muons, ii) from the energy distribution of a sub-sample of them and iii) from the low energy neutrino data.
In Sect. 3, we consider the sub-sample of events in point ii) and re-analyse their energy distribution in terms of mass-induced + VLI-induced mixed oscillations [17]. Since we consider mass-induced oscillations as the dominant source of neutrino flavour transitions, we fix the parameter and at the values obtained from the global analysis and leave the VLI parameters free to vary. Finally, the constrains on and parameters are partially relaxed and a multidimensional analysis is performed.
2 MACRO results on mass-induced atmospheric neutrino oscillations
MACRO [18] was a multipurpose large area detector ( m2 sr acceptance for an isotropic flux) located in the Gran Sasso underground Lab, shielded by a minimum rock overburden of 3150 hg/cm2. The detector had global dimensions of m3 and used limited streamer tubes and scintillation counters to detect muons. ’s were detected via charged current interactions ; upward-throughgoing muons were identified with the streamer tube system (for tracking) and the scintillator system (for time-of-flight measurement). Early results on atmospheric neutrinos were published in [19] and in [2] for the upward-throughgoing muon sample and in [20] for the low energy semi-contained and upgoing-stopping muon events. Matter effects in the channel were presented in [6] and a global analysis of all neutrino data in [3].
In the following we shall briefly recall the analyses performed on different samples of upgoing muon data, whose combination yielded the mass-induced atmospheric neutrino oscillation parameters: eV2 and .
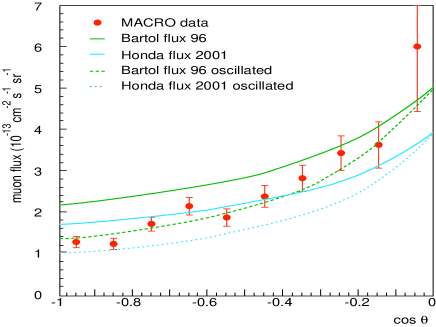
The first method, (already used in early analyses) is based on the study of the zenith angle distribution of upward-throughgoing muons. Fig. 2 shows MACRO data (black circles) compared with two Monte Carlo (MC) predictions: the Bartol96 [21] flux with and without oscillations (the dashed and solid lines respectively) and the Honda2001 flux [22], the lower curves; the new FLUKA MC predictions agree perfectly with the new Honda [25]. The shapes of the angular distributions are very similar, but the absolute flux values predicted by the two simulations differ by about 25%; more specifically, if we consider the flux extrapolation towards the horizontal direction where no oscillations are expected, we find that our data are in good agreement with the Bartol96 MC.
For a subsample of 300 upward-throughgoing muons MACRO estimated the muon energies via multiple Coulomb scattering in the 7 horizontal rock absorbers in the lower apparatus [23, 24]. The energy estimate was obtained using the streamer tubes in drift mode, which allowed to considerably improve the spatial resolution of the detector ( mm). The overall neutrino energy resolution was of the order of 100%, mainly dominated by muon energy losses in the rock below the detector (note that ). Upgoing muon neutrinos of this sample have large zenith angles () and the median value of neutrino pathlengths is slightly larger than 10000 km.
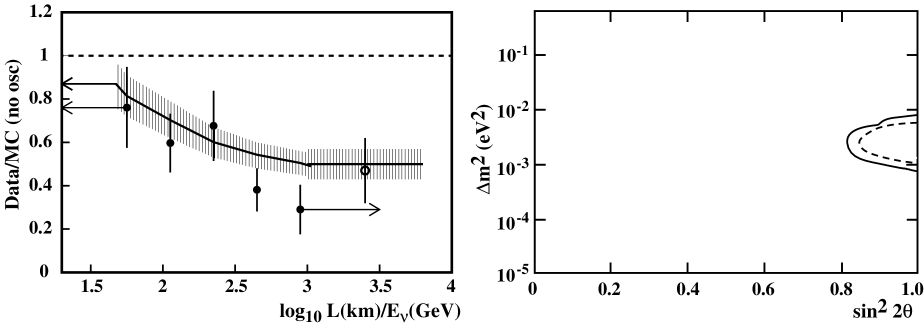
Fig. 3a shows the ratio data/MC as a function of the estimated for the upthroughgoing muon sample. The black circles are data/Bartol96 MC (assuming no oscillations); the solid line is the oscillated MC prediction for eV2 and . The shaded region represents the simulation uncertainties. The last point (empty circle) is obtained from semicontained upward going muons.
In order to reduce the effects of systematic uncertainties in the MC absolute fluxes we used the following three independent ratios [3]:
-
(i)
High Energy data: vertical/horizontal ratio,
-
(ii)
High Energy data: low energy/high energy ratio,
-
(iii)
Low Energy data:
With these ratios, the no oscillation hypothesis has a probability and is ruled out at the level. By fitting the 3 ratios to the oscillation formulae we obtain , eV2 and the allowed region indicated by the solid line in Fig. 3b.
Using the Bartol96 flux we may add the information on the absolute fluxes of the
-
(iv)
High Energy data (systematic scale error of ): .
-
(v)
Low Energy semicontained muons, with a systematic scale error of , .
These informations reduce the area of the allowed region (dashed line in Fig. 3b), do not change the best fit values and bring the oscillation significance to .
3 Exotic contributions to mass-induced oscillations
In order to analyse the MACRO data in terms of VLI, we used the aforementioned subsample of 300 upward-throughgoing muons whose energies were estimated via Multiple Coulomb Scattering.
We used two independent and complementary analyses: one based on the criterion and the Feldman and Cousins prescription [26], and a second one based on the maximum likelihood technique [17].
3.1 Analysis
Following the analysis in Ref. [24], we selected a low and a high energy sample by requiring that the reconstructed neutrino energy should be GeV and GeV. The number of events surviving these cuts is = 49 and = 58, respectively; their median energies, estimated via Monte Carlo, are 13 GeV and 204 GeV (assuming mass-induced oscillations).
The analysis then proceeds by fixing the neutrino mass oscillation parameters at the values obtained with the global analysis of all MACRO neutrino data [3]: eV2, sin22. The factor for the moment is assumed to be real ( = 0 or ). Then, we scanned the plane of the two free parameters (, ) using the function
| (5) |
where is the number of events predicted by Monte Carlo, is a constant which normalises the number of Monte Carlo events to the number of observed events and is the overall error comprehensive of statistical and systematic uncertainties [17].
We used the Monte Carlo simulation described in [24] with different neutrino fluxes in input [21, 22, 27, 28]. The largest relative percentage difference of the extreme values of the MC expected ratio is . However, in the evaluation of the systematic error, the main sources of uncertainties for this ratio (namely the primary cosmic ray spectral index and neutrino cross sections) have been separately estimated and their effects added in quadrature (see [24] for details): in this work, we use a conservative theoretical systematic error on the ratio . The experimental systematic error on the ratio is estimated to be . In the following, we show the results obtained with the computation in [28].
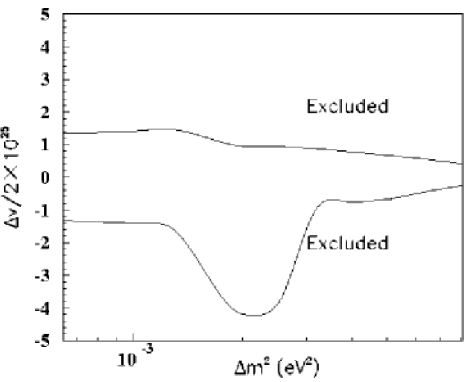
The inclusion of the VLI effect does not improve the in any point of the (, ) plane, compared to mass-induced oscillations stand-alone, and proper upper limits on VLI parameters were obtained. The C.L. limits on and , computed with the Feldman and Cousins prescription [26], are shown by the dashed line in Fig. 4.
The energy cuts described above (the same used in Ref. [24]), were optimised for mass-induced neutrino oscillations. In order to maximise the sensitivity of the analysis for VLI induced oscillations, we performed a blind analysis, based only on Monte Carlo events, to determine the energy cuts which yield the best performances. The results of this study suggest the cuts 28 GeV and 142 GeV; with these cuts the number of events in the real data are = 44 events and = 35 events. The limits obtained with this selection are shown in Fig. 4 by the continuous line. As expected, the limits are now more stringent than for the previous choice.
In order to understand the dependence of this result with respect to the choice of the parameter, we varied the values around the best-fit point. We found that a variation of of moves up/down the upper limit of VLI parameters by at most a factor 2.
Finally, we computed the limit on marginalized with respect to all the other parameters left free to change inside the intervals: and any value of the phase . We obtained the C.L. upper limit .
3.2 Maximum Likelihood Analysis
A different and complementary analysis of VLI contributions to the atmospheric neutrino oscillations was made on the MACRO muon data corresponding to parent neutrino energies in the range 25 GeV GeV. This energy region is characterised by the best energy reconstruction, and the number of muons satisfying this selection is 106. These events are outside the energy ranges used in the analysis discussed in Sect. 3.1, thus the expected sensitivity to VLI (or VEP) contributions to the atmospheric neutrino oscillations should be lower; on the other hand, the maximum likelihood technique (MLT) has the advantage to exploit the information event-by-event (it is a bin-free approach).
Given a specific hypothesis, MLT allows to determine the set of parameters of the problem (in our case ) that maximises the probability of the realization of the actual measurements (here ); this can be accomplished by minimising the negative log-likelihood function:
| (6) |
where the sum is over the number of observed events, and is (at least proportional to) the probability of realization of a given event, which in our case is:
| (7) |
In Eq. (7), is a normalisation factor meant to ensure that the integral of over the observables space is independent on the parameters (otherwise would not converge), is the MC probability to observe the event in the no-oscillation hypothesis and is the survival probability given by Eq. (2).
MLT has a drawback: is not a true goodness of fit estimator, as the more popular we used in the analysis in Sect. 3.1; at the same time, it has the advantage to be very effective when the experimental statistics is limited111We tested the MLT on the 106 events sub-sample of the data in the hypothesis of only mass-induced neutrino oscillations, obtaining results compatible with those reported in [3], based on the full MACRO statistics..
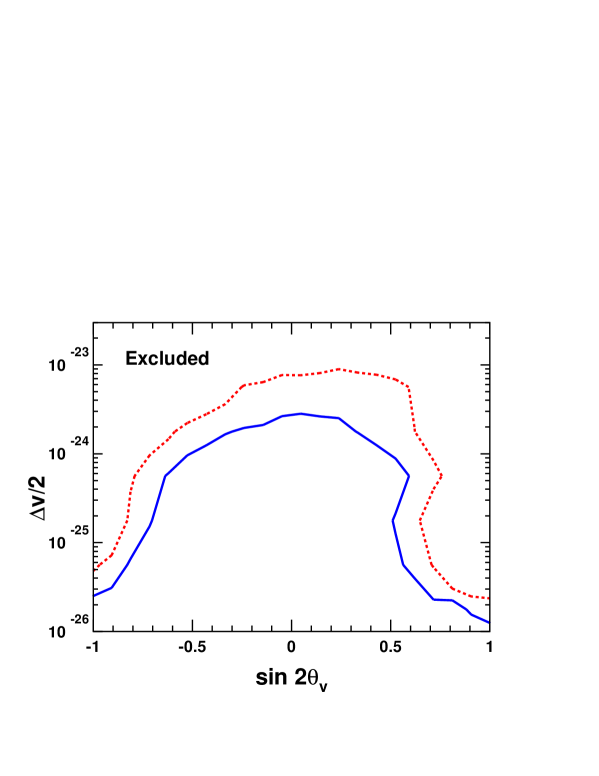
We have chosen different fixed values of the and mass-oscillation parameters on the C.L. border reported in Ref. [3] (the solid curve in Fig. 3b) and found the relative and that minimise Eq. (6). Fig. 5 shows the C.L. limits of the VLI parameter versus the assumed values.
The limit shown in Fig. 5 was obtained as a convolution of the C.L. upper limits of corresponding to each chosen value.
4 Conclusions
We have searched for “exotic” contributions to standard mass-induced atmospheric neutrino oscillations arising from a possible violation of Lorentz invariance. We used a subsample of MACRO muon events for which an energy measurement was made via multiple Coulomb scattering. The inclusion of VLI effects does not improve the fit to the data, and we conclude that these effects are disfavoured even at the sub-dominant level [17].
Two different and complementary analyses were performed on the data, both of them yielding compatible upper limits for the VLI contribution.
The first approach uses two sub-sets of events referred to as the low energy and the high energy samples. The mass neutrino oscillation parameters have been fixed to the values determined in Ref. [3], and we mapped the evolution of the estimator in the plane of the VLI parameters, and . No significant improvement was found, so we applied the Feldman Cousins method to determine C.L. upper limits on the VLI parameters: at and at , see Fig. 4. In terms of the parameter alone (marginalization with respect to all the other parameters), the VLI parameter bound is (at C.L.) .
These results may be reinterpreted in terms of C.L. limits of parameters connected with violation of the equivalence principle, giving the limit .
The second approach exploits the information contained in a data sub-set characterised by intermediate muon energies. It is based on the maximum likelihood technique, and considers the mass neutrino oscillation parameters inside the border of the global result [3]. The obtained C.L. upper and lower limits on the VLI parameter (shown in Fig. 5 versus the assumed values) is also around .
The two analyses yielded compatible results.
The limits reported in this paper are comparable to those estimated using SuperKamiokande and K2K data [10].
Acknowledgements. I would like to acknowledge the cooperation of the members of the MACRO Collaboration and of many colleagues for discussions and advise, in particular G. Battistoni, P. Bernardini, S. Cecchini, H. Dekhissi, G.L. Fogli, G. Giacomelli, S.L. Glashow, P. Lipari, G. Mandrioli, L. Patrizii, V. Popa, F. Ronga, M. Sioli and M. Spurio.
References
- [1] J.N. Bahcall et al., JHEP 0408 (2004) 016.
- [2] M. Ambrosio et al., Phys. Lett. B 434 (1998) 451.
- [3] M. Ambrosio et al., Eur. Phys. J. C 36 (2004) 323.
- [4] Y. Fukuda et al., Phys. Rev. Lett. 81 (1998) 1562; Y. Ashie et al., hep-ex/0501064.
- [5] M. Sanchez et al., Phys. Rev. D 68 (2003) 113004.
- [6] M. Ambrosio et al., Phys. Lett. B 517 (2001) 59.
- [7] S. Fukuda et al., Phys. Rev. Lett. 85 (2000) 3999.
- [8] A. Habig: in Proc. 28th International Cosmic Ray Conferences, Tsukuba, Japan, 2003 (Academic Press) p. 1255.
- [9] V. Popa and M. Rujoiu: in Proc. Cosmic Radiations: from Astronomy to Particle Physics, Oujda, Morocco, 2001 (Eds. G. Giacomelli et al.), Kluwer Acc. Publ., NATO Science Series, Vol. 42, p. 181.
- [10] G.L. Fogli et al., Phys. Rev. D 60 (1999) 053006. M.C. Gonzalez-Garcia and M. Maltoni, Phys. Rev. D 70 (2004) 033010.
- [11] S.R. Coleman and S.L. Glashow, Phys. Lett. B 405 (1997) 249; Phys. Rev. D 59 (1999) 116008.
- [12] S.L. Glashow, hep-ph/0407087.
- [13] Y. Ashie et al., Phys. Rev. Lett. 93 (2004) 101801.
- [14] S. Cecchini et al., Astropart. Phys. 21 (2004) 183; Astropart. Phys. 21 (2004) 35.
- [15] M. Gasperini et al., Phys. Rev. D 38 (1988) 2635.
- [16] A. De Gouvea et al., Nucl. Phys. B 623 (2002) 395.
- [17] G. Battistoni et al., Phys. Lett. B. 615 (2005) 14.
- [18] S. Ahlen, et al., Nucl. Instr. Meth. A 324 (1993) 337. M. Ambrosio, et al., Nucl. Instr. Meth. A 486 (2002) 663.
- [19] S. Ahlen et al., Phys. Lett. B 357 (1995) 481.
- [20] M. Ambrosio et al., Phys. Lett. B 478 (2000) 5.
- [21] V. Agrawal et al., Phys. Rev. D 53 (1996) 1314.
- [22] M. Honda et al., Phys. Rev. D 64 (2001) 053011.
- [23] M. Ambrosio et al., Nucl. Instr. Meth. A 492 (2002) 376.
- [24] M. Ambrosio et al., Phys. Lett. B 566 (2003) 35.
- [25] G. Giacomelli and M. Giorgini: in Proc. 7th School on Non-Accelerator Astroparticle Physics, Trieste, Italy, 2004 (Eds. R.A. Carrigan et al.), Singapore, 2005, p. 54; hep-ex/0504002.
- [26] G.J. Feldman and R.D. Cousins, Phys. Rev. D 57 (1998) 3873.
- [27] G. Battistoni et al.: in Proc. 28th International Cosmic Ray Conferences, Tsukuba, Japan, 2003 (Academic Press) p. 1399.
- [28] M. Honda et al., Phys. Rev. D 70 (2004) 043008.