K. Abe
High Energy Accelerator Research Organization (KEK), Tsukuba
K. Abe
Tohoku Gakuin University, Tagajo
I. Adachi
High Energy Accelerator Research Organization (KEK), Tsukuba
H. Aihara
Department of Physics, University of Tokyo, Tokyo
K. Aoki
Nagoya University, Nagoya
K. Arinstein
Budker Institute of Nuclear Physics, Novosibirsk
Y. Asano
University of Tsukuba, Tsukuba
T. Aso
Toyama National College of Maritime Technology, Toyama
V. Aulchenko
Budker Institute of Nuclear Physics, Novosibirsk
T. Aushev
Institute for Theoretical and Experimental Physics, Moscow
T. Aziz
Tata Institute of Fundamental Research, Bombay
S. Bahinipati
University of Cincinnati, Cincinnati, Ohio 45221
A. M. Bakich
University of Sydney, Sydney NSW
V. Balagura
Institute for Theoretical and Experimental Physics, Moscow
Y. Ban
Peking University, Beijing
S. Banerjee
Tata Institute of Fundamental Research, Bombay
E. Barberio
University of Melbourne, Victoria
M. Barbero
University of Hawaii, Honolulu, Hawaii 96822
A. Bay
Swiss Federal Institute of Technology of Lausanne, EPFL, Lausanne
I. Bedny
Budker Institute of Nuclear Physics, Novosibirsk
K. Belous
Institute of High Energy Physics, Protvino
U. Bitenc
J. Stefan Institute, Ljubljana
I. Bizjak
J. Stefan Institute, Ljubljana
S. Blyth
National Central University, Chung-li
A. Bondar
Budker Institute of Nuclear Physics, Novosibirsk
A. Bozek
H. Niewodniczanski Institute of Nuclear Physics, Krakow
M. Bračko
High Energy Accelerator Research Organization (KEK), Tsukuba
University of Maribor, Maribor
J. Stefan Institute, Ljubljana
J. Brodzicka
H. Niewodniczanski Institute of Nuclear Physics, Krakow
T. E. Browder
University of Hawaii, Honolulu, Hawaii 96822
M.-C. Chang
Tohoku University, Sendai
P. Chang
Department of Physics, National Taiwan University, Taipei
Y. Chao
Department of Physics, National Taiwan University, Taipei
A. Chen
National Central University, Chung-li
K.-F. Chen
Department of Physics, National Taiwan University, Taipei
W. T. Chen
National Central University, Chung-li
B. G. Cheon
Chonnam National University, Kwangju
C.-C. Chiang
Department of Physics, National Taiwan University, Taipei
R. Chistov
Institute for Theoretical and Experimental Physics, Moscow
S.-K. Choi
Gyeongsang National University, Chinju
Y. Choi
Sungkyunkwan University, Suwon
Y. K. Choi
Sungkyunkwan University, Suwon
A. Chuvikov
Princeton University, Princeton, New Jersey 08544
S. Cole
University of Sydney, Sydney NSW
J. Dalseno
University of Melbourne, Victoria
M. Danilov
Institute for Theoretical and Experimental Physics, Moscow
M. Dash
Virginia Polytechnic Institute and State University, Blacksburg, Virginia 24061
L. Y. Dong
Institute of High Energy Physics, Chinese Academy of Sciences, Beijing
R. Dowd
University of Melbourne, Victoria
J. Dragic
High Energy Accelerator Research Organization (KEK), Tsukuba
A. Drutskoy
University of Cincinnati, Cincinnati, Ohio 45221
S. Eidelman
Budker Institute of Nuclear Physics, Novosibirsk
Y. Enari
Nagoya University, Nagoya
D. Epifanov
Budker Institute of Nuclear Physics, Novosibirsk
F. Fang
University of Hawaii, Honolulu, Hawaii 96822
S. Fratina
J. Stefan Institute, Ljubljana
H. Fujii
High Energy Accelerator Research Organization (KEK), Tsukuba
M. Fujikawa
Nara Women’s University, Nara
N. Gabyshev
Budker Institute of Nuclear Physics, Novosibirsk
A. Garmash
Princeton University, Princeton, New Jersey 08544
T. Gershon
High Energy Accelerator Research Organization (KEK), Tsukuba
A. Go
National Central University, Chung-li
G. Gokhroo
Tata Institute of Fundamental Research, Bombay
P. Goldenzweig
University of Cincinnati, Cincinnati, Ohio 45221
B. Golob
University of Ljubljana, Ljubljana
J. Stefan Institute, Ljubljana
A. Gorišek
J. Stefan Institute, Ljubljana
M. Grosse Perdekamp
RIKEN BNL Research Center, Upton, New York 11973
H. Guler
University of Hawaii, Honolulu, Hawaii 96822
R. Guo
National Kaohsiung Normal University, Kaohsiung
J. Haba
High Energy Accelerator Research Organization (KEK), Tsukuba
K. Hara
High Energy Accelerator Research Organization (KEK), Tsukuba
T. Hara
Osaka University, Osaka
Y. Hasegawa
Shinshu University, Nagano
N. C. Hastings
Department of Physics, University of Tokyo, Tokyo
K. Hasuko
RIKEN BNL Research Center, Upton, New York 11973
K. Hayasaka
Nagoya University, Nagoya
H. Hayashii
Nara Women’s University, Nara
M. Hazumi
High Energy Accelerator Research Organization (KEK), Tsukuba
T. Higuchi
High Energy Accelerator Research Organization (KEK), Tsukuba
L. Hinz
Swiss Federal Institute of Technology of Lausanne, EPFL, Lausanne
T. Hojo
Osaka University, Osaka
T. Hokuue
Nagoya University, Nagoya
Y. Hoshi
Tohoku Gakuin University, Tagajo
K. Hoshina
Tokyo University of Agriculture and Technology, Tokyo
S. Hou
National Central University, Chung-li
W.-S. Hou
Department of Physics, National Taiwan University, Taipei
Y. B. Hsiung
Department of Physics, National Taiwan University, Taipei
Y. Igarashi
High Energy Accelerator Research Organization (KEK), Tsukuba
T. Iijima
Nagoya University, Nagoya
K. Ikado
Nagoya University, Nagoya
A. Imoto
Nara Women’s University, Nara
K. Inami
Nagoya University, Nagoya
A. Ishikawa
High Energy Accelerator Research Organization (KEK), Tsukuba
H. Ishino
Tokyo Institute of Technology, Tokyo
K. Itoh
Department of Physics, University of Tokyo, Tokyo
R. Itoh
High Energy Accelerator Research Organization (KEK), Tsukuba
M. Iwasaki
Department of Physics, University of Tokyo, Tokyo
Y. Iwasaki
High Energy Accelerator Research Organization (KEK), Tsukuba
C. Jacoby
Swiss Federal Institute of Technology of Lausanne, EPFL, Lausanne
C.-M. Jen
Department of Physics, National Taiwan University, Taipei
R. Kagan
Institute for Theoretical and Experimental Physics, Moscow
H. Kakuno
Department of Physics, University of Tokyo, Tokyo
J. H. Kang
Yonsei University, Seoul
J. S. Kang
Korea University, Seoul
P. Kapusta
H. Niewodniczanski Institute of Nuclear Physics, Krakow
S. U. Kataoka
Nara Women’s University, Nara
N. Katayama
High Energy Accelerator Research Organization (KEK), Tsukuba
H. Kawai
Chiba University, Chiba
N. Kawamura
Aomori University, Aomori
T. Kawasaki
Niigata University, Niigata
S. Kazi
University of Cincinnati, Cincinnati, Ohio 45221
N. Kent
University of Hawaii, Honolulu, Hawaii 96822
H. R. Khan
Tokyo Institute of Technology, Tokyo
A. Kibayashi
Tokyo Institute of Technology, Tokyo
H. Kichimi
High Energy Accelerator Research Organization (KEK), Tsukuba
H. J. Kim
Kyungpook National University, Taegu
H. O. Kim
Sungkyunkwan University, Suwon
J. H. Kim
Sungkyunkwan University, Suwon
S. K. Kim
Seoul National University, Seoul
S. M. Kim
Sungkyunkwan University, Suwon
T. H. Kim
Yonsei University, Seoul
K. Kinoshita
University of Cincinnati, Cincinnati, Ohio 45221
N. Kishimoto
Nagoya University, Nagoya
S. Korpar
University of Maribor, Maribor
J. Stefan Institute, Ljubljana
Y. Kozakai
Nagoya University, Nagoya
P. Križan
University of Ljubljana, Ljubljana
J. Stefan Institute, Ljubljana
P. Krokovny
High Energy Accelerator Research Organization (KEK), Tsukuba
T. Kubota
Nagoya University, Nagoya
R. Kulasiri
University of Cincinnati, Cincinnati, Ohio 45221
C. C. Kuo
National Central University, Chung-li
H. Kurashiro
Tokyo Institute of Technology, Tokyo
E. Kurihara
Chiba University, Chiba
A. Kusaka
Department of Physics, University of Tokyo, Tokyo
A. Kuzmin
Budker Institute of Nuclear Physics, Novosibirsk
Y.-J. Kwon
Yonsei University, Seoul
J. S. Lange
University of Frankfurt, Frankfurt
G. Leder
Institute of High Energy Physics, Vienna
S. E. Lee
Seoul National University, Seoul
Y.-J. Lee
Department of Physics, National Taiwan University, Taipei
T. Lesiak
H. Niewodniczanski Institute of Nuclear Physics, Krakow
J. Li
University of Science and Technology of China, Hefei
A. Limosani
High Energy Accelerator Research Organization (KEK), Tsukuba
S.-W. Lin
Department of Physics, National Taiwan University, Taipei
D. Liventsev
Institute for Theoretical and Experimental Physics, Moscow
J. MacNaughton
Institute of High Energy Physics, Vienna
G. Majumder
Tata Institute of Fundamental Research, Bombay
F. Mandl
Institute of High Energy Physics, Vienna
D. Marlow
Princeton University, Princeton, New Jersey 08544
H. Matsumoto
Niigata University, Niigata
T. Matsumoto
Tokyo Metropolitan University, Tokyo
A. Matyja
H. Niewodniczanski Institute of Nuclear Physics, Krakow
Y. Mikami
Tohoku University, Sendai
W. Mitaroff
Institute of High Energy Physics, Vienna
K. Miyabayashi
Nara Women’s University, Nara
H. Miyake
Osaka University, Osaka
H. Miyata
Niigata University, Niigata
Y. Miyazaki
Nagoya University, Nagoya
R. Mizuk
Institute for Theoretical and Experimental Physics, Moscow
D. Mohapatra
Virginia Polytechnic Institute and State University, Blacksburg, Virginia 24061
G. R. Moloney
University of Melbourne, Victoria
T. Mori
Tokyo Institute of Technology, Tokyo
A. Murakami
Saga University, Saga
T. Nagamine
Tohoku University, Sendai
Y. Nagasaka
Hiroshima Institute of Technology, Hiroshima
T. Nakagawa
Tokyo Metropolitan University, Tokyo
I. Nakamura
High Energy Accelerator Research Organization (KEK), Tsukuba
E. Nakano
Osaka City University, Osaka
M. Nakao
High Energy Accelerator Research Organization (KEK), Tsukuba
H. Nakazawa
High Energy Accelerator Research Organization (KEK), Tsukuba
Z. Natkaniec
H. Niewodniczanski Institute of Nuclear Physics, Krakow
K. Neichi
Tohoku Gakuin University, Tagajo
S. Nishida
High Energy Accelerator Research Organization (KEK), Tsukuba
O. Nitoh
Tokyo University of Agriculture and Technology, Tokyo
S. Noguchi
Nara Women’s University, Nara
T. Nozaki
High Energy Accelerator Research Organization (KEK), Tsukuba
A. Ogawa
RIKEN BNL Research Center, Upton, New York 11973
S. Ogawa
Toho University, Funabashi
T. Ohshima
Nagoya University, Nagoya
T. Okabe
Nagoya University, Nagoya
S. Okuno
Kanagawa University, Yokohama
S. L. Olsen
University of Hawaii, Honolulu, Hawaii 96822
Y. Onuki
Niigata University, Niigata
W. Ostrowicz
H. Niewodniczanski Institute of Nuclear Physics, Krakow
H. Ozaki
High Energy Accelerator Research Organization (KEK), Tsukuba
P. Pakhlov
Institute for Theoretical and Experimental Physics, Moscow
H. Palka
H. Niewodniczanski Institute of Nuclear Physics, Krakow
C. W. Park
Sungkyunkwan University, Suwon
H. Park
Kyungpook National University, Taegu
K. S. Park
Sungkyunkwan University, Suwon
N. Parslow
University of Sydney, Sydney NSW
L. S. Peak
University of Sydney, Sydney NSW
M. Pernicka
Institute of High Energy Physics, Vienna
R. Pestotnik
J. Stefan Institute, Ljubljana
M. Peters
University of Hawaii, Honolulu, Hawaii 96822
L. E. Piilonen
Virginia Polytechnic Institute and State University, Blacksburg, Virginia 24061
A. Poluektov
Budker Institute of Nuclear Physics, Novosibirsk
F. J. Ronga
High Energy Accelerator Research Organization (KEK), Tsukuba
N. Root
Budker Institute of Nuclear Physics, Novosibirsk
M. Rozanska
H. Niewodniczanski Institute of Nuclear Physics, Krakow
H. Sahoo
University of Hawaii, Honolulu, Hawaii 96822
M. Saigo
Tohoku University, Sendai
S. Saitoh
High Energy Accelerator Research Organization (KEK), Tsukuba
Y. Sakai
High Energy Accelerator Research Organization (KEK), Tsukuba
H. Sakamoto
Kyoto University, Kyoto
H. Sakaue
Osaka City University, Osaka
T. R. Sarangi
High Energy Accelerator Research Organization (KEK), Tsukuba
M. Satapathy
Utkal University, Bhubaneswer
N. Sato
Nagoya University, Nagoya
N. Satoyama
Shinshu University, Nagano
T. Schietinger
Swiss Federal Institute of Technology of Lausanne, EPFL, Lausanne
O. Schneider
Swiss Federal Institute of Technology of Lausanne, EPFL, Lausanne
P. Schönmeier
Tohoku University, Sendai
J. Schümann
Department of Physics, National Taiwan University, Taipei
C. Schwanda
Institute of High Energy Physics, Vienna
A. J. Schwartz
University of Cincinnati, Cincinnati, Ohio 45221
T. Seki
Tokyo Metropolitan University, Tokyo
K. Senyo
Nagoya University, Nagoya
R. Seuster
University of Hawaii, Honolulu, Hawaii 96822
M. E. Sevior
University of Melbourne, Victoria
M. Shapkin
Institute of High Energy Physics, Protvino
T. Shibata
Niigata University, Niigata
H. Shibuya
Toho University, Funabashi
J.-G. Shiu
Department of Physics, National Taiwan University, Taipei
B. Shwartz
Budker Institute of Nuclear Physics, Novosibirsk
V. Sidorov
Budker Institute of Nuclear Physics, Novosibirsk
J. B. Singh
Panjab University, Chandigarh
A. Sokolov
Institute of High Energy Physics, Protvino
A. Somov
University of Cincinnati, Cincinnati, Ohio 45221
N. Soni
Panjab University, Chandigarh
R. Stamen
High Energy Accelerator Research Organization (KEK), Tsukuba
S. Stanič
Nova Gorica Polytechnic, Nova Gorica
M. Starič
J. Stefan Institute, Ljubljana
A. Sugiyama
Saga University, Saga
K. Sumisawa
High Energy Accelerator Research Organization (KEK), Tsukuba
T. Sumiyoshi
Tokyo Metropolitan University, Tokyo
S. Suzuki
Saga University, Saga
S. Y. Suzuki
High Energy Accelerator Research Organization (KEK), Tsukuba
O. Tajima
High Energy Accelerator Research Organization (KEK), Tsukuba
N. Takada
Shinshu University, Nagano
F. Takasaki
High Energy Accelerator Research Organization (KEK), Tsukuba
K. Tamai
High Energy Accelerator Research Organization (KEK), Tsukuba
N. Tamura
Niigata University, Niigata
K. Tanabe
Department of Physics, University of Tokyo, Tokyo
M. Tanaka
High Energy Accelerator Research Organization (KEK), Tsukuba
G. N. Taylor
University of Melbourne, Victoria
Y. Teramoto
Osaka City University, Osaka
X. C. Tian
Peking University, Beijing
K. Trabelsi
University of Hawaii, Honolulu, Hawaii 96822
Y. F. Tse
University of Melbourne, Victoria
T. Tsuboyama
High Energy Accelerator Research Organization (KEK), Tsukuba
T. Tsukamoto
High Energy Accelerator Research Organization (KEK), Tsukuba
K. Uchida
University of Hawaii, Honolulu, Hawaii 96822
Y. Uchida
High Energy Accelerator Research Organization (KEK), Tsukuba
S. Uehara
High Energy Accelerator Research Organization (KEK), Tsukuba
T. Uglov
Institute for Theoretical and Experimental Physics, Moscow
K. Ueno
Department of Physics, National Taiwan University, Taipei
Y. Unno
High Energy Accelerator Research Organization (KEK), Tsukuba
S. Uno
High Energy Accelerator Research Organization (KEK), Tsukuba
P. Urquijo
University of Melbourne, Victoria
Y. Ushiroda
High Energy Accelerator Research Organization (KEK), Tsukuba
G. Varner
University of Hawaii, Honolulu, Hawaii 96822
K. E. Varvell
University of Sydney, Sydney NSW
S. Villa
Swiss Federal Institute of Technology of Lausanne, EPFL, Lausanne
C. C. Wang
Department of Physics, National Taiwan University, Taipei
C. H. Wang
National United University, Miao Li
M.-Z. Wang
Department of Physics, National Taiwan University, Taipei
M. Watanabe
Niigata University, Niigata
Y. Watanabe
Tokyo Institute of Technology, Tokyo
L. Widhalm
Institute of High Energy Physics, Vienna
C.-H. Wu
Department of Physics, National Taiwan University, Taipei
Q. L. Xie
Institute of High Energy Physics, Chinese Academy of Sciences, Beijing
B. D. Yabsley
Virginia Polytechnic Institute and State University, Blacksburg, Virginia 24061
A. Yamaguchi
Tohoku University, Sendai
H. Yamamoto
Tohoku University, Sendai
S. Yamamoto
Tokyo Metropolitan University, Tokyo
Y. Yamashita
Nippon Dental University, Niigata
M. Yamauchi
High Energy Accelerator Research Organization (KEK), Tsukuba
Heyoung Yang
Seoul National University, Seoul
J. Ying
Peking University, Beijing
S. Yoshino
Nagoya University, Nagoya
Y. Yuan
Institute of High Energy Physics, Chinese Academy of Sciences, Beijing
Y. Yusa
Tohoku University, Sendai
H. Yuta
Aomori University, Aomori
S. L. Zang
Institute of High Energy Physics, Chinese Academy of Sciences, Beijing
C. C. Zhang
Institute of High Energy Physics, Chinese Academy of Sciences, Beijing
J. Zhang
High Energy Accelerator Research Organization (KEK), Tsukuba
L. M. Zhang
University of Science and Technology of China, Hefei
Z. P. Zhang
University of Science and Technology of China, Hefei
V. Zhilich
Budker Institute of Nuclear Physics, Novosibirsk
T. Ziegler
Princeton University, Princeton, New Jersey 08544
D. Zürcher
Swiss Federal Institute of Technology of Lausanne, EPFL, Lausanne
Abstract
We report a measurement of the branching fraction
for and the invariant mass spectrum
of the resulting system
using of data recorded
by the Belle detector at the KEKB collider.
The branching fraction obtained is
,
where the first error is statistical and the second is systematic.
The unfolded mass spectrum
is used to determine resonance parameters for the
, , and mesons.
We also use this spectrum to estimate the hadronic contribution
to the anomalous magnetic moment of the muon.
pacs:
13.40.Gp, 13.35.Dx, 14.60.Fg
††preprint: BELLE-CONF-0508EPS05-480
I Introduction
Among the decay channels of the lepton,
has the largest branching fraction. The decay is dominated by
intermediate resonances and thus provides information on the
properties of the , , and
mesons and their interference.
Since leptons do not participate in the strong interaction,
hadronic decays provide a clean environment for
studying the dynamics of hadronic states
in an interesting energy range dominated by resonances.
Under the Conserved Vector Current (CVC) theorem,
the mass spectrum in this range
can be used to improve the theoretical error
on the anomalous magnetic moment of the muon
. A recent review of the
calculations of is given in Ref. CM .
It is known that the theoretical error on is dominated by
the (leading-order) hadronic contribution
, given by the hadronic vacuum polarization.
This contribution cannot be evaluated within the framework of
perturbative QCD; however, it can be evaluated from a
measurement of the cross section for annihilation
to hadrons DEHZ ; HMNT . Alternatively,
CVC
relates the properties of
the system produced
in to those of the
system produced in decay;
thus, using CVC and correcting for
isospin-violating effects,
data have also been used to obtain a
more precise
prediction for DH98 ; DEHZ .
Recently, data on
has become available from the CMD-2, KLOE,
and SND experiments CMD03 ; CMD2002 ; KLOE2005 ; SND2005 .
Data on decays is available from the
ALEPH ALEPH97 ; DATAU02 , CLEO CLEO2000 ,
and OPAL OPAL1999 experiments. The most recent evaluation
of the hadronic contribution to using
data gives DAV2005
,
while that using the lepton data
where applicable gives
.
The experimental value
is dominated by the BNL E821 measurement BNL2004
.
These differences correspond to 2.7 and 0.9 standard
deviations, respectively, and thus
there is a significant difference
between the -based and
-based predictions.
To clarify the situation,
more data for and for
decays are needed.
In this paper we present a high-statistics measurement
of the mass spectrum produced in
decays CC using
data collected by the Belle experiment at the
KEKB collider operating at a
center-of-mass (CM) energy of 10.6 GeV.
The data sample is about 50 times larger
than those of previous experiments.
II Basic formulae
The differential decay rate for
can be expressed as
(1)
where is the invariant-mass-squared of the system,
is the vector spectral function
characterizing the system,
denotes the CKM mixing matrix element, and
accounts for electroweak radiative corrections.
and
are the branching fractions for
and
, respectively.
The corresponding spectral function can
be obtained from the cross section:
(2)
where is the CM energy squared and
is the fine-structure constant at .
Up to isospin-violating effects, CVC allows one to
relate the spectral function from decays
to the isovector part of the spectral function
Weakf :
(3)
The mass spectrum of the two-pion system is typically expressed
in terms of pion form factors; these are useful for comparing
resonance shapes in the charged and neutral two-pion systems.
The spectral function is related to the
form factor via
(4)
where
is the pion velocity in the () rest-system.
The velocities are explicitly given by
and .
The leading-order hadronic contribution to the muon anomalous
magnetic moment () is related to the
annihilation cross section via the dispersion integral
(5)
where is the invariant-mass-squared of the two-pion system, and
.
The kernel is a smooth function increasing from 0.63 at
the threshold to unity at KERNEL .
Due to the dependence, hadronic final states at low energy
dominate the contribution to ;
in fact about 70% of is due to the two-pion
state having .
Consequently, the spectral function in
data is
useful to obtain predictions for .
Using Eqs. (2) and (3)
to evaluate (5) we obtain
(6)
where ””
indicates the integral above the region.
To determine ,
one must measure both the branching fraction for
and the mass spectrum .
Here we report new measurements for both of these.
III Data Sample and Selection Criteria
The data sample used was collected by the Belle detector at
the KEKB energy-asymmetric collider KEKB .
It is based on an integrated luminosity of
recorded at a CM energy of 10.6 GeV.
The Belle detector is a large-solid-angle magnetic spectrometer
consisting of a three-layer silicon-vertex detector (SVD), a 50-layer
central drift chamber (CDC) for charged particle tracking
and specific ionization measurement (),
an array of aerogel threshold Cerenkov counters (ACC),
a barrel-like arrangement of time-of-flight scintillation counters (TOF),
and an electromagnetic calorimeter (ECL) comprised of CsI(Tl) crystals
located inside a superconducting solenoid coil that provides a
1.5 T magnetic field. An iron flux-return located outside of
the coil is instrumented
to identify muons and to detect mesons (KLM).
The detector is described in detail elsewhere Belle .
To study backgrounds and determine selection criteria,
we perform Monte Carlo (MC) simulation studies
for various processes. The KORALB/TAUOLA
program TAUOLA ; TAUOLA2004 is used for -pair
generation,
the QQ generator QQ for and continuum
processes, the BHLUMI BHLUMI program for radiative Bhabha events,
the KKMC KKMC program for radiative -pair
events, and the
AAFHB AAFHB program for two-photon processes.
The BHLUMI and KKMC programs include higher-order radiative
corrections and are among the most accurate programs available.
The detector response is simulated by a GEANT-based program GEANT .
In order to realistically simulate beam-induced background,
detector hits taken from randomly-triggered data are added
to wire hits in the CDC and to energy deposits in the ECL.
III.1 pair selection
The event selection consists of two steps.
Initially, a sample of generic
events are
selected with relatively loose criteria.
From this sample
decays are then selected.
The number of generic events is used to determine
the branching fraction.
Generic events are selected by requiring that
the number of charged tracks in an event
be two or four with zero net charge;
that each track have a momentum
transverse to the beam axis ()
of greater than 0.1 GeV/; and that
each track extrapolate to the interaction point (IP)
within cm transversely
and within cm along the beam direction.
To suppress background from Bhabha and events,
the reconstructed CM energies and
the sum of the momenta of
the two leading tracks are required to be less
than 9.0 GeV/. The maximum among the tracks is
required to be greater than 0.5 GeV/.
Beam-related background is rejected by requiring that the position
of the reconstructed event vertex be less than 0.5 cm from the IP
in the transverse direction and less than 2.5 cm from the IP
along the beam direction.
The polar angle of the leading particle with respect to the
beam axis () in the CM frame is required
to be in the fiducial region of the detector:
.
To reduce remaining background from Bhabha, ,
and two-photon events,
a cut is applied in the two-dimensional plane of the
missing-mass and the direction of missing momentum
in CM , where
is evaluated from the four-momenta
of the measured tracks and photons:
. In this expression
is the four-momentum of the initial system.
Each photon (reconstructed from clusters in the calorimeter) must
be separated
from the nearest track projection by at least 20 cm
and have an energy greater than 0.05 GeV in the
central part
(), and 0.1 GeV in the endcap
part ( and ).
Photons measured at the
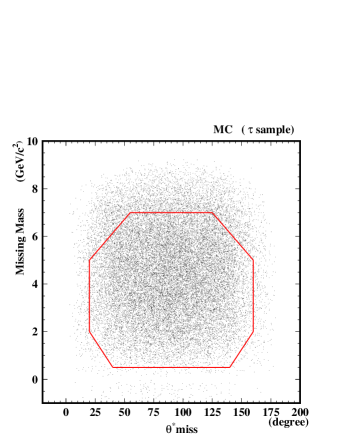
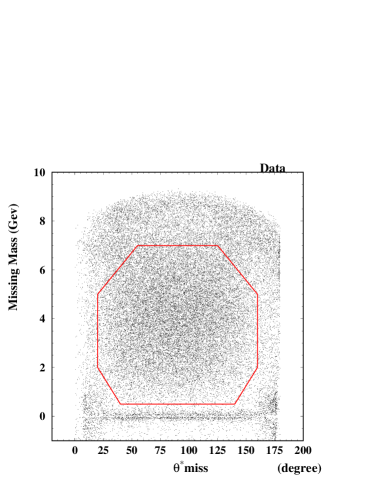
detector edge are rejected. A scatterplot of
vs.
for data is shown in Fig. 1.
In this plot, events at are due to radiative Bhabha
events and ,
while events in the high- region are from two-photon
processes.
Events within the octagonal region
are selected as candidates.
Figure 1: Missing mass () versus the polar
angle for the direction
of the missing momentum ().
The left plot shows MC
events, and the right plot
shows the data. Events inside the octagonal region are selected
as -pair candidates.
Candidate events are divided into two hemispheres in the
CM frame with respect to the highest momentum particle, and
the remaining background from annihilation
processes is suppressed by selecting events with low
multiplicity as characterized by the quantity
,
where and are the numbers
of tracks and photons in hemisphere . We require
.
Finally, in order to eliminate
Bhabha events in which
one or both electrons produce a shower in
material near the interaction region,
the acoplanarity angle between
the first and second highest momentum tracks is required
to be ,
where
is defined as the two-track acollinearity in azimuth.
After applying all selection criteria,
-pairs survive.
The background is estimated using MC simulation.
The dominant source is from continuum processes
and amounts to 5.5%.
Backgrounds from Bhabha
events, , and two-photon
events are estimated to be
0.6%, 0.4%, and 0.8%, respectively.
Other sources are found to be small. These background estimates are
checked by comparing the number of events in control samples.
The control samples for continuum,
Bhabha + , and two-photon processes are
high multiplicity events having or
or , respectively. The differences
in event yields for these control samples and the
MC predictions (5-10%) are included as
systematic errors for the results discussed in latter sections.
III.2 candidate selection
Within the -pair sample, decays are reconstructed
by requiring that there be both one charged track
and one in one hemisphere.
The candidate is selected based on the normalized
invariant mass
,
where
is the mass resolution of the system.
The value of ranges from 0.005 GeV to 0.008 GeV,
depending on the momentum and polar angle.
Pairs of photons with are considered as
candidates.
To keep beam-related background at a negligible level,
we require that the CM momentum of the be greater than
0.25 GeV/ and the photon CM energy be greater than 0.08 GeV.
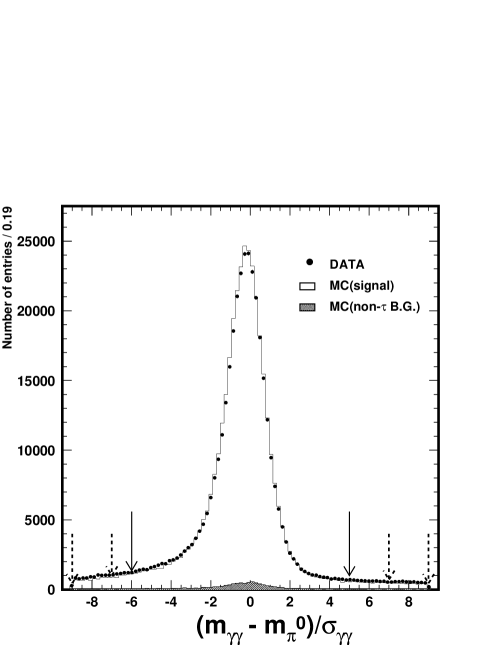
The distribution in the normalized di-photon invariant mass
for the selected sample, where there are one charged track and one candidate
in one
hemisphere,
is shown in Fig. 2.
The lower-side tail of the distribution is
primarily due to
rear and transverse leakage of electromagnetic showers out of the
CsI(Tl) crystals and the conversion
of the photons in the material located in front of the crystals.
Good agreement between data and Monte-Carlo indicates that
these effects are properly
modeled by the Monte-Carlo simulation.
We define the interval as the
signal region.
Spurious background
is small and estimated from the sideband regions
.
To reduce feed-down background from multi-
decays such as
( ),
signal candidates (in a hemisphere) are rejected
if there are additional ’s
in the same hemisphere with energy greater than 0.2 GeV.
Figure 2:
Normalized invariant mass ()
spectrum in the data(points) and the MC event(histogram),
for the sample described in the text.
The plotted data correspond to 6.1% of the full data used in this analysis.
The arrows indicate the signal region
and the sideband regions
. The sideband regions
are used to subtract fake- background.
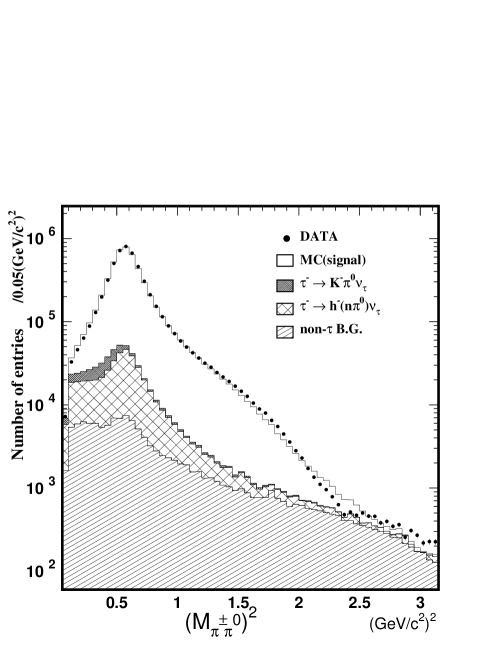
The invariant-mass-squared () spectrum
is obtained assuming the pion mass for the charged track; it is shown
in Fig. 3 along with the MC prediction. To improve the
energy resolution of the , a mass constraint is imposed.
The amount of a spurious background
depends on the region, varying from 4% to 15%.
(This is subtracted using sidebands.)
The final sample contains candidates
after the background subtraction, where denotes
or . This sample is 50 times larger than those of previous
studies.
Feed-down background arises mainly from multi- modes
such as (5.5%)
and (0.48%).
Including other modes, the total feed-down background is
%.
The error listed includes statistical uncertainty
as well as the uncertainty in relevant branching fractions.
Background from non- processes is negligible,
except that from continuum processes.
The amount of continuum background is
estimated from MC simulation
to be . The normalization
of the continuum MC is checked using data
in the high-mass region .
The MC simulation of decays is based on the TAUOLA
program TAUOLA2004 . A small difference observed
between data and MC
in Fig.3 for
is attributed to the resonance, which
is not included in the current TAUOLA program.
Figure 3:
Invariant-mass-squared () distribution for .
The solid circles with error bars
represent the data, and
the histogram represents MC simulation (signal + background).
The open area shows the contribution from ;
the narrow cross-hatched
area shows that from ;
the wide cross-hatched
area shows that from ;
and the striped area
shows that from continuum
and other non- processes.
IV Measurement of the Branching Fraction
IV.1 Formula
The branching fraction for
() is determined
by dividing the signal yield by the number of
selected generic
-pairs :
(7)
In this formula, is the background fraction
in the sample,
is the efficiency of the -pair selection,
is the efficiency for
decays to pass
the -pair selection,
and is the efficiency for
decays
satisfying the -pair selection
to pass the selection.
The product
is the overall detection efficiency for the final state.
The parameter is the fraction of
candidates coming from other decay modes, and
is the fraction coming from non-
processes. In this formula, several common uncertainties such as
that in the luminosity, that in the cross section for
-pair production, that in the trigger efficiency, and that
in the selection efficiency cancel in the ratio.
The value for each factor is listed in Table 1 along
with the statistical error.
Parameter
Values
Table 1: Values of parameters used for the
branching fraction measurement along with statistical errors.
IV.2 Systematic uncertainty
The sources of systematic uncertainty are listed in Table 2.
The uncertainty in the tracking efficiency is estimated using
decays to be
1% per track.
A large part of this uncertainty cancels in the ratio of
Eq.(7); the resulting uncertainty from this source is
%.
The detection efficiency is
obtained from the ratio of
to decays, in
which the branching fractions are known
precisely. The uncertainty is estimated to be
for a momentum less than 1.0 GeV/.
As a consistency check, the branching fraction is re-measured
after changing the photon threshold from
0.05 GeV to 0.10 GeV; the difference
in is only
0.10%.
The uncertainty in background in
the non- sample
is estimated from the control sample
above the mass region,
while the uncertainty
in feed-down
background
is obtained
from the uncertainty in
and
branching fractions.
Source of uncertainty
(%)
Tracking efficiency
0.12
efficiency
0.25
Background for
0.09
Feed-down background for
0.04
Non- background for
0.05
veto
0.05
Trigger
0.08
MC statistics
0.04
Total
0.31
Table 2: Systematic uncertainties for the branching fraction.
The veto of additional ’s is required in the event
selection to reduce background from multi- decay channels.
However, it also vetoes signal if there are photons radiated in
the initial or final state. In addition, photon candidates
can
also appear due to electromagnetic shower fragments and/or
mis-reconstructed of electrons.
The uncertainty from these sources is estimated by
changing the veto threshold by
GeV; the resulting change in
is only
%.
Signal events are flagged by several trigger conditions
that require two or more CDC tracks with associated TOF hits,
ECL clusters, or a significant sum of energy in the ECL.
This redundancy
allows one to monitor the efficiency of each trigger requirement.
The uncertainty arising from the trigger is estimated by
assuming there is a % uncertainty in the track and
energy trigger efficiencies, which is the maximum variation
measured during experimental running. The resulting uncertainty
on is small (0.08%) since the
trigger efficiency is high (97%).
where the first error is statistical and the second is systematic.
Subtracting the small kaon-channel branching fraction listed in the
PDG PDG2004 []
gives a branching fraction of
(9)
This result is in good agreement with previous measurements,
as shown in Table 3. Our statistical error is
significantly lower than those of the other measurements,
while our systematic error is similar to those of the others
(except for the ALEPH result).
Table 3:
Branching fractions for measured
by various experiments.
V Measurement of the Mass Spectrum
In order to obtain the true mass spectrum,
one must correct for (1) background, (2) smearing due to finite
resolution and radiative effects, and (3) mass-dependent acceptance.
V.1 Background Correction
As noted earlier, background entering the sample
is small. The sidebands of the distribution
are used to estimate the fake contribution.
This background dominates at values of less
than about .
As seen in Fig. 3, feed-down background arises
from
and decays;
both backgrounds dominate at low values of .
In the high mass region, continuum background dominates.
For this analysis we did not use information
from particle identification (PID) detectors
to separate charged pions from kaons, as the
feed-down background is dominated by
rather than .
The distribution after subtracting this
background is shown in Fig. 4.
Figure 4:
Invariant-mass-squared () distribution for
after background subtraction.
V.2 Acceptance Corrections
The detector effects include -dependent
acceptance and bin-by-bin migration caused by the finite mass resolution.
We correct for these effects by performing an unfolding procedure. The
unfolding program used is that employed by the ALEPH experiment SVD .
In this program, the unfolding is based on the
Singular-Value-Decomposition (SVD) method SVD ,
in which the acceptance matrix is inverted
by limiting the number of singular values to
only those that are statistically significant.
The output of the program is the unfolded distribution and
its covariance matrix.
The correlation between the generated quantity
and the measured one
is shown in Fig. 5. The figure
shows a clear correlation between
and .
The resolution in is 0.005
in the low-mass region and
0.030 in the
high-mass region; thus the bin size chosen is
so that the off-diagonal
components of the acceptance matrix are small.
Figure 5:
Correlation between (vertical axis) and
(horizontal axis), the generated and
observed invariant masses squared of the
system in decay.
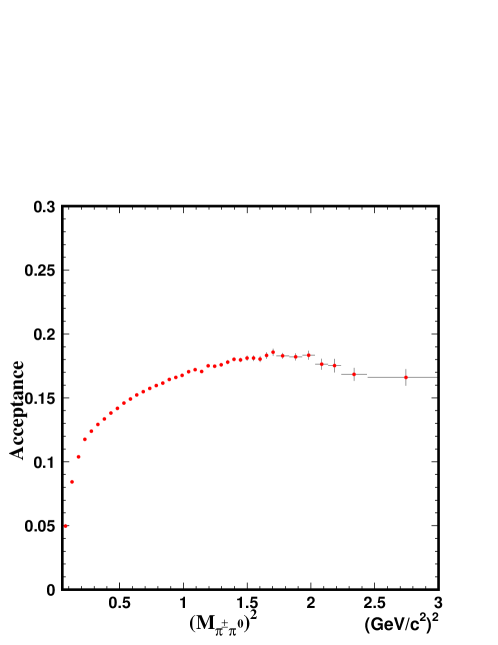
The acceptance as a function of is shown in
Fig. 6. The acceptance varies smoothly
and its average value is 17%. It decreases at low values
of due to the overlap of clusters
with the track projection at the calorimeter.
Figure 6: Acceptance as a function of , as determined
from MC simulation.
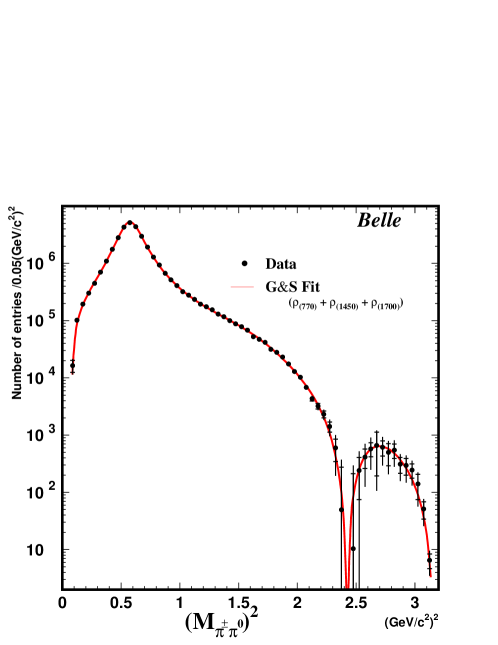
V.3 Results
The unfolded spectrum
is shown in Fig. 7.
The square roots of the diagonal components of the covariance
matrix are used as the errors.
The peak and the shoulder due to the
are clearly visible. The dip at is
caused by destructive interference between the
and resonances.
Figure 7: Fully-corrected distribution
for .
The solid curve is the
result of a fit to the Gounaris-Sakurai model with
, , and resonances.
All parameters are floated.
To obtain parameters for the , and
resonances, a fit using Breit-Wigner functions
is performed. Since the unfolded mass spectrum has bin-by-bin
correlations, the off-diagonal components of the covariance matrix
are included in the evaluation:
(10)
where is the measured value at the -th bin,
is the value of the function for parameters ,
and is the inverse of the covariance matrix.
In the fit, the dependence of the decay rate is given by
Eq. (1). The pion form factor in Eq. (4)
is parametrized with Breit-Wigner functions corresponding to the
, , and (1700)
resonances:
(11)
where the parameters and
(denoting the relative size of the two resonances) are
in general complex.
We use the Gounaris-Sakurai (GS) model GS for the
Breit-Wigner shape:
(12)
with an energy-dependent width
(13)
Here, is the pion
momentum in the rest frame.
The functions and are defined as
(14)
(15)
with
and
(16)
There are ten parameters in this formula:
the masses () and the widths () for the
, and resonances,
their relative amplitudes , , and their phases
and .
Parameter
Fit result
Fit result
(all free)
(fixed )
(degree)
(degree)
55/51
94/52
Table 4:
Results of fitting the distribution
for to the Gounaris-Sakurai model with
the , , and resonances.
The results for two cases, all parameters floated (the second column)
and fixed (the third column) are shown.
For both cases,
the first error is statistical and the second one is systematic.
The systematic errors include the uncertainty of the backgrounds,
unfolding, as well as the uncertainty of the photon energy scale.
All parameters are floated in the fit. When evaluating the ,
the 1% systematic uncertainty resulting from the unfolding procedure
is included in the diagonal part of the covariance matrix.
This uncertainty is estimated by applying the same unfolding procedure
to MC events and comparing the unfolded spectrum with the original.
The result of the fit is shown in Fig. 7
as the solid line; the values obtained for the parameters
are listed in Table 4.
The results are compared with the previous ALEPH measurements in
Table 5.
Table 5: Comparison of our fit results for
the , , and parameters with those
obtained by the ALEPH experimentALEPH05 .
The numbers in brackets indicate
the values fixed in the fit.
In the table, the first error is statistical and the second one is
systematic.
The main sources of systematic uncertainty are
the photon energy scale, the unfolding procedure,
and the background subtraction.
The uncertainty in the mass (0.3 MeV) is
mainly due to the uncertainty in the photon energy scale.
The uncertainty in background dominates for the parameters.
Our result for the mass of the
resonance agrees well
with the
ALEPH ALEPH05 and CLEOCLEO2000 results.
As can be seen from the second and third columns
of Table 5,
where
the interference angle or three parameters
are fixed, respectively,
as in the previous ALEPH ALEPH05 fit,
the values for and resonance parameters
are quite sensitive to the values of other parameters fixed in the fit.
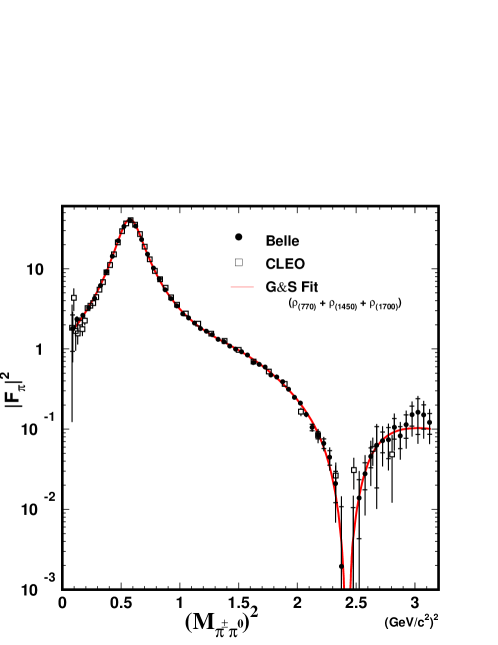
The results are shown in terms of the pion form factor squared
() in Figs. 8 and 9.
A dip caused by destructive interference between the and
is clearly visible.
For the first time production of the
in decays has been unambiguously demonstrated
and its parameters determined.
For comparison, the figures also show results from the
CLEO CLEO2000 and ALEPH ALEPH05 experiments,
respectively; there is good agreement with both data sets.
Figure 10 shows our data and that of
CLEO for the mass range 0.2–2.2 , where the
contribution to
is largest.
Figure 8: Pion form factor for .
The solid circles show the Belle result and the
open squares show the CLEO result CLEO2000 .
The error bars for the Belle data include both
statistical and systematic errors added in quadrature.
The solid curve is the
result of a fit to the Gounaris-Sakurai model with
the
, , and resonances,
where all parameters are floated.
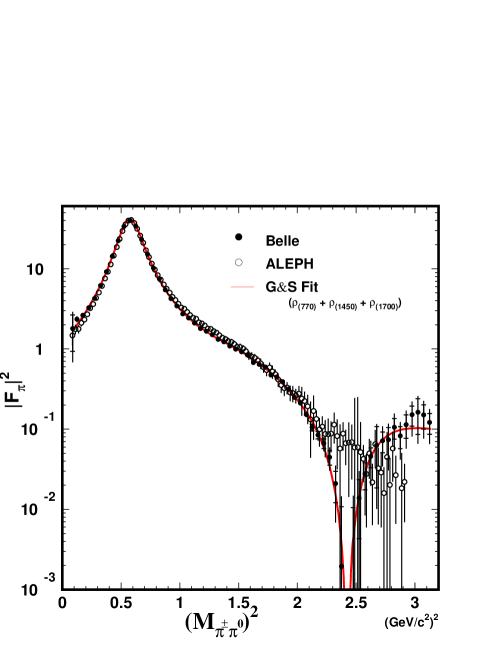
Figure 9: Pion form factor for .
The solid circles show the Belle result and the
open squares show the ALEPH result ALEPH05 .
The error bars for the Belle data include both
statistical and systematic errors added in quadrature.
The solid curve is the
result of a fit to the Gounaris-Sakurai model, where
all parameters are floated.
Figure 10:
Comparison of the pion form factor squared
measured
by Belle to that measured by CLEO CLEO2000
and ALEPH ALEPH05
experiments
in the
and mass region. Difference from the fit of
the Belle data divided by the fit value is plotted.
VI Evaluation of
Using the unfolded distribution
, the spectral function is obtained
by taking the inverse of Eq. (1):
(17)
The resulting function can be inserted into Eq. (6)
to obtain
the dominant low-mass contribution to
the hadronic part of the anomalous magnetic moment,
. This assumes the CVC relation (3)
holds.
There are several external parameters in these equations;
the values used for these are listed in Table 6.
For , , and ,
PDG PDG2004 values are used.
For the electroweak radiative correction ,
we use the recent value , which is
based on a consistent treatment of
the isospin-breaking correction ISB2001 ; DEHZ .
For the branching fraction,
our measurement is consistent with the world average given
in Ref. DATAU02 .
Including our result and the recent ALEPH
measurement, the new world average is
(18)
We use this new world average for the evaluation of
.
Table 6: Values of the external parameters and the
systematic errors for arising from
these sources.
The integration in Eq. (6) is carried out numerically
by taking the sum of the integrand evaluated at the center of each bin.
The statistical error in is calculated
including the off-diagonal elements of the covariance
matrix :
(19)
Because of uncertainties associated with the background
estimate and with the acceptance correction in the
lowest
mass region, the integration is carried out over the
mass range 0.50–1.80 .
VI.1 Systematic uncertainty
Systematic uncertainty in arises
from both external and internal sources. The errors
arising from external parameters are
summarized in Table 6; the total systematic
error from these sources is
(dominated by ).
The systematic error arising from internal sources (specific
to this measurement) are listed in Table 7.
There are two sources of background in the sample:
(i) feed-down from and
, and
(ii) non- background.
In the first case, the uncertainty in the branching fraction
is used to estimate the error.
In the second case,
the uncertainty in the background as estimated from the control
samples is assigned as the error.
As mentioned earlier, the fake- background
is subtracted using sideband events; the uncertainty
is determined by varying the signal and sideband regions.
Source
(0.50–1.80 )
Background:
non- ()
feed-down
feed-down
Energy scale
selection
veto
Efficiency:
charged track
Integration procedure
Total internal
1.04
Table 7: Systematic errors for arising from
internal sources (specific to this measurement).
The ratio of the branching fractions for the decays
and
is used to monitor
the efficiency.
It is found that the shape of the mass spectrum is insensitive
to uncertainty in the efficiency, as it is only
at the few % level.
Adding all individual errors in quadrature gives a total
error on arising from
internal sources of
.
To check the stability of , we perform
the following tests:
1.
The sample is divided into subsamples
based on the tag-side topology, i.e.,
one electron, one-prong, or three-prong.
The values of obtained from these
subsamples are consistent within the statistical errors.
2.
The sample is divided into subsamples based on the
running period, e.g., years 2000, 2001, or 2002.
Again, the values of obtained are
consistent within the statistical errors.
3.
The sample might be sensitive to the
requirement on the overlap region between
the projection of the charged track and clusters. To
estimate this sensitivity, we select events with a tighter isolation
requirement on ’s and on the track extrapolation:
50 cm instead of 20 cm.
The resulting variation in is small
and is included as an additional systematic error.
VII Results
The result for integrated over the mass range
0.50–1.80 is
where the first error is statistical and the second and third errors
are systematic errors arising from internal and external sources,
respectively.
In addition, there is a systematic uncertainty
caused by isospin violation effects arising
from - interference,
from the and mass difference, and from
radiative corrections (see Ref. ISB2001 ).
The overall correction is estimated to be
,
where the central value is taken from Ref. CLEO2000
and we enlarged the error according to the value in Table 5
of Ref. DEHZ ;
this correction is small because the threshold region is not included.
Applying this correction gives
where the first error is statistical, the second is
systematic, and the third arises from isospin violation.
This result can be compared to those from previous DEHZ
and experiments DAV2003 :
The first error includes both statistical and experimental systematic errors added in quadrature.
The second error in the result is due
to radiative corrections.
Our result agrees well with the -based result but is
noticeably higher than the result. This supports the
hypothesis that there is a difference between the mass spectra
of the systems produced in -decay and reactions.
In summary, we have studied the decay using high
statistics data
taken with the Belle detector at the KEKB collider.
The branching fraction is measured with 1.2% accuracy,
which is better than that in the previous experiments
(except for the ALEPH result).
In the unfolded mass spectrum, in addition to the
and mesons,
the production of the in
decays has been unambiguously demonstrated and its parameters determined.
The unfolded spectrum is used to evaluate
the 2 contribution to the muon anomalous magnetic
moment in the region
.
Our results agree well
with the previous based results but
are higher than the results.
Acknowledgments
We thank M. Davier and J. H. Kühn for
their advice and encouragement during this analysis.
We thank the KEKB accelerator group for the excellent
operation of the KEKB accelerator.
We acknowledge support from the Ministry of Education,
Culture, Sports, Science, and Technology of Japan
and the Japan Society for the Promotion of Science;
the Australian Research Council
and the Australian Department of Industry, Science and Resources;
the National Science Foundation of China under contract No. 10175071;
the Department of Science and Technology of India;
the BK21 program of the Ministry of Education of Korea
and the CHEP SRC program of the Korea Science and Engineering
Foundation;
the Polish State Committee for Scientific Research
under contract No. 2P03B 01324;
the Ministry of Science and Technology of the Russian Federation;
the Ministry of Education, Science and Sport of the Republic of
Slovenia;
the National Science Council and the Ministry of Education of Taiwan;
and the U.S. Department of Energy.
References
(1)
A. Czarnecki and W.J. Marciano, Phys. Rev. D 64, 013014 (2001);
A. Nyffeler, hep-ph/0305135 (unpublished);
E. Rafael, hep-ph/0208251 (unpublished);
M. Passera, J. Phys. G 31, R75 (2005).
(2)
M. Davier, S. Eidelman, A. Höcker and Z. Zhang,
Eur. Phys. J. C 27, 497 (2003).
(3)
K. Hagiwara, A.D. Martin, D. Nomura, and T. Teubner,
Phys. Lett. B 557, 69 (2003).
(4)
M. Davier and A. Höcker, Phys. Lett. B 435, 427 (1998).
(5)
R.R Akhmetshin et al.
(CMD-2 Collaboration),
Phys. Lett. B 578, 285 (2004).
(6)
R.R. Akhmetshin et al. (CMD-2 Collaboration),
Phys. Lett. B 527, 161 (2002).
(7)
A. Aloisio et al. (KLOE Collaboration),
Phys. Lett. B 606, 12 (2005).
(8)
M.N. Achasov et al. (SND Collaboration),
hep-ex/0506076.
(9) R. Barate et al. (ALEPH Collaboration),
Z. Phys. C 76, 15 (1997).
(10)
M. Davier, Nucl. Phys. B (Proc. Suppl.) 123, 135 (2003).
(11)
S. Anderson et al. (CLEO Collaboration),
Phys. Rev. D 61, 112002 (2000).
(12)
K. Ackerstaff et al. (OPAL Collaboration),
Eur. Phys. J. C 7, 571 (1999).
(13)
M. Davier, Nucl. Phys. B (Proc. Suppl.) 144, 250 (2005).
(14)
G.W. Bennett et al. (Muon g-2 Collaboration),
Phys. Rev. Lett. 92, 161802 (2004).
(15)
Throughout this paper,
the inclusion of the charge-conjugate decay mode is implied
unless stated otherwise.
(16)
The definition of the weak
spectral function(or form factor) used in this paper ()
differs by a factor of from the one
() used in the other literature:
.
See,
for example,
A.Z. Dubnikova, S. Dubnika and M.P. Rekalo, Czechoslovak Jour. Phys.,
43, 1057 (1993).
(17)
Using a variable defined as
is given by
(18)
S. Kurokawa and E. Kikutani, Nucl. Instr. and Meth. A 499, 1 (2003).
(19) A. Abashian et al. (Belle Collaboration),
Nucl. Instr. and Meth. A 479, 117 (2002).
(20) KORALB(v2.4)/TAUOLA(v2.6):
S. Jadach and Z. Wa̧s, Comp. Phys. Commun. 85, 453
(1995);
ibid., 64, 267 (1991);
ibid., 36,191 (1985);
S. Jadach, J.H. Kühn, and Z. Wa̧s, Comp. Phys. Commun.
64, 275 (1991);
ibid., 70, 69 (1992);
ibid., 76, 361 (1993).
(21)
P. Golonka et al., hep-ph/0312240 (unpublished);
Z. Was and P. Golonka, Nucl. Phys. Proc. Suppl. 144, 88 (2005).
(22)
The QQ meson decay event generator was developed by the CLEO
Collaboration. See http://www.lns.cornell.edu/public/CLEO/soft/QQ.
(23) S. Jadach et al., Comp. Phys. Commun.
102, 229 (1997).
(24) S. Jadach, B.H.L. Ward, Z. Wa̧s,
Comp. Phys. Commun. 130, 260 (2000).
(25) F.A. Berends, P.H. Daverveldt, and R. Kleiss,
Comp. Phys. Commun. 40, 285 (1986).
(26) R. Brun et al., GEANT 3.21, CERN Report No.
DD/EE/84-1 (1987).
(27)
S. Eidelman et al. (Particle Data Group),
Phys. Lett. B 592 1, (2004).
(28) K. Ackerstaff et al. (OPAL Collaboration),
Eur. Phys. Jour. C 4, 193 (1998).
(29) S. Schael et al. (ALEPH Collaboration),
Phys. Rep. 421, 191 (2005).
(30) M. Acciarri et al. (L3 Collaboration),
Phys. Lett. B 345, 93 (1995).
(31) M. Artuso et al. (CLEO Collaboration),
Phys. Rev. Lett. 72, 3762 (1994).
(32) A. Höcker and V. Kartvelishvili,
Nucl. Instr. Meth. A 372, 469 (1996).
(33)
G.J. Gounaris and J.J. Sakurai, Phys. Rev. Lett. 21, 244 (1968).
(34)
V. Cirigliano, G. Ecker and H. Neufeld, Phys. Lett. B 513, 361 (2001); V. Cirigliano, G. Ecker and H. Neufeld, J. High Energy Phys. JHEP 08, 002 (2002).
(35)
M. Davier, S. Eidelman, A. Höcker, and Z. Zhang,
Eur. Phys. J. C 31, 503 (2003),
A. Höcker, Proc. of the 32nd Int. Conf. on High Energy Physics (ICHEP04),
Beijing, 2004, vol 2, p.710.
![[Uncaptioned image]](/html/hep-ex/0512071/assets/x1.png)