The LEPS collaboration
The and reactions at forward angles with photon energies from 1.5 to 2.4 GeV
Abstract
Differential cross sections and photon beam asymmetries for the and reactions have been measured in the photon energy range from 1.5 GeV to 2.4 GeV and in the angular range from to 60∘ of the scattering angle in the center of mass system at the SPring-8/LEPS facility. The photon beam asymmetries for both the reactions have been found to be positive and to increase with the photon energy. The measured differential cross sections agree with the data measured by the CLAS collaboration at 0.9 within the experimental uncertainties, but the discrepancy with the SAPHIR data for the reaction is large at 0.9. In the reaction, the resonance-like structure found in the CLAS and SAPHIR data at GeV is confirmed. The differential cross sections at forward angles suggest a strong -exchange contribution in the t-channel for the reaction, but not for the reaction.
pacs:
13.60.Le, 14.20.Gk, 25.20.LjI INTRODUCTION
By studying the excited states of baryons, deeper insight can be gained into their structure. The excited spectrum of baryons contains signatures stemming from the constituents at a more fundamental level. Experimental information on nucleon resonances ( and ) has been obtained primarily from the studies of the and (, ) reactions. In spite of valuable information on resonances in pionic channels, a search of intermediate resonances might be limited in these reactions. This problem is addressed by recent calculations in constituent quark models Capstick1 ; Capstick2 . A considerably large number of nucleon resonances are predicted by theoretical calculations compared with those observed in the pionic reactions. The nucleon resonances predicted but not yet found are referred as ‘missing resonances’. Quark model studies suggest some of these missing resonances may couple to strange channels, such as and channels Capstick2 . and hyperons have the isospins of 0 and 1, respectively. Accordingly, intermediate states of have the isospin ( only) whereas intermediate states of can have both the isospins of and ( and ). It is very interesting to study the and reactions to further our understanding of the role that nucleon resonances play in non-pionic reactions.
Measurements of the total cross section for the reaction at ELSA/SAPHIR saphirk+ showed a new resonance-like structure around W=1900 MeV (=1.5 GeV), where W is the total energy in the center of momentum system. The resonance-like structure was theoretically studied by connecting with missing resonances, like the (1900), which were predicted to couple strongly to the channel MB ; MAID ; Janssen ; Janssennew . These theoretical calculations were performed in a tree-level effective-Lagrangian approach. The well-established resonances (1650), (1710) and (1720) in an s-channel and and in a t-channel were included MB ; MAID ; Janssen ; Janssennew . There still remains some controversy in the theoretical description of the photoproduction, because of ambiguities from the choice of the resonances included, their meson-hadron couplings and form factors at hadronic vertices, and the treatment of the non-resonant background term. In particular, it has been found that the extracted resonance couplings are greatly influenced depending on which background model Janssen ; Saghai3 ; Janssennew2 is chosen. Thus, caution is advised in drawing conclusions on possible resonance structures.
It is important to measure additional observables and obtain accurate experimental data over a wide kinematical range for developing of theoretical models and for improving our knowledge of photoproduction. Cross sections and recoil polarizations have been obtained at JLAB/CLAS CLAS and SAPHIR saphirk+ ; saphirnew . The cross section measurements at CLAS CLAS suggest that the resonance-like structure near 1900 MeV has more than one component by examining yields at different scattering angles. Recently, comprehensive measurements for the and reactions extending to =2.6 GeV at SAPHIR have been reported saphirnew . In addition, measurements of the photon beam asymmetry KPRL and the transferred polarization in kaon electroproduction Carman help to further define the -photoproduction mechanism.
Furthermore, to calculate the cross sections of hypernuclear electroproduction, it is helpful to know the precise cross sections of the elementary reaction of kaon photoproduction. Therefore an improvement of the experimental data is also quite important from the view point of hypernuclear physics.
The contribution of -channel meson exchange is expected to become large at forward angles above the resonance region at 2 GeV. Mesons exchanged in kaon photoproduction are , , , and higher-mass Regge-poles. The dominance of unnatural parity exchange (- and -exchanges) leads to a photon beam asymmetry equal to while natural parity exchange (-exchange) leads to a photon beam asymmetry equal to at the limit of and Stichel ; Guidal . Therefore, measurements of the photon beam asymmetries will provide information relevant to -channel meson exchange.
In the present paper, we report photon beam asymmetries and the differential cross sections for the and reactions measured at =1.52.4 GeV at the SPring-8/LEPS facility. The photon beam asymmetries were obtained by using linearly polarized photons. The photon beam asymmetries, briefly reported in an earlier letter KPRL , are the first data in the nucleon resonance region. In contrast to the CLAS detector, the LEPS spectrometer at SPring-8 covers forward scattering angles. The data presented here is thus complementary to the CLAS data set. Since there remains a significant discrepancy between the CLAS and SAPHIR cross section data especially at forward angles CLAS , new cross section data are important for solving this discrepancy.
II EXPERIMENT
II.1 LEPS beam line at SPring-8 facility
The experiment was carried out at the Laser-Electron-Photon beam line (LEPS) at the storage ring of the Super Photon ring 8-GeV facility (SPring-8). At the LEPS beam line, a multi-GeV photon beam was produced by backward-Compton scattering of laser light from the circulating 8-GeV electrons.
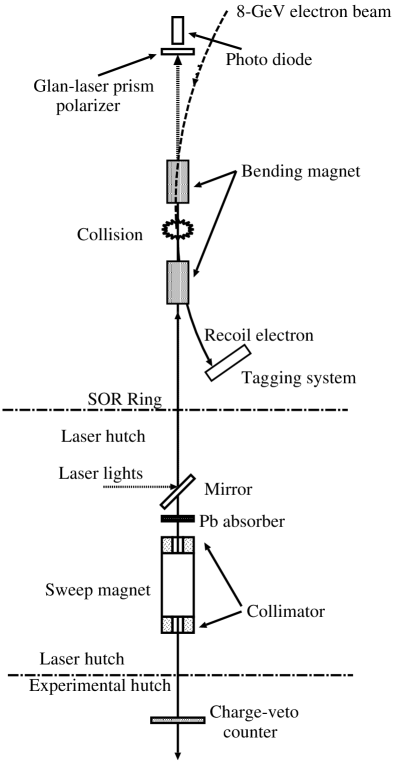
A schematic view of the LEPS beam line is shown in Fig. 1. The direction and polarization of the laser was tuned using mirrors and a half wave-length plate. The laser light was reflected into the beam line and injected in a 7.8 m straight section of the storage ring. The backward-Compton process occurs when laser light collides with the 8-GeV electrons. The photons are scattered backward toward the experimental hutch where a target and a magnetic spectrometer are located.
In the present experiment, an Ar-ion laser was used. Laser light with wave lengths ranging from 333.6 nm to 363.8 nm was obtained from the ultra-violet multi-line mode of operation. Linearly-polarized laser light produces linearly-polarized GeV energy photons. The polarization of the laser light was measured using a Glan-laser prism polarimeter and a photo diode placed at the end of the straight section. The degree of polarization of the laser light was typically 98%.

Figure 2(a) shows the intensity distribution of photons produced by the backward-Compton process as a function of the photon energy BCSEvsP . The maximum energy of the photon beam was 2.4 GeV. The lowest energy of the tagged photon beam (see below) was 1.5 GeV. Figure 2(b) shows the degree of the linear polarization of the photon beam as a function of photon energy BCSEvsP . The polarization of the photon beam was 95% at the maximum energy, 2.4 GeV. The polarization drops as the photon energy decreases. However it is still as high as 55% at 1.5 GeV. The typical photon intensity, integrated from 1.5 GeV to 2.4 GeV, was 5 /s with a laser power of 5 W. The size of the photon beam at the target position which is about 70 m from the collision point in the storage ring was = 5 mm in the horizontal direction and = 3 mm in the vertical direction.
The energy of the photon beam was determined by measuring the energy of the recoil electron from Compton scattering with a tagging counter placed at the exit of the bending magnet next to the straight section (see Fig. 1).
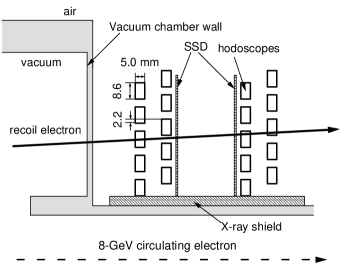
Figure 3 shows the tagging counter which consists of two layers of scintillator hodoscopes and two layers of silicon strip detectors (SSD). The size of the scintillator was 10 mm high, 8.6 mm wide, and 5 mm thick. The hodoscope consisted of 10 plastic scintillation counters stacked with an overlap of 2.2 mm. The trigger required at least one hit in each layer of the hodoscope. The hodoscopes were used to reject accidental events. After finding a track candidate with two layers of the hodoscope, an associated hit at the SSD was found and the precise hit position of a recoil electron was measured by the SSD layers with a strip pitch of 0.1 mm. The photon energy coverage of the tagging counter was from 1.5 to 2.4 GeV. The photon energy resolution was 15 MeV in root mean square mainly stemming from the energy and angular spread of the 8-GeV circulating electrons and the uncertainty of the photon-electron interaction point.
An aluminum coated silicon mirror of 0.85 mm thickness reflected the laser light, and a lead sheet of 2 mm thickness was also placed in the beam line. Its purpose was to absorb X-rays, thereby protecting the detectors from radiation damage. A part of the photon beam converted to charged particles in these materials. The charged particles were removed by a sweep magnet which consisted of a permanent magnet with a gap of 4.4 cm and a 100 cm length. The strength of the magnetic field was 0.6 T. Lead beam collimators were placed upstream and downstream of the sweep magnet. The upstream and downstream collimators had holes with a diameter of 20 mm and 25 mm, respectively. The size of those holes was much larger than the spread of the photon beam. Charged particles produced by the exit windows and the residual gas in the vacuum pipe between the sweep magnet and the target were eliminated using a charge-veto plastic scintillation counter placed just before the target.
II.2 LEPS spectrometer
The target was liquid hydrogen in a cell with a trapezoid shape made of copper. The length of the target cell was 5 cm in the beam direction and the inner volume was 110 cm3. The entrance and exit windows of the target cell were made of an Aramid foil of 0.05 mm thickness. The exit aperture was circular in shape with a 35 mm diameter.
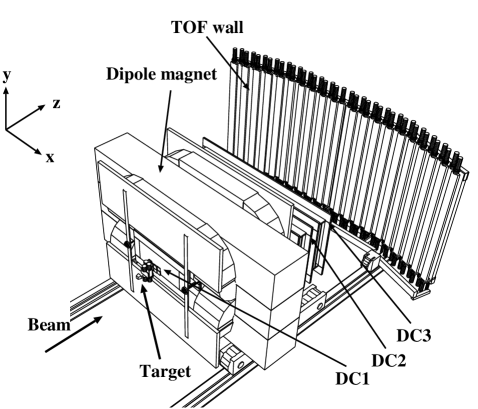
The LEPS spectrometer, shown in Fig. 4, was designed to detect charged hadrons produced at forward angles. Figure 5 shows the setup in front of the dipole magnet in more detail. The spectrometer consisted of a start counter (SC), a silica-aerogel Čerenkov counter (AC), a silicon vertex detector (SVTX), a dipole magnet, three multi-wire drift chambers (DC1, DC2 and DC3), and a time-of-flight (TOF) wall. The field strength of the dipole magnet was 0.7 T at its center. The magnet aperture was 55 cm high and 135 cm wide. The pole length was 60 cm along the beam direction. The angular coverage of the spectrometer was about rad and rad in the horizontal and vertical directions, respectively.
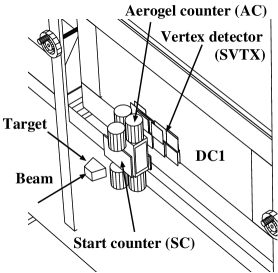
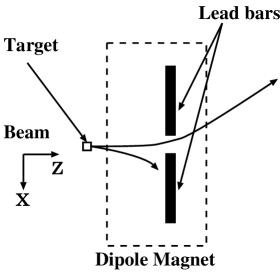
Charged particles produced at the target hit the SC which is 5 mm thick and is located just behind the target. The signal from the SC determined the trigger timing for the data acquisition system. The main background in the measurement of photon induced hadronic reactions is events from pair production. The AC had a 60 mm silica-aerogel radiator with a refractive index of 1.03 and was used to reject events at the trigger level. Gortex sheets were used as a reflector for the light collection. The rejection efficiency for events was higher than 99.9%. The magnetic field of the dipole magnet bent the trajectories of low momentum positrons and electrons. To prevent radiation hazards, positrons and electrons with momenta below 1 GeV/c were blocked by two lead bars in the dipole magnet. Figure 6 shows the top view of the lead bars. The lead bars with 4 cm height were located in the horizontal plane of the dipole magnet. The area covered by the lead bars corresponded to about 6% of the aperture of the dipole magnet. The positrons and electrons with momenta above 1 GeV/c went through the 15.5 cm gap between the two lead bars and into the beam dump positioned behind the TOF wall.
The silicon vertex detector (SVTX) and three drift chambers were used as tracking devices. SVTX was located behind the AC. By using the silicon detectors, precise vertex positions were obtained. The SVTX consisted of two layers of silicon-strip detectors with a 0.12 mm pitch. One layer was used to measure the position in horizontal direction and the other in the vertical direction. SVTX had a hole of 10 mm 10 mm for the beam. One of drift chambers (DC1) was positioned upstream of the magnet and had 6 layers (three vertical layers, two layers at and one layer at ). The active area of DC1 was 30 cm high 60 cm wide. The other two chambers (DC2 and DC3) were positioned at the downstream of the magnet and had 5 layers: two vertical layers, two layers at and one layer at . The active area was the same for DC2 and DC3, at 80 cm high 200 cm wide. The gas mixture used to operate the drift chambers was 70% argon and 30% isobutane. The position resolution of the drift chambers was 200 m (RMS). The average efficiency of each layer was about 99%.
The TOF wall located at the downstream of the DC3 was an array of 40 plastic scintillators. The dimension of each scintillation counter was 12 cm wide, 4 cm thick and 200 cm high. The counters were placed with an overlap of 1 cm. Photo-Multiplier (PM) tubes were attached to the top and bottom of the counter. The typical time resolution of the TOF counters was 120 ps.
The event trigger was made by signals from the tagging hodoscopes, the SC and the TOF wall. Signals from the charge-veto counter and the AC were used as vetos. The typical trigger rate was 20 Hz. The dead time of the data acquisition system was about 3%.
Half of the data were taken with vertically polarized photons and the other half with horizontally polarized photons. The polarization was changed about every 6 hours to reduce systematic errors in the measurement of the photon beam asymmetries. The laser polarization was also measured about every 6 hours. The data were accumulated with 2.1 photons at the target in total.
III DATA ANALYSIS
III.1 Event reconstruction
Momenta of charged particles were determined using information from the vertex detector and the three drift chambers. In the first stage of the tracking process, straight-line tracks were defined separately in the upstream devices (SVTX and DC1) and in the downstream devices (DC2 and DC3/TOF) to determine the hit position from the drift distance and the wire address. After straight-line tracking, track candidates were listed from all possible combinations of the upstream and downstream tracks. The overall track fitting was performed for all the track candidates using the full information of hits. The Kalman filter technique was employed for the track fitting taking into account the effect of the multiple scattering Kalman . The trajectory of a charged particle in the inhomogeneous magnetic field of the LEPS magnet was calculated by the Runge-Kutta method. Tracks fitted within a 98% confidence level were accepted for further analysis.
The vertical position in the TOF counter was calculated from the time difference of the TDC signals between the two PM tubes attached to the top and bottom of a counter. The resolution in vertical hit position was 18 mm (). The vertical hit position was used to find the correct combination between a track and a TOF hit. The stop signal for the time-of-flight measurement was provided from signals of the TOF counters. The start signal was provided by the RF signal from the 8-GeV electron storage ring where electrons were bunched at 2 ns intervals with a width of 12 ps (RMS). The typical flight path of charged particles was 4.2 m. Since the electronics used for recording the RF timing was not working for a part of the experiment, the start counter (SC) was used to provide a start timing instead of the RF signal for two-thirds of the data. The time resolution of the SC was 150 ps, and the time-of-flight resolution was 180 ps.
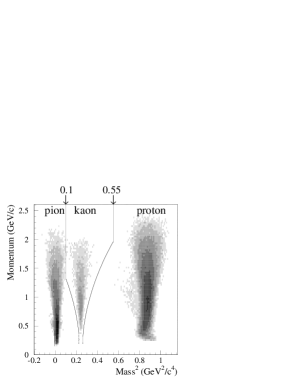
The particle mass was calculated using the momentum, the path length and the time-of-flight. Figure 7 shows the momentum versus the square of mass. The mass resolution depends on the momentum, as one can see in the plot. The resolution of kaon mass was 30 (105) MeV/c2 at the 1 GeV/c (2 GeV/c) momentum.
III.2 Event selections
To select events from the and reactions, we required the following cut conditions: (1) select particles, (2) remove decay-in-flight kaons, (3) reject accidental events, (4) select reaction vertices in the target, (5) select a recoil electron by Compton scattering and to reject shower and accidental hits in the tagging counter and, (6) select either or production.
The particles were selected using the known mass and charge. The curves in Fig. 7 indicate the 3 boundary of the momentum-dependent mass resolution for kaons. The 3 cut was used to select kaons with an additional condition of 0.1 Mass2 0.55 in the overlap region with positive pions and protons at high momenta. Events were purified by selecting events within the 98% confidence level for track fitting. This selection rejected mainly decay-in-flight kaons. The position difference between a track and a TOF hit was also used to reject decay-in-flight kaons. Although most of the accidental events were rejected in the particle selection, there still remained a contamination of accidental events. Those events were rejected by removing events with particles emitted in the median plane and passing through the gap in the lead bars.
Events produced at the liquid hydrogen target (LH2) were selected by their calculated vertex position along the photon beam direction (-vertex). Figure 8 shows the -vertex distribution.

The vertex point was defined as the point of the closest approach between a track and the beam axis. The photon beam had a small but finite size and we had no information on the position of a photon at the target on an event-by-event basis. The cut condition to select events produced at the target was 1100 mm -vertex 900 mm. The downstream cut point was tightened to reduce contamination events from the SC.
The number of electron tracks reconstructed in the tagging counter was required to be 1. Electro-magnetic shower events or accidental events could make a trigger, but these background events were rejected by requiring one track. After selecting particles and calculating the photon energy from the hit position of a recoil electron in the tagging counter, the missing mass of the reaction was calculated to identify and particles.

Figure 9 shows the missing mass spectrum of the photoproduction. Peaks corresponding to and were observed.
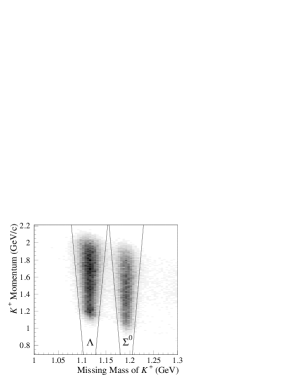
The missing mass resolution depends on the momentum as shown in Fig. 10. The mass resolution of and particles are = 17 MeV/c2 at a 2.0 GeV/c momentum and = 11 MeV/c2 at a 1.2 GeV/c momentum. The 2 boundaries were used to select and particles.
| Selection cuts | Events |
|---|---|
| triggered events | 1.78 108 |
| single track reconstructed | 4.23 107 |
| selection | 1.67 106 |
| decay-in-flight rejection | 1.52 106 |
| rejection | 9.70 105 |
| LH2 target selection by z-vertex | 4.52 105 |
| one recoil electron in tagger | 3.39 105 |
| particles | 7.25/4.89 104 |
Table 1 shows the number of events surviving after the selection cuts. From the total set of 1.8 108 triggered events, 7.3 104 and 4.9 104 events of the and reactions satisfied all the cut conditions given above.
IV RESULTS
IV.1 Photon beam asymmetries
By using both vertically and horizontally polarized photon beams, two sets of data were accumulated to measure the photon beam asymmetries KPRL . The relation between production yields in the two sets of data and the photon beam asymmetry, , is given as follows:
| (1) |
where and are the photoproduction yields with the vertically and horizontally polarized photons, respectively, and is the normalization factor for , determined by using the numbers of horizontally polarized photons, , and vertically polarized photons, , at the target as . The value of is in the present experimental data. is the azimuthal angle defined by the angle between the reaction plane and the horizontal plane, and is the polarization degree of the photon beam.

The dependence of the ratio was fitted with the function as shown in Fig. 11 and the amplitude was obtained. After was calculated, using the photon energy and the laser polarization shown in Fig. 2(b), the photon beam asymmetry was obtained.
The contamination of positive pions and protons into the mass region was estimated by extrapolating the Gaussian shaped mass distributions of positive pions and protons into the region. The contamination rates increased with momentum since the mass resolution was poor at the higher momenta. The contamination rates of positive pions and protons for the at the highest momentum region were 2.0% and 2.5%, respectively. The contamination rates of positive pions and protons for the were 3.5% and 5.0% at the highest momentum region, respectively. Although the contamination rates were small, their contribution caused a non-negligible shift of the measured photon beam asymmetry. The measured photon beam asymmetry is written as . The photon beam asymmetry of the events, , was obtained by determining the contamination rate, , and the photon beam asymmetry of the background events, . The maximum correction for the contamination of positive pions and protons was = 0.026 at W=2.28 GeV (=2.3 GeV). Another correction was made for background from the SC, estimated as a function of the scattering angle. The contamination rate was lower than 1% at cos0.9. It was 1.5% and 6.5% for the events at cos=0.925 and 0.975, respectively. For the events, it was 2.5% and 11% at cos=0.925 and 0.975, respectively. The contamination rate for the reaction was about 2 times higher than that for the reaction because (1197) events, from the reaction in carbon from the SC, were also present in the missing mass selection of the events.

Figure 12 shows the experimental results of the photon beam asymmetries as a function of cos for the and reactions in the photon energy range from 1.5 to 2.4 GeV. The errors are statistical only. Systematic uncertainties resulted from: (1) the photon-yield normalization factor , (2) the polarization degree, and (3) the polarization direction of the photon beam. To investigate the accuracy of the normalization factor obtained from the counting rate of the tagging counter, a fitting was performed with a function of pcos2 + p2 including an additional offset parameter of p2. As the result of the fitting, the systematic error for the photon asymmetries was estimated to be = 0.02 0.06. The measurement error of the laser polarization was estimated to be ( 0.01). The polarization, , was calculated by assuming that the wavelength of laser light was 351 nm (which was the most dominant component). The systematic error of due to the uncertainty of the wavelength was smaller than 0.1%. The direction of the polarization deviated from 0∘ and 90∘ in the cases of horizontal and vertical polarization, respectively. The deviation was 4∘ at a maximum. The systematic error arising from this deviation was estimated to be smaller than 0.4 ( 0.001).
The signs of the photon beam asymmetries for both of the and reactions were found to be positive in the measured kinematical region. The positive sign means that particles are emitted preferentially in the orthogonal direction to the photon polarization. The photon beam asymmetry increases with increasing photon energy in both reactions. The photon beam asymmetries for the reaction slightly decrease at backward angles above W=2.0 GeV, while showing a flat angular distribution below W=2.0 GeV. The photon beam asymmetries for the reaction show a flat angular distribution in all energy regions.
The ESRF/GRAAL collaboration reported the measurements of photon beam asymmetries for the reaction at total energies up to 1.87 GeV (=1.4 GeV) GRAAL . Their preliminary experimental analysis resulted in a positive sign and a flat angular distribution over all angles at =1.87 GeV. The GRAAL data show a good connection to the LEPS data around =1.92 GeV (=1.5 GeV).
IV.2 Differential cross sections
When the SC was used to provide the time-of-flight start timing, multi-hit events from a fast proton (from hyperon decay) and a particle caused a deterioration of the time resolution. This led to an efficiency loss in the particle identification. In the analysis of cross sections, we used only the part of the data with a good quality RF signal.
The data set used in this analysis were accumulated with the same number of photons for the horizontal and vertical polarizations (). Since the and reactions have finite values of the photon beam asymmetry, the production yield, , was the average of yields obtained with vertically and horizontally polarized photon beams. Differential cross sections were calculated as follows:
| (2) |
where is for the correction of the efficiency of the selection including the detector acceptance, and is a correction for the contamination of background. is the number of protons inside the target cell and is the number of photons at the target. In this analysis, was 0.1.
When the target cell was filled with liquid hydrogen, the typical pressure and temperature were 1.05 atm and 20.0 K, respectively and was 2.37 protons/cm2. The photon number, was obtained by counting the number of hits in hodoscopes of the tagging counter. The efficiency of the hodoscopes and the acceptance of finding a track of a recoil electron were taken into account. The discriminator dead time in electronics, due to a high count rate in the hodoscopes, was corrected to obtain the number of photons. The photon beam transmission from the collision point in the storage ring to the target position was measured with a PbWO4 crystal calorimeter. The result of the transmission measurement was consistent with an estimated value from the photon beam loss by material in the LEPS beam line.
The conditions to select the and reaction events are the same as those used in the analysis of the photon beam asymmetries. Table 2 shows the number of events which survive after the selection cuts.
| Selection cuts | Events |
|---|---|
| triggered events | 3.68 107 |
| single track reconstructed | 7.68 106 |
| selection | 2.80 105 |
| decay-in-flight | 2.59 105 |
| rejection | 2.46 105 |
| LH2 target selection by z-vertex | 1.22 105 |
| one recoil electron in Tagger | 9.11 104 |
| particles | 2.19/1.45 104 |
In total, 2.19 104 and 1.45 104 events for the and reactions, respectively, were used for the differential cross sections.
The acceptance of particles was estimated by assuming a Gaussian shape of the mass distributions. The acceptance of the selection was 94% at the highest momenta, as the cut position was set tighter there due to deteriorated mass resolution. The acceptance of selecting particles and hyperons was corrected by the factor of in Eq.(2). The amounts of contamination of positive pions and protons in the event samples were 1.7% and 2.2% for and production, respectively, in the highest momentum region. The contamination from the SC was the same as that in the photon asymmetry analysis. The contaminations of in the sample and in the sample were smaller than 1%. The contamination from the target windows was estimated to be 4.2%. These backgrounds were subtracted from the yield, .
The spectrometer acceptance, including the efficiency for track reconstruction, was estimated using a simulation tool based on the GEANT3 package. The acceptance, which depended on the photon energy and the scattering angle, was calculated for the and reactions. In Table 3, the acceptance is listed for the reaction with selection cuts at each scattering angle, cos=0.75, 0.85 and 0.95, integrated over all photon energies. The acceptance for the reaction is almost the same as that for the reaction, due to only small difference of the momentum.
| cos range | |||
|---|---|---|---|
| Cuts | 0.9-1.0 | 0.8-0.9 | 0.7-0.8 |
| Triggered events | .645 | .399 | .258 |
| decay-in-flight rejection | .974 | .970 | .965 |
| rejection | .954 | .995 | .992 |
| LH2 target selection by z-vertex | .928 | .977 | .988 |
| Total | .556 | .376 | .244 |
The vertex resolution was poor at forward scattering angles, which caused a high rejection rate by the -vertex cut at cos. About 56%, 38% and 24% of the events were detected, and the mass was reconstructed, for cos=0.95, 0.85 and 0.75, respectively.


Figures 13 and 14 present results of differential cross sections (closed circles) for the and reactions. Differential cross section data for the and reactions were obtained with good statistics in the range from 1.92 to 2.32 GeV at cos=0.95. The systematic uncertainty of the target thickness, due to fluctuations of the temperature and pressure of the liquid hydrogen, is estimated to be 1.0%. The systematic error of the photon number normalization was estimated using the number of protons detected by the LEPS spectrometer. The fluctuation of the photon number was within 1.2%. The measurement error in the transmission of the photon beam was 3.0%. The systematic uncertainty of the aerogel Čerenkov counter (AC) due to accidental vetoes and -ray reactions was measured to be lower than 1.6%.
The results from the SAPHIR Collaboration (triangle) and the CLAS Collaboration (square) are also plotted in Figs. 13 and 14 for comparison. Differential cross sections for the reaction gradually decrease as the photon energy increases as shown in Fig. 13. There is the large discrepancy between the CLAS and SAPHIR data at cos=0.75 and 0.85, and this causes difficulty in simultaneous fitting for theoretical models. It is important to solve these experimental discrepancies in order to obtain a conclusion for the existence of new resonances. The LEPS data shows good agreement with the CLAS data within the systematic uncertainty. The LEPS data support the results of CLAS rather than the SAPHIR data. A discrepancy between the LEPS and the SAPHIR data is seen at cos=0.95. The LEPS cross section is 32% larger than the SAPHIR cross section at GeV. The difference is significant at GeV.
Although a small bump structure is seen at GeV in the CLAS and SAPHIR data at cos=0.75 and 0.85, the discrepancy is large. The LEPS data shows the bump structure at W1.96 GeV and supports the results of the CLAS data. At cos=0.95, the LEPS data still have the bump structure at W1.96 GeV. No prominent structure is seen in the SAPHIR data.
Differential cross sections for the reaction increase slightly at GeV in both the LEPS and CLAS data. The cross sections for the reaction are about 20% smaller than those for the reaction. The LEPS data are about 10% smaller than the SAPHIR data at GeV. At cos=0.95, the discrepancy between the LEPS and SAPHIR data is large around GeV.
V DISCUSSION
V.1 Photon beam asymmetries

| Name | Model | t-channel | s-channel | u-channel |
|---|---|---|---|---|
| Guidal Guidalnew2 | Regge | None | None | |
| Ghent group Janssennew ; Janssennew2 ; corthalscomi | Isobar | , , , , , | (1800), (1810), (1880) | |
| Mart-Bennhold bennholdcomi | Isobar + Regge | , , , , , | None |
The experimental data of photon beam asymmetries are compared with the results of theoretical calculations in Fig. 15. The models used in the calculations are listed in Table 4. The dot-dashed curves are the results of the Regge model with the and exchanges by Guidal et al. Guidalnew . The dashed curves in the reaction are the results of the Ghent isobar model by D.G. Ireland et al. Janssennew . The dotted curves in the reaction are the results of the Ghent isobar model by T. Corthals et al. corthalscomi . The solid curves are the results of the mixing model of the Feynman diagram and the Regge model by Mart and Bennhold bennholdcomi .
The results of the Regge model calculation Guidalnew2 are compared with the data at =2.196 and 2.280 GeV, where the -channel contribution is expected to become large. The photon beam asymmetry is a good means to study meson-exchange in the -channel. The Regge model is valid only at forward angles and at high energies, and the -channel contribution seems to be not negligible even at =2.12.3 GeV. Although the Regge model calculation indicates a sharp rise at forward angles, which the data show, the model overestimates the data in both reactions and the discrepancy between the results of the model calculation and the experimental data becomes large at backward angles.
The Ghent isobar-model calculation for the reaction agrees with the LEPS data except for a sharp rise at forward angles. The model calculation for the reaction mostly agrees with the data at =2.28 GeV, but overestimates the data at GeV. the Mart and Bennhold model calculation for the reaction mostly agrees with the data, but shows a discrepancy with the data at 0.75 and cannot reproduce the sharp rise at forward angles. The model calculation for the reaction mostly agrees with the data.
V.2 Differential cross sections

The differential cross sections for the reaction are shown as a function of the total energy comparing with theoretical calculations in Fig. 16. The dot-dashed and dotted curves are the results of the Regge model with the and exchanges, and only exchange, respectively, obtained by Guidal et al. Guidalnew . The solid curves indicate the result of the mixing models of the Feynman diagram and the Regge model bennholdcomi .
Mart and Bennhold’s model calculation shows a good agreement with the LEPS and the CLAS data in all ranges. The resonance-like structure at =1.96 GeV is well reproduced by including the missing resonance (1900). The Ghent model calculation also include the (1900) resonance to reproduce the resonance-like structure Janssennew ; Janssennew2 . The and exchanges model calculation of the Regge theory overestimates the data. The difference between the and exchanges model, compared with the exchange only model, becomes large at forward angles because exchange is dominant at forward angles and makes a forward peak for the reaction in the Regge model.

The differential cross sections for the reaction are shown as a function of the total energy with the results of the theoretical calculations in Fig. 17. Dot-dashed and dotted curves are the results of the Regge model with the - and -exchanges, and the exchange, respectively obtained by Guidal et al. Guidalnew . Solid curves indicate the result of the mixing models of the Feynman diagram and the Regge model bennholdcomi . Dashed curves are the model calculation by the Ghent group corthalscomi .
The and exchange model underestimates the data at GeV but shows an agreement at GeV where the -channel contribution is expected to be dominant. In the Regge model, the contribution of the exchange for the reaction is smaller than that for the reaction since the coupling constant is smaller than Guidal . The difference between the Regge models using and exchanges, compared with the model having only exchange, is smaller than that for the reaction.
A small enhancement is seen at =2.05 GeV. The Ghent isobar-model calculation does not introduce a resonance at this region, and underestimates the experimental data. Large predicted photon beam asymmetries compared with the experimental data may be explained by the absence of a resonance in the calculation. On the other hand, in the Mart-Bennhold’s model calculation the (1910) resonance moves to =2.05 GeV, and the measured differential cross sections are reasonably reproduced in this energy region. The resonance strongly couples to the channel, and a resonance seems to be required to explain the enhancement at GeV.

The differential cross sections are shown as a function of the scattering angle in Fig. 18. The LEPS data connect smoothly to the CLAS data. It is seen that the cross section increases at forward angles while the cross section decreases except for the low energy regions of =1.947 and 2.029 GeV. The experimental data for the and reactions are compared with Mart and Bennhold’s model calculation in Fig. 18. The dot-dashed, dashed and solid curves are the results of the Regge model, the Feynman diagram and the mixing model of the Regge and the Feynman, respectively bennholdcomi .
The mixing model calculation agrees with the data for the reaction while the calculation of the Feynman diagram only agrees with the data for the reaction. The calculations of the Feynman diagram increase as the scattering angle becomes smaller, then they drop at cos0.85 for both reactions. The model calculation without inclusion of Regge amplitudes cannot explain the observed angular distributions for the reaction. The Regge model calculation shows steep increase for the while it drops for the at cos0.9. In the Regge model, the exchange contribution is large for the but is small for the at forward angles. In the high energy data measured at GeV at SLAC, the shows a forward peak but the does not SLAC . This result was discussed in terms of the dominance of the exchange for the Guidal . In our data the same feature is seen at =2.1 to 2.3 GeV. The mixing model, which includes the Regge model with a dominant exchange contribution, reproduces well the differential cross sections for the reaction.
VI SUMMARY
The photon beam asymmetries and differential cross sections for the and reactions have been measured at =1.52.4 GeV and at 0.6cos1 by using linearly polarized photons at the SPring-8/LEPS facility. The photon beam asymmetry data for the and reactions have been obtained for the first time in this energy range. The sign of the photon beam asymmetry has been found to be positive.
We obtained differential cross sections with good statistics at forward angles. The present data of the differential cross sections are consistent with those obtained by the CLAS Collaboration in the overlapping region. The differences of these two data are within the expected error. The resonance structure at =1.96 GeV is seen in the reaction and this is expected to be the same structure as one found in the SAPHIR and CLAS data. This bump structure can be explained by including a (1900) resonance. A small enhancement has been found at =2.05 GeV in the reaction and the structure is partly reproduced by including the resonance. The differential cross sections for the reaction rise at forward angles while the cross sections for the reaction drop. This forward peak in the channel comes from the large contribution of exchange in the -channel. Our data indicate that exchange is dominant in the reaction, but not dominant in the reaction.
Acknowledgements.
We thank the staff at SPring-8 for providing excellent experimental conditions during the long experiment. This research was supported in part by the Ministry of Education, Science, Sports and Culture of Japan, by the National Science Council of the Republic of China (Taiwan), and by the National Science Foundation (USA).References
- (1) S. Capstick and W. Roberts, Phys. Rev. D 49, 4570 (1994).
- (2) S. Capstick and W. Roberts, Phys. Rev. D 58, 074011 (1998).
- (3) M.Q. Tran et al. (The SAPHIR collaboration), Phys. Lett. B445, 20 (1998).
- (4) T. Mart and C. Bennhold, Phys. Rev. C 61, 012201 (1999).
- (5) T. Mart, C. Bennhold, H. Haberzettl and L. Tiator, “KaonMAID 2000” at http://www.kph.uni-mainz.de/MAID/kaon/kaonmaid.html.
- (6) S. Janssen, J. Ryckebusch, D. Debruyne, and T.V. Cauteren, Phys. Rev. C 65, 015201 (2002).
- (7) D.G. Ireland, S. Janssen and J. Ryckebusch, Nucl. Phys. A740, 147 (2004).
- (8) S. Janssen, J. Ryckebusch, D. Debruyne, and T. Van Cauteren, Phys. Rev. C 66, 035202 (2002).
- (9) B. Saghai, ‘International Symposium on Hadrons and Nuclei’ Seoul, Korea (2001); AIP conference proceedings 594, 57 (2001).
- (10) J.W.C. McNabb et al. (The CLAS collaboration), Phys. Rev. C69, 042201 (2004).
- (11) K.H. Glander et al., Eur. Phys. J. A 19, 251 (2004).
- (12) R.G.T. Zegers et al. (The LEPS collaboration), Phys. Rev. Lett. 91, 092001 (2003).
- (13) D.S. Carman et al. (The CLAS Collaboration), Phys. Rev. Lett. 90, 131804 (2003).
- (14) P. Stichel, Z. Phys. 180, 170 (1964).
- (15) M. Guidal, M. Laget and M. Vanderhaeghen, Nucl. Phys. A627, 645 (1997).
- (16) A. D’Angelo, O. Bartalini, V. Bellini, P. Levi Sandri, D. Moricciani, L. Nicoletti and A. Zucchiatti, Nucl. Instrum. Methods Phys. Res. A 455, 1 (2000).
- (17) R. Frhwirth, Nucl. Instrum. Methods A262, 444 (1987).
- (18) J.P. Bocquet et al., Nucl. Phys. A691, 466c (2001).
- (19) M. Guidal et al, Phys. Rev. C 68, 058201 (2003).
- (20) T. Corthals, private communication.
- (21) T. Mart and C. Bennhold, ‘Kaon photoproduction in the Feynman and Regge theories,’ arXiv:nucl-th/0412097.
- (22) M. Guidal, private communication.
- (23) A.M. Boyarski, F. Bulos, W. Busza, R. Diebold, S.D. Ecklund, G.E. Fischer, Y. Murata, J.R. Rees, B. Richter, and W.S. C. Williams, Phys. Rev. Lett. 22, 1131 (1969).