SINGLE SPIN ASYMMETRY OF CHARGED HADRON PRODUCTION BY 40 GEV/C POLARIZED PROTONS
V.V. Abramov1†, P.I. Goncharov1, A.Yu. Kalinin1, A.V. Khmelnikov1, A.V. Korablev1, Yu.P. Korneev1, A.V. Kostritsky1, A.N. Krinitsyn1, V.I. Kryshkin1, A.A. Markov1, V.V. Talov1, L.K. Turchanovich1, A.A. Volkov1
(1) Institute for High Energy Physics, Protvino, Moscow region, Russia
E-mail: Victor.Abramov@ihep.ru
Abstract
The single spin asymmetry for charge hadron production off nuclei (C, Cu) has been measured using 40 GeV/c polarized proton beam. The measurements were carried out using FODS-2 experimental setup at IHEP. The data are presented in the central region and the forward region with respect to the incident protons.
1 Introduction
The single spin asymmetries (SSA) in hadron-hadron interactions are much larger than expected from the naive pertubative QCD [1]. Also, its dependence on kinematic variables and hadron type is far from the complete understanding. The existing data are measured in a limited range of c.m. production angles, transverse momenta and energies. The previous measurements of SSA have shown that its absolute value is rising with the increase of and for beam energies above 20 GeV [2],[3]. There were no measurements so far of the single spin asymmetries of the charged hadron production in the energy range between 22 and 200 GeV. We have measured the single-spin asymmetry of the inclusive charged pion, kaon, proton and antiproton production cross sections at high and high regions for a 40 polarized proton beam incident on nuclei (C, Cu), where is defined as
| (1) |
where is the beam polarization, is the azimuthal angle of the production plane, and are event rates for the beam spin up and down respectively. The measurements were carried out at IHEP, Protvino in 2003. The preliminary results in the central region were reported elsewhere [4]. The measurements of in the central region using hydrogen target revealed a sizable asymmetry for and K+ production [5].
2 Polarized beam and experimental setup
The polarized protons are produced by the parity - nonconserving decays [4],[5]. The up or down beam transverse polarization is achieved by the selection of decay protons with angles near in the rest frame by a movable collimator. At the end of the beam line two magnets correct the vertical beam position on the spectrometer target for the two beam polarizations. The intensity of the 40 momentum polarized beam on the spectrometer target is ppp, %, the transverse polarization is %, and the polarization direction is changed each 18 min during 30 s. The beam intensity and the position are measured by the ionization chambers and the scintillation hodoscopes.
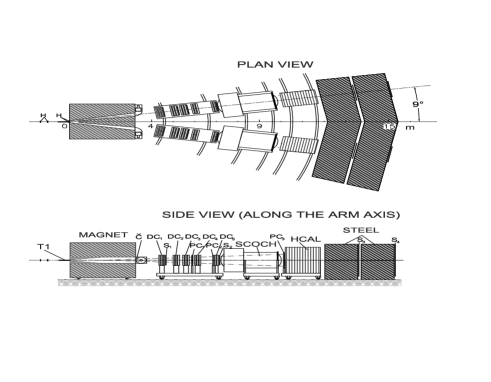
The measurements were carried out with the FODS-2 [4],[5] spectrometer (Fig. 1). It consists of an analyzing magnet, the drift chambers, the Cherenkov radiation spectrometer (SCOCH) for the particle identification ( , , and ), the scintillation counters, and the hadron calorimeters to trigger on the high energy hadrons. Inside the magnet there is also a beam dump made of tungsten and copper. There are two arms which can be rotated around the target center situated in front of the magnet to change the secondary particle angle.
There are two threshold Cherenkov counters using air at the atmospheric pressure inserted in the magnet which are used for further improvement of particle identification.
3 Measurements
The measurements of in the range and GeV/ are carried out with the symmetrical arm positions at angles of 160 mrad (mean c.m. angle 86o). The results for the two arms and the different values of the magnetic field B in the spectrometer are averaged, which partially cancels systematical uncertainties connected with the variation of the beam position in the vertical direction, the intensity monitor and the apparatus drift. Another set of measurements is carried out with the arms, rotated by 70 mrad (the left arm is at with and GeV/ , and the right arm is at with and GeV/ ). Both polarities of magnetic field B in the spectrometer magnet are used for data taking to reduce systematic uncertainties. In addition, two values of the magnetic field (B and B/2) are used to extend the momentum range of the data.
4 Data processing
The reconstructed trajectory of a particle downstream the spectrometer magnet and beam coordinates from the beam hodoscopes are used to determine its momentum, production angles and vertex -coordinate. After all cuts are applied, the remaining events are identified in the SCOCH and threshold cherenkov counters. The integrated beam flux is measured by the ionization chamber and is used to calculate normalized particle rates ( and ) for two signs of the beam polarization. The beam coordinates, measured by the and hodoscope planes, are used to estimate the mean beam position ( and ) during a spill, separately for “UP” and “Down” polarization signs. It was found that the mean beam coordinates, averaged over a group of runs with similar conditions, can differ for “UP” and “Down” beam polarizations up to mm. Since the normalized rates and depend on the beam position, the false asymmetry can be added to the analyzing power . Cuts on beam coordinates are imposed to level the and for “UP” and “Down” polarization sign with 4 accuracy to avoid the false asymmetry. The other sources of systematic uncertainties, remaining after the above cuts are applied, contribute up to 4% to the systematic error , which is estimated from run to run variation. The is added in the quadrature to the statistical error at each data point.
5 Single spin asymmetries
The dependence of on transverse momentum () for , , and production on C and Cu targets and at two c.m. angles ( and ) are shown in Figs. 3 - 7.
![[Uncaptioned image]](/html/hep-ex/0511036/assets/x2.png)
|
![[Uncaptioned image]](/html/hep-ex/0511036/assets/x3.png)
|
The significant value of is seen in , , and proton production at on both targets. The at is approximately two times smaller in and production and reveals a breakdown at GeV/c in its dependence, which could indicate a transition to the predicted pQCD regime [1]. The for and production is consistent with zero for both targets and all c.m. angles, as expected due to small sea quark polarization. The proton data at reveal an oscillation of with minimum at 1.3 GeV/c and maximum near 2.2 GeV/c.
![[Uncaptioned image]](/html/hep-ex/0511036/assets/x4.png)
|
![[Uncaptioned image]](/html/hep-ex/0511036/assets/x5.png)
|
![[Uncaptioned image]](/html/hep-ex/0511036/assets/x6.png)
|
![[Uncaptioned image]](/html/hep-ex/0511036/assets/x7.png)
|
The SSA at are shown in Figs. 9 and 9 for and , respectively. For all charged hadrons the SSA is close to zero at near . No significant A-dependence is observed in the above data.
Comparison of FODS-2 results with the data, measured at 22 GeV/c [3] and at 200 GeV/c [2], is shown in Figs. 9 - 9 as a function of a scaling variable , where takes into account the constituent quark mass GeV/c2 and the number of valence quarks in the observed hadron. For all three energies the SSA in the forward region is described well by a single function of . The and proton SSA agree with E925 data for GeV/c [4]. References to other examples of scaling SSA behavior can be found in Ref. [4].
In conclusion, the SSA are measured on C and Cu targets for , , and proton production at mean c.m. angles , and . The decrease of SSA above 2.5 GeV/c for , and protons can indicate a transition to the pQCD regime, where tends to zero. No significant A-dependence is observed for the SSA. The SSA for and are consistent with zero, as expected due to the small sea quark polarization. The scaling behavior of SSA is seen for and GeV/c. The SSA is close to zero for .
We are grateful to the IHEP staff for their assistance with setting up the experiment and the IHEP directorate for their support.
![[Uncaptioned image]](/html/hep-ex/0511036/assets/x8.png)
|
![[Uncaptioned image]](/html/hep-ex/0511036/assets/x9.png)
|
![[Uncaptioned image]](/html/hep-ex/0511036/assets/x10.png)
|
![[Uncaptioned image]](/html/hep-ex/0511036/assets/x11.png)
|
References
- [1] G. Kane, J. Pumplin, and W. Repko, Phys. Rev. Lett. 41, 1689 (1978).
- [2] D.L. Adams et al., Phys. Lett. B264, 462 (1991).
- [3] K. Krueger et al., Phys. Lett. B459, 412 (1999).
- [4] V.V. Abramov, Phys. Atom. Nucl. 68, 385 (2005).
- [5] V.V. Abramov, A.S. Dyshkant, V.N. Evdokomov et al., Nucl. Phys. B492, 3 (1997).