b CERN/PH, CH-1211 Geneva 23, Switzerland
HERA Diffractive Structure Function Data and Parton Distributions 111 Contributed to the Proceedings of the Workshop on HERA and the LHC, DESY and CERN, 2004-2005.
Abstract
Recent diffractive structure function measurements by the H1 and ZEUS experiments at HERA are reviewed. Various data sets, obtained using systematically different selection and reconstruction methods, are compared. NLO DGLAP QCD fits are performed to the most precise H1 and ZEUS data and diffractive parton densities are obtained in each case. Differences between the dependences of the H1 and ZEUS data are reflected as differences between the diffractive gluon densities.
1 Introduction
In recent years, several new measurements of the semi-inclusive ‘diffractive’ deep inelastic scattering (DIS) cross section for the process at HERA have been released by the H1 and ZEUS experiments [1, 2, 3, 4, 5, 6]. The data are often presented in the form of a -integrated reduced diffractive neutral current cross section , defined through222For a full definition of all terms and variables used, see for example [3].
| (1) |
or in terms of a diffractive structure function . Neglecting any contributions from exchange,
| (2) |
such that is a good approximation except at very large . The new data span a wide kinematic range, covering several orders of magnitude in , and .
Within the framework of QCD hard scattering collinear factorisation in diffractive DIS [7], these data provide important constraints on the diffractive parton distribution functions (dpdf’s) of the proton. These dpdf’s are a crucial input for calculations of the cross sections for less inclusive diffractive processes in DIS, such as dijet or charm production [8, 9]. In contrast to the case of inclusive scattering, the dpdf’s extracted in DIS are not expected to be directly applicable to hadron-hadron scattering [10, 11, 12, 7]. Indeed, diffractive factorisation breaks down spectacularly when HERA dpdf’s are applied to diffractive proton-proton interactions at the TEVATRON [13]. It may, however, be possible to recover good agreement by applying an additional ‘rapidity gap survival probability’ factor to account for secondary scattering between the beam remnants [14, 15, 16, 17]. The HERA dpdf’s thus remain an essential ingredient in the prediction of diffractive cross sections at the LHC, notably the diffractive Higgs cross section [18]. Although the poorly known rapidity gap survival probability leads to the largest uncertainty in such calculations, the uncertainty due to the input dpdf’s also plays a significant role. In [3], the H1 collaboration made a first attempt to assess the uncertainty from this source, propagating the experimental errors from the data points to the ‘H1 2002 NLO fit’ parton densities and assessing the theoretical uncertainties from various sources.
In this contribution, we investigate the compatibility between various different measurements of by H1 and ZEUS. We also apply the techniques developed in [3] to ZEUS data in order to explore the consequences of differences between the H1 and ZEUS measurements in terms of dpdf’s.
2 Diffractive Selection Methods and Data Sets Considered
One of the biggest challenges in measuring diffractive cross sections, and often the source of large systematic uncertainties, is the separation of diffractive events in which the proton remains intact from non-diffractive events and from proton-dissociation processes in which the proton is excited to form a system with a large mass, . Three distinct methods have been employed by the HERA experiments, which select diffractive events of the type , where is a proton or at worst a low mass proton excitation. These methods are complimentary in that their systematics due to the rejection of proton dissociative and non diffractive contributions are almost independent of one another. They are explained in detail below.
-
•
Roman Pot Spectrometer Method. Protons scattered through very small angles are detected directly in detectors housed in ‘Roman Pot’ insertions to the beampipe well downstream the interaction point. The proton 4-momentum at the interaction point is reconstructed from the position and slope of the tracks in these detectors, given a knowledge of the beam optics in the intervening region. The Roman Pot devices are known as the Leading Proton Spectrometer (LPS) in the case of ZEUS and the Forward Proton Spectrometer (FPS) in H1. The Roman pot method provides the cleanest separation between elastic, proton dissociative and non-diffractive events. However, acceptances are rather poor, such that statistical uncertainties are large in the data sets obtained so far.
-
•
Rapidity Gap Method. This method is used by H1 for diffractive structure function measurements and by both H1 and ZEUS for the investigation of final state observables. The outgoing proton is not observed, but the diffractive nature of the event is inferred from the presence of a large gap in the rapidity distribution of the final state hadrons, separating the system from the unobserved system. The diffractive kinematics are reconstructed from the mass of the system, which is well measured in the main detector components. The rapidity gap must span the acceptance regions of various forward333The forward hemisphere corresponds to that of the outgoing proton beam, where the pseudorapidity is positive. detector components. For the H1 data presented here, these detectors efficiently identify activity in the pseudorapidity range . The presence of a gap extending to such large pseudorapidities is sufficient to ensure that . In light of the poor knowledge of the spectrum at low masses, no attempt is made to correct the data for the small remaining proton dissociation contribution, but rather the cross sections are quoted integrated over .
-
•
Method. Again the outgoing proton is not observed, but rather than requiring a large rapidity gap, diffractive events are selected on the basis of the inclusive distribution. Diffractive events are responsible for a plateau in this distribution at low , such that they can be selected cleanly for the lowest values. At intermediate , non-diffractive contributions are subtracted on the basis of a two component fit in which the non-diffractive component rises exponentially. This method is used for diffractive structure function measurements by ZEUS. It does not discriminate between elastic and low proton-dissociative contributions. Results are quoted for .
Four recent data sets are considered, for which full details of luminosities and kinematic ranges can be found in table 1.
-
•
Published data from ZEUS taken in 1998 and 1999, using the method and taking advantage of the increased forward acceptance offered by a new plug calorimeter (‘ZEUS-’) [1].
-
•
Published ZEUS data obtained with the LPS using data taken in 1997 (‘ZEUS-LPS’) [2].
- •
-
•
Preliminary H1 data obtained using the FPS, based on data taken in 1999 and 2000 (‘H1-FPS’) [6].
3 Comparisons between Data Sets
In this section, the dependences of the data from the different measurements are compared at fixed values of and . Since the various measurements are generally presented at different and values, it is necessary to transport the data to the same values. The and values of the H1-LRG data are chosen as the reference points. The factors applied to data points from the other measurements are evaluated using two different parameterisations, corresponding to the results of QCD fits to 1994 H1 data [19] and to a subset of the present H1-LRG data at intermediate [3] (see also section 4). In order to avoid any significant bias arising from this procedure, data points are only considered further here if the correction applied is smaller than in total and if the correction factors obtained from the two parameterisations are in agreement to better than . In practice, these criteria only lead to the rejection of data points in the ZEUS- data set at and , where the poorly known high dependence of the diffractive cross section implies a large uncertainty on the factors required to transport them to . Elsewhere, there is reasonable agreement between the factors obtained from the two parameterisations and no additional uncertainties are assigned as a consequence of this procedure.
Since the various data sets correspond to different ranges in the outgoing proton system mass, , additional factors are required before comparisons can be made. For all data and fit comparisons, all data are transported to the H1 measurement range of and . The leading proton data are scaled by a factor [20] to correspond to the range and the ZEUS- data are scaled to the same range by a further factor of [1], such that the overall factor is . The uncertainties on these factors are large, giving rise to normalisation uncertainties of perhaps between the different data sets.
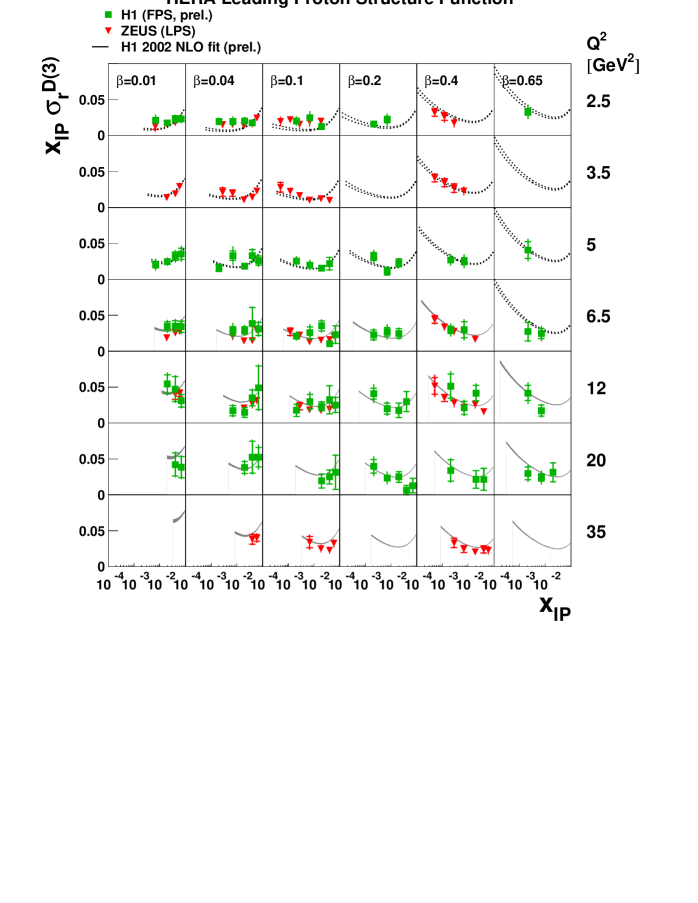
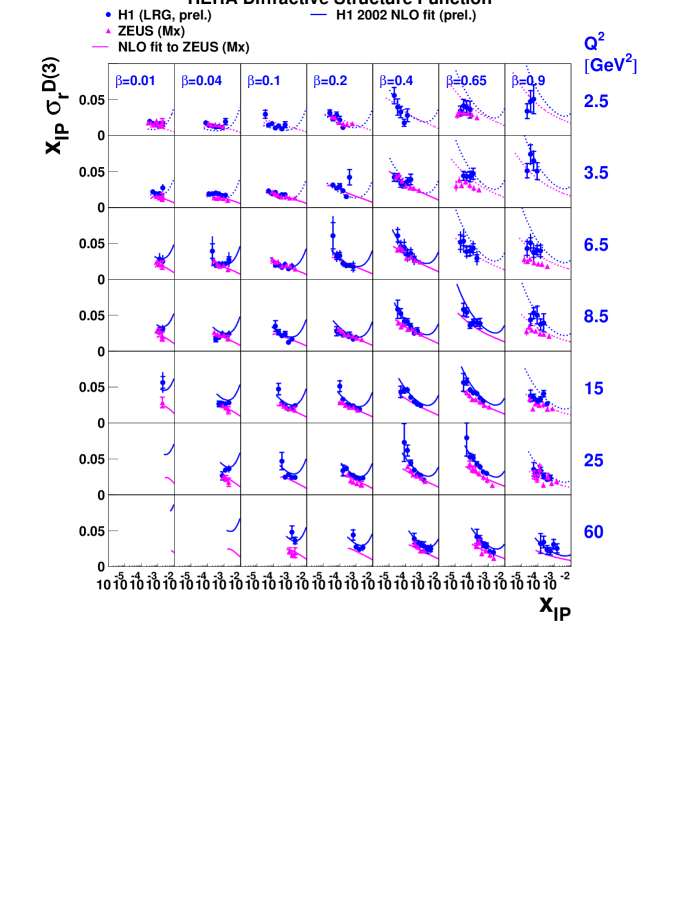
The ZEUS-LPS and H1-FPS data are compared in figure 1. Within the experimental uncertainties, the two data sets are in good agreement. Both data sets are also consistent with a parameterisation of the H1-LRG data [3] based on the H1 2002 NLO QCD fit, which is also shown. This good agreement between the H1-LRG and the Roman Pot data is also shown explicitly in figure 3.
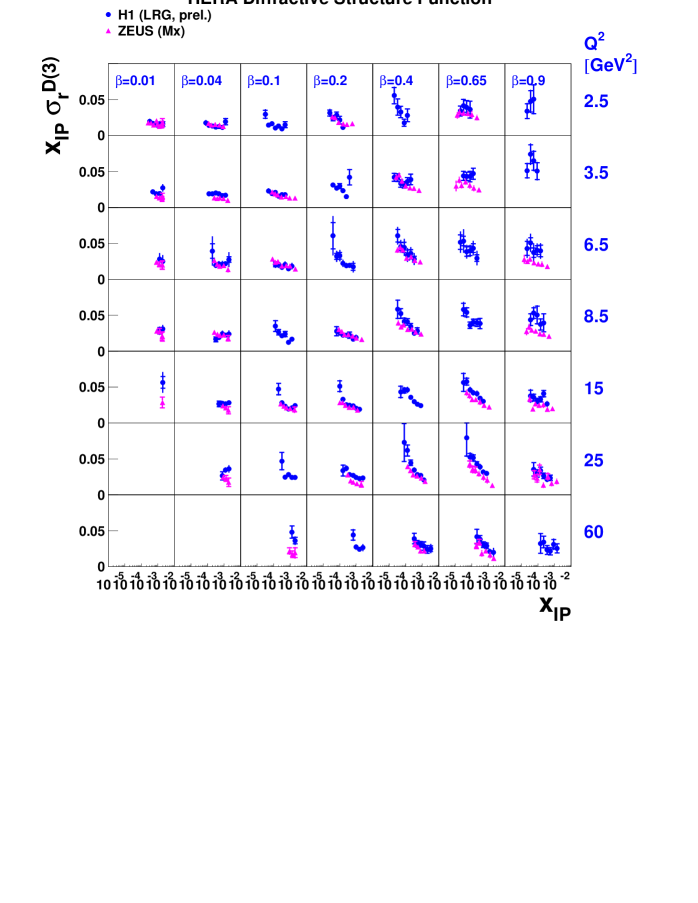
In figure 2, a comparison is made between the H1-LRG and the ZEUS- data after all factors have been applied. For much of the kinematic range, there is tolerable agreement between the two data sets. However, there are clear regions of disagreement. One is at the largest (smallest ), where the H1 data lie significantly above the ZEUS data for . Another is at intermediate and low , where the two data sets show significantly different dependences on . With the factor of 0.77 applied to the ZEUS data, there is good agreement at low , but the ZEUS data lie below the H1 data at large . If the factor of 0.77 is replaced with a value closer to unity, the agreement improves at large , but the H1 data lie above the ZEUS data at low . These inconsistencies between the different data sets are discussed further in section 4.
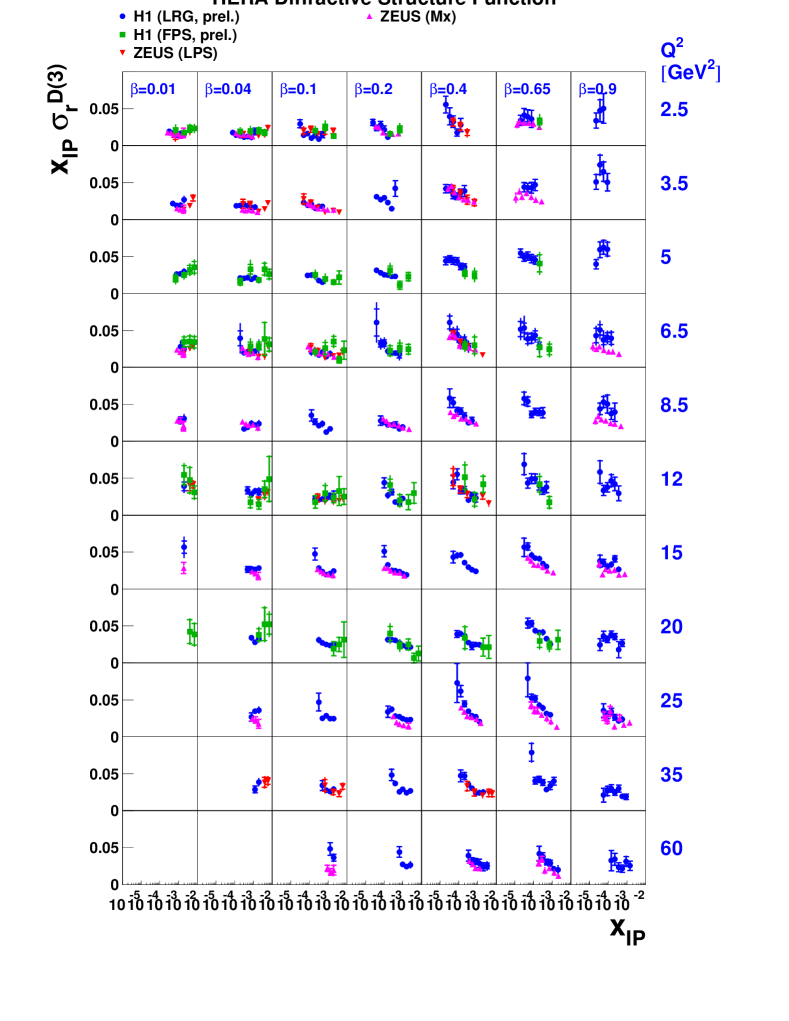
For completeness, figure 3 shows a comparison between all four data sets considered.
4 Diffractive Parton Distributions
4.1 Theoretical Framework and Fit to H1-LRG Data
In this contribution, we adopt the fitting procedure used by H1 in [3], where next-to-leading order (NLO) QCD fits are performed to diffractive reduced cross section, , data [3, 21] with and the and ranges given in table 1.
The proof that QCD hard scattering collinear factorisation can be applied to diffractive DIS [7] implies that in the leading approximation, the cross section for the diffractive process can be written in terms of convolutions of universal partonic cross sections with diffractive parton distribution functions (dpdf’s) [22, 11, 23], representing probability distributions for a parton in the proton under the constraint that the proton is scattered with a particular 4 momentum. Thus, at leading twist,444A framework also exists to include higher order operators [24].
| (3) |
This factorisation formula is valid for sufficiently large and fixed and . It also applies to the case of proton dissociation into a system of fixed mass and thus to any cross section which is integrated over a fixed range in . The partonic cross sections are the same as those for inclusive DIS and the dpdf’s , which are not known from first principles, should obey the DGLAP evolution equations [25].
In addition to the rigorous theoretical prescription represented by equation (3), an additional assumption is necessary for the H1 fits in [3], that the shape of the dpdf’s is independent of and and that their normalisation is controlled by Regge asymptotics [26]. Although this assumption has no solid basis in QCD, it is compatible with the data fitted. The diffractive parton distributions can then be factorised into a term depending only on and and a term depending only on (or ) and :
| (4) |
Under this ‘Regge’ factorisation assumption, the diffractive exchange can be treated as an object (a ‘pomeron’, ) with a partonic structure given by parton distributions . The variable then corresponds to the fraction of the pomeron longitudinal momentum carried by the struck parton. The ‘pomeron flux factor’ represents the probability that a pomeron with particular values of and couples to the proton.
In the fit, the dependence is parameterised using a Regge flux factor
| (5) |
where , is the minimum kinematically allowed value of and the pomeron trajectory is assumed to be linear, . The parameters and and their uncertainties are fixed as described in [3]. The value of is chosen such that the flux factor is normalised to unity at . The pomeron intercept is then obtained from the dependence of the data and takes the value .
The description of the data is improved with the inclusion of an additional separately factorisable sub-leading exchange with a trajectory intercept of and parton densities taken from a parameterisation of the pion [27]. This exchange contributes significantly only at low and large .
The dpdf’s are modelled in terms of a light flavour singlet
| (6) |
with and a gluon distribution at a starting scale . Here, is the momentum fraction of the parton entering the hard sub-process with respect to the diffractive exchange, such that for the lowest-order quark parton model process, whereas for higher order processes. The singlet quark and gluon distributions are parameterised using the form
| (7) |
where is the member of a set of Chebychev polynomials555, and .. The series is squared to ensure positivity. The exponential term is added to guarantee that the dpdf’s tend to zero in the limit of . It has negligible influence on the extracted partons at low to moderate . The numbers of terms in the polynomial parameterisations are optimised to the precision of the data, with the first three terms in the series used for both the quark singlet and the gluon distributions, yielding 3 free parameters ( and ) for each. The normalisation of the sub-leading exchange contribution at high is also determined by the fit such that the total number of free parameters is . The data used in the fit are restricted to to suppress non-leading twist contributions. The effects of are considered through its relation to the NLO gluon density, such that no explicit cut on is required.
The NLO DGLAP equations are used to evolve the dpdfs to using the method of [28], extended for diffraction. No momentum sum rule is imposed. Charm quarks are treated in the massive scheme (appearing via boson gluon fusion processes) with . The strong coupling is set via666Although this value is rather different from the world average, we retain it here for consistency with previous H1 preliminary results, where it has been used consistently for QCD fits [3] and final state comparisons [8, 9]. . The statistical and experimental systematic errors on the data points and their correlations are propagated to obtain error bands for the resulting dpdfs, which correspond to increases in the by one unit [29]. A theoretical error on the dpdfs is estimated by variations of , and the parameterisation of the dependences as described in [3]. No theoretical uncertainty is assigned for the choice of parton parameterisation, though the results are consistent within the quoted uncertainties if alternative approaches [30] are used. No inhomogeneous term of the type included in [31] is considered here. The presence of such a term would lead to a reduction in the gluon density extracted.
The central fit gives a good description of the data, with a of for 306 degrees of freedom. The resulting diffractive quark singlet and gluon distributions are shown in figure 4. Both extend to large fractional momenta . Whereas the singlet distribution is well constrained by the fit, there is a substantial uncertainty in the gluon distribution, particularly for . The fraction of the exchanged momentum carried by gluons integrated over the range is (total error), confirming the conclusion from earlier work [19] that diffraction is a gluon-induced phenomenon. These dpdf’s have been astonishingly successful in describing diffractive final state data in DIS such as charm [9] and jet [8] production, which, being induced by boson-gluon fusion-type processes, are roughly proportional to the diffractive gluon density.
4.2 Fit to ZEUS Data
A very similar fit to that described in section 4.1 is performed to the ZEUS- data and the implications of the differences between the data sets to the dpdf’s are investigated. The data are fitted in their original binning scheme, but are scaled to using the factor of 0.77. As for the fit to the H1 data, the first 3 terms are included in the polynomial expansions for the quark and gluon densities at the starting scale for QCD evolution. The same fit program, prescription and parameters are used as was the case for the H1 2002 NLO fit, with the following exceptions.
-
•
ZEUS- data with are included in the fit, whereas only H1 data with are included. It has been checked that the result for ZEUS is not altered significantly if the minimum value is increased to .
-
•
The quadratic sum of the statistical and systematic error is considered, i.e. there is no treatment of correlations between the data points through the systematics.
-
•
No sub-leading Reggeon exchange component is included in the parameterisation. Including one does not improve or alter the fit significantly.
-
•
The Pomeron intercept is fitted together with the dpdf’s, in contrast to the two stage process of [3]. This does not influence the results significantly, though it does decrease the uncertainty on .
The fit describes the ZEUS- data well ( for degrees of freedom) and yields a value for the Pomeron intercept of (experimental error only). This value is in agreement with the H1 result if the full experimental and theoretical errors are taken into account. A good fit is thus obtained without any variation of with or other deviation from Regge factorisation.
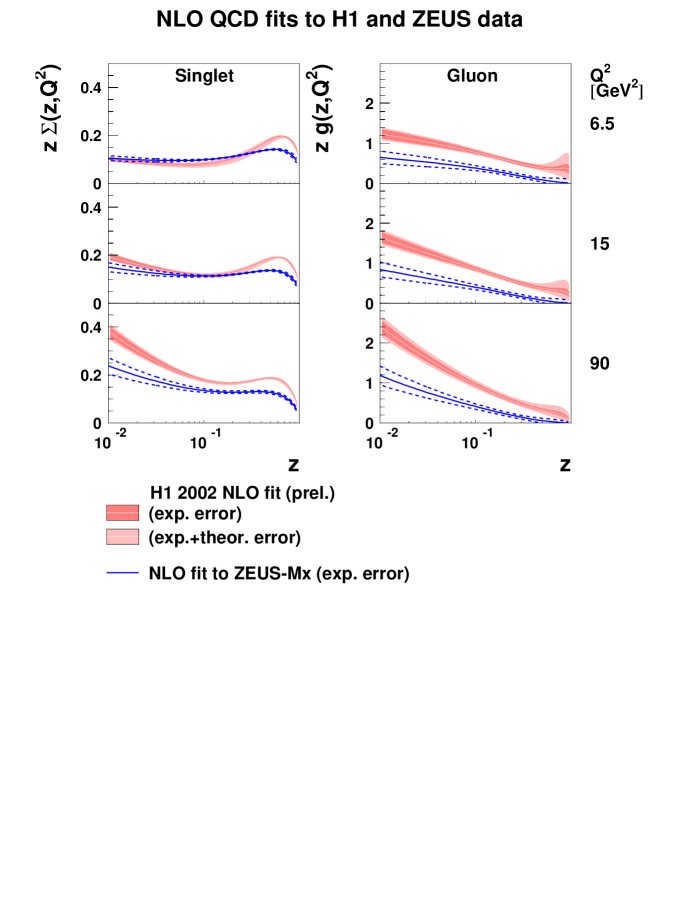
The diffractive parton densities from the fit to the ZEUS- data are compared with the results from H1 in figure 4. The differences observed between the H1 and the ZEUS data are directly reflected in the parton densities. The quark singlet densities are closely related to the measurements of themselves. They are similar at low where the H1 and ZEUS data are in good agreement, but become different at larger , where discrepancies between the two data sets are observed. This difference between the dependences of the H1 and ZEUS data is further reflected in a difference of around a factor of 2 between the gluon densities, which are roughly proportional to the logarithmic derivative [32].
The H1-LRG and ZEUS- data are shown together with the results from both QCD fits in figure 5. Both fits give good descriptions of the data from which they are obtained. The differences between the two data sets are clearly reflected in the fit predictions, most notably in the dependence.
5 Summary
Recent diffractive structure function data from H1 and ZEUS have been compared directly. The leading proton data from both experiments (H1-FPS and ZEUS-LPS) are in good agreement with one other and with the H1 large rapidity gap data (H1-LRG). There is reasonable agreement between the H1-LRG and the ZEUS- data over much of the kinematic range. However, differences are observed at the highest (smallest ) and the dependence at intermediate to low is weaker for the ZEUS- data than is the case for the H1-LRG data.
An NLO DGLAP QCD fit has been performed to the ZEUS- data, using the same theoretical framework, assumptions and parameterisations as have been employed previously for the H1-2002-prelim NLO QCD fit to a subset of the H1-LRG data. As a consequence of the differences between the dependences of the H1-LRG and ZEUS- data, the gluon density obtained from the ZEUS data is significantly smaller than that for H1.
References
- [1] S. Chekanov et al. [ZEUS Collaboration], Nucl. Phys. B713, 3 (2005)
- [2] S. Chekanov et al. [ZEUS Collaboration], Eur. Phys. J. C38, 43 (2004)
- [3] H1 Collaboration, paper 980 contributed to ICHEP 2002, Amsterdam. H1prelim-02-012
- [4] H1 Collaboration, paper 981 contributed to ICHEP 2002, Amsterdam. H1prelim-02-112
- [5] H1 Collaboration, paper 5-090 contributed to EPS 2003, Aachen. H1prelim-03-011
- [6] H1 Collaboration, paper 984 contributed to ICHEP 2002, Amsterdam. H1prelim-01-112
- [7] J. Collins, Phys. Rev. D57, 3051 (1998). Erratum ibid D61 (2000) 019902
- [8] H1 Collaboration, paper 6-0177 contributed to ICHEP 2004, Beijing. H1prelim-04-113
- [9] H1 Collaboration, paper 6-0178 contributed to ICHEP 2004, Beijing. H1prelim-04-111
- [10] J. Collins, L. Frankfurt, M. Strikman, Phys. Lett. B307, 161 (1993)
- [11] A. Berera, D. Soper, Phys. Rev. D50, 4328 (1994)
- [12] A. Berera, D. Soper, Phys. Rev. D53, 6162 (1996)
- [13] T. Affolder et al. [CDF Collaboration], Phys. Rev. Lett. 84, 5043 (2000)
- [14] J. Bjorken, Phys. Rev. D47, 101 (1993)
- [15] E. Gotsman, E. Levin, U. Maor, Phys. Lett. B438, 229 (1998)
- [16] B. Cox, J. Forshaw, L. Lonnblad, JHEP 10, 023 (1999)
- [17] A. Kaidalov, V. Khoze, A. Martin, M. Ryskin, Phys. Lett. B567, 61 (2003)
- [18] J. Forshaw, these proceedings
- [19] C. Adloff et al. [H1 Collaboration], Z. Phys. C76, 613 (1997)
- [20] C. Adloff et al. [H1 Collaboration], Z. Phys. C74, 221 (1997)
- [21] H1 Collaboration, paper 571 contributed to ICHEP 1998, Vancouver
- [22] L. Trentadue, G. Veneziano, Phys. Lett. B323, 201 (1994)
- [23] M. Grazzini, L. Trentadue, G. Veneziano, Nucl. Phys. B519, 394 (1998)
- [24] J. Blumlein, D. Robaschik, Phys. Rev. D65, 096002 (2002)
- [25] A. Hebecker, Nucl. Phys. B505, 349 (1997)
- [26] G. Ingelman, P. Schlein, Phys. Lett. B152, 256 (1985)
- [27] J. Owens, Phys. Rev. D30, 943 (1984)
- [28] C. Adloff et al. [H1 Collaboration], Eur. Phys. J. C21, 33 (2001)
- [29] C. Pascaud, F. Zomer, Preprint LAL-95-05
- [30] A. Martin, R. Roberts, J. Stirling, R. Thorne, Phys. Lett. B531, 216 (2002)
- [31] G. Watt, A. Martin, M. Ryskin, these proceedings
- [32] K. Prytz, Phys. Lett. B311, 286 (1993).