meson at CDF \runauthorCDF collaboration
Studies of the meson at CDF
Abstract
We present the latest measurements of the meson properties using 360 of data collected by the CDF detector. The results include the mass and the ratio of branching fraction with respect to .
1 INTRODUCTION
Within the standard model of elementary particles, five of the six different kinds of quarks combine in quark-antiquark pairs to make mesons. The meson is the combination of the two heaviest of these quarks, and is made of a bottom-charm antiquark-quark pair. The CDF collaboration made the first observation of the meson in the semileptonic decay channels , in a sample of 110 pb-1 of data at TeV in Run I at the Tevatron [1]. With a signal of 20.4 events, the mass was measured to be 6.40 0.39(stat) 0.13(syst) GeV/. Recently, the D0 Collaboration reported a preliminary observation of a signal in the decay channel in a sample of 210 pb-1 of Run II data [2]. Up to now it has not been observed in any fully reconstructed decay mode. Consequently, its mass has not been measured with good precision.
In collision, the parton subprocess of gluon-gluon fusion is the dominant process for the production. In the leading approximation of QCD perturbation theory, the calculation of subprocess for cross section involves diagrams in the fourth order over the coupling constant while the process for the production involves order over . The production cross section of at Tevatron is thus predicted to be rather low, in the order of of that for . Latest calculations give a number of the order of 7.4 . The main channel of meson decay occurs through the weak decays of the -quark or the -quark, which are respectively about 25% and 65% of the total decay width [3, 4]. The rest is given by the annihilation decays .
The CDF II detector consists of a magnetic spectrometer surrounded by calorimeters and muon chambers and is described in detail elsewhere [5]. The components relevant to this analysis are briefly described here. The tracking system is in a 1.4 T axial magnetic field and consists of a silicon microstrip detector (L00, SVX, ISL) [6, 7, 8] surrounded by an open-cell wire drift chamber (COT) [9]. The muon detectors used for this analysis are the central muon drift chambers (CMU), covering the pseudorapidity range [10, 11], and the extension muon drift chambers (CMX), covering . Soft electrons are identified as tracks pointing to a cluster in the Central Electromagnetic Calorimeter (CEM), with additional information provided by the Central Shower Maximum Detector (CES), a proportional wire chamber with 2-dimensional position measurement capability, placed roughly at a depth of 6 radiation lengths in the CEM, near shower maximum, and by the Central Pre Radiator (CPR) a plane of multi wire proportional chambers situated in the gap between the solenoid coil and the CEM, providing measurement in the x coordinate only.
These measurements use events containing muon pairs with 1.0, recorded with a three-level trigger, requiring pairs of muons with opposite charge, and invariant mass between 2700 and 4000 MeV/. This will form the main “” sample for this analysis. For particle identification studies, samples collected with a 2-track trigger () and a single electron trigger () are used.
2 ANALYSIS
The analyses presented here are divided into semileptonic decays ( with or ) and fully reconstructed decay ). The former has the advantage of a larger branching fraction () and statistics, but it reduces essentially to a counting experiment with the necessity of a careful determination of the background, while the latter provides a precise determination of the mass, but a lower rate.
2.1 Semileptonic channels
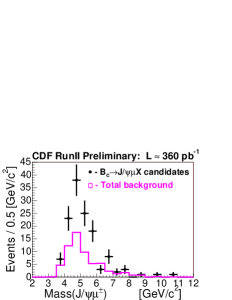
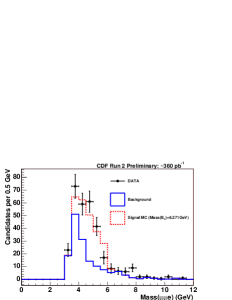
The kinematical region for the semileptonic decay is the range between the mass of the mass and the mass. Assuming GeV we see that most of the signal events lie between 4 and 6 GeV, which is defined as the search window. The search consists in counting the candidates in this window and compare them with the expected background events. The sources of background are the following:
-
•
Fake from
-
•
Conversion electrons (only for the channel)
-
•
events, with and
-
•
Fake , i.e. unrelated muon pairs which appear to have a common vertex and invariant mass close to the .
The fake rate is estimated from the and samples, where the , and particles can be identified with certainty and events counted by fitting the and invariant mass peaks. The probability for a , and to be identified as a lepton will be the ratio between the number of events that passed all of the lepton identification cuts and the total number of events in the sample. Once this rate has been measured, it is multiplied by the probability for the third track in the vertex to be a , or . This number is extracted from a fit of the distribution of the Time Of Flight and data and from Monte Carlo simulation.
The background from conversion electrons, i.e. those events where only one electron is identified and associated to the muon pair, is estimated by evaluating from a full simulation of the detector the efficiency for identifying conversions. This efficiency is dependent on the momentum of electrons. It is then normalized to the data sample.
Pair of -quarks are produced by three processes: flavour creation, gluon splitting and flavour excitation. These processes are generated with the Pythia program [12] and passed through the full CDF simulation to evaluate the background from events, then the number of such events is normalized to data, using the sample. The relative importance of the three processes in Pythia is checked with data, by fitting the angle separation between the and the muon.
Finally, the amount of fake events is estimated from the sidebands of the invariant mass distribution of the .
| Fake | ||
| Conversions | NA | |
| Fake | negl. | |
| Fake & | negl. | |
| Total backg. | ||
| Signal events | ||
| Significance |
Table 1 shows the summary of all backgrounds with their contribution, the number of signal events, and the significance, defined as the probability that the background may fluctuate as much as to reproduce the observed signal.
Figures 1 and 2 show the invariant mass distributions of signal and background events for, respectively, the and channels.
By carefully evaluating the detection efficiency for signal and reference channel, we obtain the main result of these measurements, which is the ratio of branching ratios:
and
2.2 Fully reconstructed decay [13]
The search was performed using a blind analysis method. The mass values of the combinations in the search window 5600 7200 MeV/, referred to as candidates, were temporarily hidden.
In order to optimize the significance of a possible signal, we varied the selection criteria to maximize the function [14]. Here, is the accepted fraction of signal events, in this case taken from a Monte Carlo sample, and the background is the number of accepted candidates. The following optimized selection criteria were used: a quality requirement on the three-track 3-D vertex fit ( 9 for four degrees of freedom), a requirement on the pion track contribution to the vertex fit ( 2.6), the impact parameter of the candidate with respect to the primary vertex ( 65 m), the maximum where is the proper decay time of the candidate ( 750 m), the transverse momentum of the pion ( 1.8 GeV/), the 3-D angle between the momentum of the candidate and the vector joining the primary to the secondary vertex ( 0.4 rad), and the significance of the projected decay length of the candidate onto its transverse momentum direction ( 4.4). Because of the relatively long lifetime, vertex cuts are critical in this analysis.
A sample of mesons, reconstructed in the decay mode , was analyzed as a control sample in order to check our understanding of the reconstruction of the relevant variables in the simulation.
Before “unblinding” the mass distribution, a procedure to search for a signal peak was defined. This was based on a scan of the search region, with a sliding fit window. We applied the fitting procedure to the 390 candidates in the unblinded mass distribution. This provides a value of as a function of the mass in the search window. A maximum value of is found at a mass 6290 MeV/
A set of Monte Carlo experiments was performed to determine the expected distribution of for pure background samples [15]. The data value of was found to be exceeded in 0.27% of Monte Carlo scans
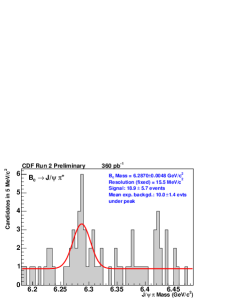
The exact value of the mass is found with an unbinned likelyhood fit, shown in figure 3. Systematic uncertainties on the mass determination due to measurement uncertainties on the track parameters ( MeV/), the momentum scale ( MeV/), the possible differences in the spectra of the and mesons (0.5 MeV/) and our limited knowledge of the background shape used in the final mass fit (0.8 MeV/). The total systematic uncertainty is evaluated to be MeV/.
We observe 18.9 5.7 signal events on a background of 10.0 1.4 events and the fit to the mass spectrum yields a mass of 6287.0 4.8(stat) 1.1(syst) MeV/.
3 CONCLUSION
We performed a measurement of mass and ratio of branching fractions of the meson, on a sample of pb of collisions collected at TeV by Collider Detector at Fermilab (CDF ) at the Tevatron during Run II. Results are compatible with theory and previous measurements. The Tevatron has recently achieved 1fb-1 of data, with which we plan to update these measurements.
References
- [1] CDF Collaboration, F. Abe et al., Phys. Rev. Lett. 81, 2432 (1998); F. Abe et al., Phys. Rev. D58, 112004 (1998).
- [2] D. Lucchesi in ICHEP 2004, ed. H. Chen et al. (World Scientific, Singapore, 2005).
- [3] V. A. Saleev, D. V. Vasin, Phys. Lett. B605 (2005), 311
- [4] V.V. Kiselev, hep-ph/0308214.
- [5] CDF Collaboration, D. Acosta et al., Phys. Rev. D71, 032001 (2005).
- [6] A. Sill et al., Nucl. Instrum. & Methods A 447, 1 (2000).
- [7] A. Affolder et al., Nucl. Instrum. & Methods A 453, 84 (2000).
- [8] C.S. Hill et al., Nucl. Instrum. & Methods A 530, 1 (2004).
- [9] T. Affolder et al., Nucl. Instrum. & Methods A 526, 249 (2004).
- [10] G. Ascoli et al., Nucl. Instrum. & Methods A 268, 33 (1988).
- [11] T. Dorigo et al., Nucl. Instrum. & Methods A 461, 560 (2001).
- [12] T. Sjöstrand et al., Computer Phys. Commun. 135 (2001) 238
- [13] CDF collaboration, arXiv:hep-ex/0505076
- [14] G. Punzi, arXiv:physics/0308063.
- [15] W.A. Rolke and A.M. Lopez, arXiv:physics/0312141.