Study of Kβˆ’superscript𝐾K^{-}β†’bold-β†’\rightarrowΟ€πŸŽβ€‹eβˆ’β€‹Ξ½Β―esuperscriptπœ‹0superscript𝑒subscriptbold-Β―πœˆπ‘’\pi^{0}e^{-}\overline{\nu}_{e}γ𝛾\gamma decay with ISTRA+ setup.

S.A. Akimenkob, V.Β N.Β Bolotova, G.Β I.Β Brivich b, K.Β V.Β Datskob, V.Β A.Β Duka,
A.Β P.Β Filinb, E.Β N.Β Guschina, A.Β V.Β Inyakinb, V.Β F.Β Konstantinovb,
A.Β S.Β Konstantinovb, I.Β Y.Β Korolkovb, S.Β V.Β Lapteva, V.Β A.Β Lebedeva,
V.Β M.Β Leontievb, A.Β E.Β Mazurova, V.Β P.Β Novikovb, V.Β F.Β Obraztsovb,
V.Β A.Β Polyakovb, A.Β Yu.Β Polyarusha, V.Β E.Β Postoeva, V.Β I.Β Romanovskyb,
V.Β I.Β Shelikhovb, O.Β G.Β Tchikilevb, V.Β A.Β Uvarovb, O.β€˜P.Β Yushchenkob
a Institute for Nuclear Research
INR RAS, prospekt 60-letiya Oktyabrya 7a, Moscow 117312, Russia
b
Institute for High Energy Physics
Protvino, Russia
(10.10.2006)
Abstract

Results of study of the Kβˆ’β†’Ο€0​e​ν¯​γ→superscript𝐾superscriptπœ‹0π‘’Β―πœˆπ›ΎK^{-}\rightarrow\pi^{0}e\overline{\nu}\gamma decay at ISTRA+ setup are presented. 4476 events of this decay have been observed. The branching ratio (R) is found to be R=B​r​(Kβˆ’β†’Ο€0​eβˆ’β€‹Ξ½Β―e​γ)B​r​(Kβˆ’β†’Ο€0​eβˆ’β€‹Ξ½Β―e)=(1.81Β±0.03​(s​t​a​t)Β±0.07​(s​y​s​t))β‹…10βˆ’2π‘…π΅π‘Ÿβ†’superscript𝐾superscriptπœ‹0superscript𝑒subscriptΒ―πœˆπ‘’π›Ύπ΅π‘Ÿβ†’superscript𝐾superscriptπœ‹0superscript𝑒subscriptΒ―πœˆπ‘’β‹…plus-or-minus1.810.03π‘ π‘‘π‘Žπ‘‘0.07𝑠𝑦𝑠𝑑superscript102R=\frac{Br(K^{-}\rightarrow\pi^{0}e^{-}\overline{\nu}_{e}\gamma)}{Br(K^{-}\rightarrow\pi^{0}e^{-}\overline{\nu}_{e})}=(1.81\pm 0.03(stat)\pm 0.07(syst))\cdot 10^{-2} for EΞ³βˆ—>10​M​e​Vsubscriptsuperscript𝐸𝛾10𝑀𝑒𝑉E^{*}_{\gamma}>10MeV and ΞΈeβ€‹Ξ³βˆ—>10∘subscriptsuperscriptπœƒπ‘’π›Ύsuperscript10\theta^{*}_{e\gamma}>10^{\circ}. For comparison with previous experiment the branching ratio with cuts EΞ³βˆ—>10subscriptsuperscript𝐸𝛾10E^{*}_{\gamma}>10MeV, 0.6<c​o​s​θeβ€‹Ξ³βˆ—<0.90.6π‘π‘œπ‘ subscriptsuperscriptπœƒπ‘’π›Ύ0.90.6<cos\theta^{*}_{e\gamma}<0.9 is measured R=B​r​(Kβˆ’β†’Ο€0​eβˆ’β€‹Ξ½Β―e​γ)B​r​(Kβˆ’β†’Ο€0​eβˆ’β€‹Ξ½Β―e)=(0.47Β±0.02​(s​t​a​t)Β±0.03​(s​y​s​t))β‹…10βˆ’2.π‘…π΅π‘Ÿβ†’superscript𝐾superscriptπœ‹0superscript𝑒subscriptΒ―πœˆπ‘’π›Ύπ΅π‘Ÿβ†’superscript𝐾superscriptπœ‹0superscript𝑒subscriptΒ―πœˆπ‘’β‹…plus-or-minus0.470.02π‘ π‘‘π‘Žπ‘‘0.03𝑠𝑦𝑠𝑑superscript102R=\frac{Br(K^{-}\rightarrow\pi^{0}e^{-}\overline{\nu}_{e}\gamma)}{Br(K^{-}\rightarrow\pi^{0}e^{-}\overline{\nu}_{e})}=(0.47\pm 0.02(stat)\pm 0.03(syst))\cdot 10^{-2}. For the cuts Eβˆ—β€‹(Ξ³)>30​M​e​Vsuperscript𝐸𝛾30𝑀𝑒𝑉E^{*}(\gamma)>30MeV and ΞΈeβ€‹Ξ³βˆ—>20∘subscriptsuperscriptπœƒπ‘’π›Ύsuperscript20\theta^{*}_{e\gamma}>20^{\circ}, used in most theoretical papers B​r=(3.06Β±0.09Β±0.14)β‹…10βˆ’4π΅π‘Ÿβ‹…plus-or-minus3.060.090.14superscript104Br=(3.06\pm 0.09\pm 0.14)\cdot 10^{-4}. For the asymmetry AΞΎsubscriptπ΄πœ‰A_{\xi}(for the same cuts as in Table.2) we get AΞΎ=βˆ’0.015Β±0.021subscriptπ΄πœ‰plus-or-minus0.0150.021A_{\xi}=-0.015\pm 0.021. At present time it is the best estimate of this asymmetry.

%newpage

1 Introduction

The decay Kβˆ’β†’Ο€0​eβˆ’β€‹Ξ½Β―β€‹Ξ³β†’superscript𝐾superscriptπœ‹0superscriptπ‘’Β―πœˆπ›ΎK^{-}\rightarrow\pi^{0}e^{-}\overline{\nu}\gamma provides fertile testing ground for the Chiral Perturbation Theory (ChPT) [1, 2]. Kβˆ’β†’Ο€0​e​ν¯​γ→superscript𝐾superscriptπœ‹0π‘’Β―πœˆπ›ΎK^{-}\rightarrow\pi^{0}e\overline{\nu}\gamma decay amplitudes are calculated at order ChPT O​(p4)𝑂superscript𝑝4O(p^{4}) in [1], and branching ratios are evaluated in [3]. Recently next-to-leading O​(p6)𝑂superscript𝑝6O(p^{6}) corrections were calculated for the corresponding neutral kaon decay [4].

The matrix element for Kβˆ’β†’Ο€0​e​ν¯​γ→superscript𝐾superscriptπœ‹0π‘’Β―πœˆπ›ΎK^{-}\rightarrow\pi^{0}e\overline{\nu}\gamma has general structure

T=GF2eVu​sΡμ(q){(VΞΌβ€‹Ξ½βˆ’Aμ​ν)uΒ―(pΞ½)Ξ³Ξ½(1βˆ’Ξ³5)v(pl)\displaystyle T=\frac{G_{F}}{\sqrt{2}}{e}V_{us}\varepsilon^{\mu}(q)\Biggl{\{}(V_{\mu\nu}-A_{\mu\nu})\overline{u}(p_{\nu})\gamma^{\nu}(1-\gamma_{5})v(p_{l}) (1)
+FΞ½2​pl​quΒ―(pΞ½)Ξ³Ξ½(1βˆ’Ξ³5)(mlβˆ’pΜΈlβˆ’qΜΈ)Ξ³ΞΌv(pl)}≑ϡμAΞΌ.\displaystyle\qquad\qquad\qquad+\frac{F_{\nu}}{2p_{l}q}\overline{u}(p_{\nu})\gamma^{\nu}(1-\gamma_{5})(m_{l}-\not{{p}_{l}}-\not{q})\gamma_{\mu}v(p_{l})\Biggr{\}}\equiv{\epsilon^{\mu}}A_{\mu}.

First term of the matrix element describes Bremsstrahlung of kaon and direct emission(Fig.1a). The lepton Bremsstrahlung is presented by second term in r.h.s. of Eq(1) and (Fig.1b).

Refer to caption

Figure 1: Diagrammatic representation of the Kl​3​γsubscript𝐾𝑙3𝛾K_{l3\gamma} amplitude.

The Kβˆ’β†’Ο€0​e​ν¯​γ→superscript𝐾superscriptπœ‹0π‘’Β―πœˆπ›ΎK^{-}\rightarrow\pi^{0}e\overline{\nu}\gamma decay is one of kaon decays where new physics beyond the SM can be probed. This decay is especially interesting as it is sensitive to T-odd contributions. According to CPT-theorem observation of T violation is equivalent to observation of CP-violating effects. CP violation is a subject of continuing interest in K and B meson decays.

In the SM the source of CP violation is given by the phase in the CKM matrix[5, 6, 7]. However it has been argued that this source is not enough to explain the observed baryon asymmetry of the universe and new sources of CP violation have to be introduced[8].

Important experimental observable used in CP-violation searches is the T-odd correlation for Kβˆ’β†’Ο€0​e​ν¯​γ→superscript𝐾superscriptπœ‹0π‘’Β―πœˆπ›ΎK^{-}\rightarrow\pi^{0}e\overline{\nu}\gamma decay defined as

ξπ​e​γ=1MK3​pΞ³β‹…[pπ×pe]subscriptπœ‰πœ‹π‘’π›Ύβ‹…1subscriptsuperscript𝑀3𝐾subscript𝑝𝛾delimited-[]subscriptπ‘πœ‹subscript𝑝𝑒\xi_{\pi e\gamma}=\frac{1}{M^{3}_{K}}p_{\gamma}\cdot[p_{\pi}\times p_{e}] (2)

First suggestion to investigate T-odd triple-product correlations was done in[9]

To establish the presence of a nonzero triple-product correlations, one constructs a T-odd asymmetry of the form

AΞΎ=N+βˆ’Nβˆ’N++Nβˆ’subscriptπ΄πœ‰subscript𝑁subscript𝑁subscript𝑁subscript𝑁A_{\xi}=\frac{N_{+}-N_{-}}{N_{+}+N_{-}} (3)

Where N+subscript𝑁N_{+} and Nβˆ’subscript𝑁N_{-} are number of events with ΞΎ>0πœ‰0\xi>0 and ΞΎ<0πœ‰0\xi<0

T-odd correlation vanishes at tree level of SM[10], but the SUSY theory gives rise to CP-odd(T-odd) observables already at tree level[11, 12, 13]. T-odd asymmetry value for
S​U​(2)Lπ‘†π‘ˆsubscript2𝐿SU(2)_{L}Γ—\timesS​U​(2)Rπ‘†π‘ˆsubscript2𝑅SU(2)_{R}Γ—\timesU​(1)π‘ˆ1U(1) model and scalar models was estimated in Ref[14].

In this letter we present first results of the analysis of the Kβˆ’β†’Ο€0​e​ν¯​γ→superscript𝐾superscriptπœ‹0π‘’Β―πœˆπ›ΎK^{-}\rightarrow\pi^{0}e\overline{\nu}\gamma data accumulated by ISTRA+ experiment during the 2001 run.

2 ISTRA+ setup

Refer to caption
Figure 2: The side view of the ISTRA+ detector

The experiment was performed using ISTRA+ detector which is modernized ISTRA-M detector [15]. ISTRA+ detector is located in a negative unseparated beam. The measurement of the beam particles, deflected by the beam magnet M1 is performed by four beam proportional chambers B​P​C1Γ·B​P​C4𝐡𝑃subscript𝐢1𝐡𝑃subscript𝐢4BPC_{1}\div BPC_{4}. The beam momentum is ∼25​G​e​Vsimilar-toabsent25𝐺𝑒𝑉\sim 25GeV with Δ​p/p∼1.5%similar-toΔ𝑝𝑝percent1.5\Delta p/p\sim 1.5\%. Admixture of Kβˆ’superscript𝐾K^{-} in the beam is ∼3%similar-toabsentpercent3\sim 3\%. The beam intensity is ∼3β‹…106similar-toabsentβ‹…3superscript106\sim 3\cdot 10^{6} per 1.9 sec U-70 spill. The kaon identification is performed by C0Λ‡Γ·C2Λ‡Λ‡subscript𝐢0Λ‡subscript𝐢2\check{C_{0}}\div\check{C_{2}} threshold Cˇˇ𝐢\check{C}-counters (C0Λ‡Λ‡subscript𝐢0\check{C_{0}} is not shown in Fig.2).

The decay products are deflected by the spectrometer magnet M2 with the field integral of 1Tm. The track measurement is performed by 1-mm-step proportional chambers (P​C1Γ·P​C3𝑃subscript𝐢1𝑃subscript𝐢3PC_{1}\div PC_{3}), 2-cm-cell drift chambers (D​C1Γ·D​C3𝐷subscript𝐢1𝐷subscript𝐢3DC_{1}\div DC_{3}), and by four planes of the 2-cm-diameter drift tubes DT. The photons are measured by lead-glass electromagnetic calorimeter S​P1𝑆subscript𝑃1SP_{1} which consists of 576 counters. The counter transverse size is 5.2Γ—5.25.25.25.2\times 5.2 cm and length is about 15 X0subscript𝑋0X_{0}. To veto low energy photons the decay volume is surrounded by eight lead-glass rings. Lead-glass electromagnetic calorimeter S​P2𝑆subscript𝑃2SP_{2} is also used as a part of the veto system.

3 Event selection

During physics run in November-December 2001 350M events were logged on tapes. This information is complemented by 260M events generated with Geant3 [16]. The Monte Carlo simulation includes a realistic description of the experimental setup: the decay volume entrance windows, the track chamber windows, gas mixtures, sense wires and cathode structures, Cherenkov counters mirrors and gas mixtures, the showers development in the electromagnetic calorimeters, etc. The detailed discussion of the simulation and reconstruction procedure is given in our previous publications [17, 18].

Events with one negative track detected in tracking system and four showers detected in electoromagnetic calorimeter SP1 are selected as candidates for Kβˆ’β†’Ο€0​e​ν​γ→superscript𝐾superscriptπœ‹0π‘’πœˆπ›ΎK^{-}\rightarrow\pi^{0}e\nu\gamma decay. One of this showers must be associated with the charged track.

Events with vertex inside interval 400<z<1650400𝑧1650400<z<1650 cm, and transverse radius less than 10cm is selected for further analysis.

The probability of the vertex fit, C​L​(Ο‡2)𝐢𝐿superscriptπœ’2CL(\chi^{2}), is required to be more than 10βˆ’4superscript10410^{-4}. Absence of signals in veto system above noise threshold is required.

The electron identification is done using E/P ratio of the energy of the cluster associated with the track to momentum of this track given by tracking system. This ratio must be inside interval 0.80-1.15(see Fig.3). Another cut used for the suppression of the Ο€βˆ’superscriptπœ‹\pi^{-} contamination is that on the distance between the charged track extrapolation to the front plane of the electoromagnetic detector and the nearest shower. This distance must be less than 2,5 cm.
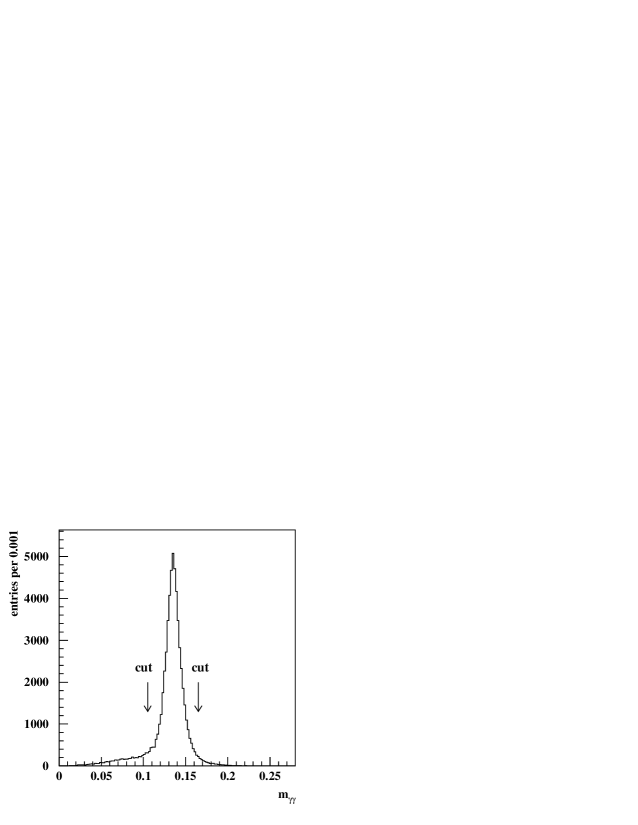
The effective mass m​(γ​γ)π‘šπ›Ύπ›Ύm(\gamma\gamma) within Β±30plus-or-minus30\pm 30 MeV from Ο€0superscriptπœ‹0\pi^{0} table mass (Fig.4) is required.

At the end, the convergence of the 2C Kβˆ’superscript𝐾K^{-}β†’β†’\rightarrowΟ€0​eβˆ’β€‹Ξ½Β―esuperscriptπœ‹0superscript𝑒subscriptΒ―πœˆπ‘’\pi^{0}e^{-}\overline{\nu}_{e}γ𝛾\gamma kinematic fit is required.

Refer to caption
Figure 3: E/P ratio for the real data. Dotted line is our fit of background.
Refer to caption
Figure 4: γ​γ𝛾𝛾\gamma\gamma mass for the real data.

4 Background suppression

The main background decay channels for the decay Kβˆ’superscript𝐾K^{-}β†’β†’\rightarrowΟ€0​eβˆ’β€‹Ξ½Β―esuperscriptπœ‹0superscript𝑒subscriptΒ―πœˆπ‘’\pi^{0}e^{-}\overline{\nu}_{e}γ𝛾\gamma are:

(1) Kβˆ’β†’Ο€βˆ’β€‹Ο€0​π0β†’superscript𝐾superscriptπœ‹superscriptπœ‹0superscriptπœ‹0K^{-}\rightarrow\pi^{-}\pi^{0}\pi^{0} where one of the Ο€0superscriptπœ‹0\pi^{0} photons is not detected and Ο€βˆ’superscriptπœ‹\pi^{-} decays to eβ€‹Ξ½π‘’πœˆe\nu or is misidentified as an electron.

(2) Kβˆ’β†’Ο€βˆ’β€‹Ο€0β†’superscript𝐾superscriptπœ‹superscriptπœ‹0K^{-}\rightarrow\pi^{-}\pi^{0} with β€œfake photon” and Ο€βˆ’superscriptπœ‹\pi^{-} decayed or misidentified as electron. Fake photon clusters can come from Ο€πœ‹\pi-hadron interaction in the detector, external bremsstrahlung upstream of the magnet, accidentals. All these sources are included in our MC calculations.

(3) Kβˆ’β†’Ο€0​e​ν→superscript𝐾superscriptπœ‹0π‘’πœˆK^{-}\rightarrow\pi^{0}e\nu with extra photon. The main source of extra photons is an electron interactions in the detector.

(4) Kβˆ’β†’Ο€βˆ’β€‹Ο€0​γ→superscript𝐾superscriptπœ‹superscriptπœ‹0𝛾K^{-}\rightarrow\pi^{-}\pi^{0}\gamma when Ο€βˆ’superscriptπœ‹\pi^{-} decays or is mis-identified as an electron.

(5) Kβˆ’β†’Ο€0​π0​e​ν→superscript𝐾superscriptπœ‹0superscriptπœ‹0π‘’πœˆK^{-}\rightarrow\pi^{0}\pi^{0}e\nu when one γ𝛾\gamma is lost

From Fig.3 it is seen that in raw data background contamination from channels with charged pion in final state is about 15%.

Requirement on the missing energy in the decay reduces mainly background channel(4).

Cut1: Β Β Β Β Β Β  Em​i​s​s>0.5​G​e​VsubscriptπΈπ‘šπ‘–π‘ π‘ 0.5𝐺𝑒𝑉E_{miss}>0.5GeV

For the suppression of the background channels (1-5) we use a cut on the missing mass squared

M2superscript𝑀2M^{2}(Ο€0​e​γ)superscriptπœ‹0𝑒𝛾(\pi^{0}e\gamma) = (PKβˆ’PΟ€0βˆ’Peβˆ’PΞ³)2superscriptsubscript𝑃𝐾subscript𝑃superscriptπœ‹0subscript𝑃𝑒subscript𝑃𝛾2(P_{K}-P_{\pi^{0}}-P_{e}-P_{\gamma})^{2}.

For the signal events this variable corresponds to the square of the neutrino mass and must be zero within measurement accuracy (see Fig.5).

Cut2: Β Β Β Β Β Β  βˆ’0.01<M2​(Ο€0​eβˆ’β€‹Ξ³)<0.010.01superscript𝑀2superscriptπœ‹0superscript𝑒𝛾0.01-0.01<M^{2}(\pi^{0}e^{-}\gamma)<0.01

Refer to caption
Refer to caption
Figure 5: Missing mass M2​(Ο€0​eβˆ’β€‹Ξ³)superscript𝑀2superscriptπœ‹0superscript𝑒𝛾M^{2}(\pi^{0}e^{-}\gamma) distribution; a) for the real data b) for the background channel(1).

For the suppression of the background channel(1) we also use a cut on the missing mass squared M2​(Ο€βˆ’β€‹Ο€0)=(PKβˆ’PΟ€βˆ’βˆ’PΟ€0)2superscript𝑀2superscriptπœ‹superscriptπœ‹0superscriptsubscript𝑃𝐾subscript𝑃superscriptπœ‹subscript𝑃superscriptπœ‹02M^{2}(\pi^{-}\pi^{0})=(P_{K}-P_{\pi^{-}}-P_{\pi^{0}})^{2}

For the background(1) events this variable corresponds to Ο€0superscriptπœ‹0\pi^{0} mass, for the signal events distribution of this variable is rather wide (see Fig.6).

Cut3: Β Β Β Β Β Β  The events with 0.009<M2​(Ο€βˆ’β€‹Ο€0)<0.0240.009superscript𝑀2superscriptπœ‹superscriptπœ‹00.0240.009<M^{2}(\pi^{-}\pi^{0})<0.024 are cutted out.

Refer to caption
Refer to caption
Figure 6: missing mass distribution M2​(Ο€βˆ’β€‹Ο€0)superscript𝑀2superscriptπœ‹superscriptπœ‹0M^{2}(\pi^{-}\pi^{0}) a) for real data; b) for the background (1)

The dominant background to Ke​3​γsubscript𝐾𝑒3𝛾K_{e3\gamma} arises from Ke​3subscript𝐾𝑒3K_{e3} with extra photon. The background (3) is suppressed by requirement on the angle between electron and photon in the laboratory frame ΞΈe​γsubscriptπœƒπ‘’π›Ύ\theta_{e\gamma} (see Fig.7) The distribution of the Ke​3subscript𝐾𝑒3K_{e3}-background events has very sharp peak at zero angle. This peak is significantly narrower than that for signal events. This happens, in particular, because the emission of the photons by the electron from Ke​3subscript𝐾𝑒3K_{e3} decay occurs in the setup material downstream the decay vertex, but angle is still calculated as if emission comes from the vertex.

Cut4: Β Β Β Β Β Β  0.002<ΞΈe​γ0.002subscriptπœƒπ‘’π›Ύ0.002<\theta_{e\gamma} <0.030absent0.030<0.030

Right part of this cut is introduced for suppression of background channels(1,2,4,5). After all cuts 6079 event are selected, with a background of 1603 events. Background normalization is done by comparison numbers of events for Ke​3subscript𝐾𝑒3K_{e3} decay in MC and real data samples.

Event reductions statistics are summarized in Table 1.

Refer to caption
Refer to caption
Figure 7: Distribution over ΞΈe​γsubscriptπœƒπ‘’π›Ύ\theta_{e\gamma} - the angle between electron and photon in lab. system. a) real data; b)MC background (histogram) and signal(points with errors)
Cut real data background signal MC
Number of events selected 41072 32901 11180
Em​i​s​s>0.5​G​e​VsubscriptπΈπ‘šπ‘–π‘ π‘ 0.5𝐺𝑒𝑉E_{miss}>0.5GeV 37428 31134 10035
βˆ’0.01<M2​(Ο€0​eβˆ’β€‹Ξ³)<0.010.01superscript𝑀2superscriptπœ‹0superscript𝑒𝛾0.01-0.01<M^{2}(\pi^{0}e^{-}\gamma)<0.01 26277 25287 8430
0.09<M2​(Ο€βˆ’β€‹Ο€0)<0.240.09superscript𝑀2superscriptπœ‹superscriptπœ‹00.240.09<M^{2}(\pi^{-}\pi^{0})<0.24 23293 21648 7153
0.002<0.002absent0.002<ΞΈe​γ<0.030subscriptπœƒπ‘’π›Ύ0.030\theta_{e\gamma}<0.030 6079 1603 4476
Table 1: Event reduction statistics for the real data, the background MC and signal MC.

5 Results

Re​x​pΓ—102subscript𝑅𝑒π‘₯𝑝superscript102R_{exp}\times 10^{2} ev numb experiment
0.47Β±0.02plus-or-minus0.470.020.47\pm 0.02 1456 this exp.
0.46Β±0.08plus-or-minus0.460.080.46\pm 0.08 82 XEBC [19]
0.56Β±0.04plus-or-minus0.560.040.56\pm 0.04 192 ISTRA [20]
0.76Β±0.28plus-or-minus0.760.280.76\pm 0.28 13 HLBC [21]
Table 2: B​r​(Kβˆ’β†’Ο€0​eβˆ’β€‹Ξ½Β―e​γ)/B​r​(Kβˆ’β†’Ο€0​eβˆ’β€‹Ξ½Β―e)π΅π‘Ÿβ†’superscript𝐾superscriptπœ‹0superscript𝑒subscriptΒ―πœˆπ‘’π›Ύπ΅π‘Ÿβ†’superscript𝐾superscriptπœ‹0superscript𝑒subscriptΒ―πœˆπ‘’Br(K^{-}\rightarrow\pi^{0}e^{-}\overline{\nu}_{e}\gamma)/Br(K^{-}\rightarrow\pi^{0}e^{-}\overline{\nu}_{e}) for E​(Ξ³)>10​M​e​V,0.6<c​o​s​θe​γ<0.9formulae-sequence𝐸𝛾10𝑀𝑒𝑉0.6π‘π‘œπ‘ subscriptπœƒπ‘’π›Ύ0.9E(\gamma)>10MeV,0.6<cos\theta_{e\gamma}<0.9 in comparison with previous data.

The resulting distribution of the selected events over cosΞΈeβ€‹Ξ³βˆ—cos\theta{{}^{*}}_{e\gamma}, ΞΈeβ€‹Ξ³βˆ—\theta{{}^{*}}_{e\gamma} being the angle between the electron and the photon in the kaon rest frame is shown in Fig.8. The distribution over Eeβ€‹Ξ³βˆ—E{{}^{*}}_{e\gamma} - the photon energy in the kaon rest frame is shown in Fig. 9. Reasonable agreement of the date with MC is seen. When generating the signal MC, a generator based on O​(p2)𝑂superscript𝑝2O(p^{2}) [10] is used.

Refer to caption
Refer to caption
Figure 8: a) The distribution of the events over c​o​s​θeβ€‹Ξ³βˆ—π‘π‘œπ‘ subscriptsuperscriptπœƒπ‘’π›Ύcos\theta^{*}_{e\gamma}. Points with errors are the real data, histogram is - total MC signal plus background. Dotted line histogram is background. b)the same after background subtraction
Refer to caption
Figure 9: The distribution of the events over EΞ³βˆ—subscriptsuperscript𝐸𝛾E^{*}_{\gamma}- the energy of the photon in the kaon rest frame. Histogram corresponds to the data, points with errors- total signal plus background MC.

To obtain the branching ratio of the KΟ€0​eβˆ’β€‹Ξ½Β―e​γsubscript𝐾superscriptπœ‹0superscript𝑒subscriptΒ―πœˆπ‘’π›ΎK_{\pi^{0}e^{-}\overline{\nu}_{e}\gamma} relative to the Ke​3subscript𝐾𝑒3K_{e3} (R), the background and efficiency corrected number of Ke​3​γsubscript𝐾𝑒3𝛾K_{e3\gamma} events is compared to that of 569923Β Β  Ke​3subscript𝐾𝑒3K_{e3} events found with the similar selection criteria. The branching ratio (R) is found to be

R=B​r​(Kβˆ’β†’Ο€0​eβˆ’β€‹Ξ½Β―e​γ)B​r​(Kβˆ’β†’Ο€0​eβˆ’β€‹Ξ½Β―e)=(1.81Β±0.03​(s​t​a​t)Β±0.07​(s​y​s​t))β‹…10βˆ’2π‘…π΅π‘Ÿβ†’superscript𝐾superscriptπœ‹0superscript𝑒subscriptΒ―πœˆπ‘’π›Ύπ΅π‘Ÿβ†’superscript𝐾superscriptπœ‹0superscript𝑒subscriptΒ―πœˆπ‘’β‹…plus-or-minus1.810.03π‘ π‘‘π‘Žπ‘‘0.07𝑠𝑦𝑠𝑑superscript102R=\frac{Br(K^{-}\rightarrow\pi^{0}e^{-}\overline{\nu}_{e}\gamma)}{Br(K^{-}\rightarrow\pi^{0}e^{-}\overline{\nu}_{e})}=(1.81\pm 0.03(stat)\pm 0.07(syst))\cdot 10^{-2} (4)

for EΞ³βˆ—>10​M​e​Vsubscriptsuperscript𝐸𝛾10𝑀𝑒𝑉E^{*}_{\gamma}>10MeV and ΞΈeβ€‹Ξ³βˆ—>10∘subscriptsuperscriptπœƒπ‘’π›Ύsuperscript10\theta^{*}_{e\gamma}>10^{\circ}. Systematic errors are estimated by variation of the cuts of Table 1.

For comparison with previous experiment the branching ratio with cuts EΞ³βˆ—>10subscriptsuperscript𝐸𝛾10E^{*}_{\gamma}>10MeV, 0.6<c​o​s​θeβ€‹Ξ³βˆ—<0.90.6π‘π‘œπ‘ subscriptsuperscriptπœƒπ‘’π›Ύ0.90.6<cos\theta^{*}_{e\gamma}<0.9 is calculated

R=B​r​(Kβˆ’β†’Ο€0​eβˆ’β€‹Ξ½Β―e​γ)B​r​(Kβˆ’β†’Ο€0​eβˆ’β€‹Ξ½Β―e)=(0.47Β±0.02​(s​t​a​t)Β±0.03​(s​y​s​t))β‹…10βˆ’2π‘…π΅π‘Ÿβ†’superscript𝐾superscriptπœ‹0superscript𝑒subscriptΒ―πœˆπ‘’π›Ύπ΅π‘Ÿβ†’superscript𝐾superscriptπœ‹0superscript𝑒subscriptΒ―πœˆπ‘’β‹…plus-or-minus0.470.02π‘ π‘‘π‘Žπ‘‘0.03𝑠𝑦𝑠𝑑superscript102R=\frac{Br(K^{-}\rightarrow\pi^{0}e^{-}\overline{\nu}_{e}\gamma)}{Br(K^{-}\rightarrow\pi^{0}e^{-}\overline{\nu}_{e})}=(0.47\pm 0.02(stat)\pm 0.03(syst))\cdot 10^{-2} (5)

The results of previous experiments are given in Table.2

For the cuts Eβˆ—β€‹(Ξ³)>30​M​e​Vsuperscript𝐸𝛾30𝑀𝑒𝑉E^{*}(\gamma)>30MeV and ΞΈeβ€‹Ξ³βˆ—>20∘subscriptsuperscriptπœƒπ‘’π›Ύsuperscript20\theta^{*}_{e\gamma}>20^{\circ}, used in most theoretical papers

R=B​r​(Kβˆ’β†’Ο€0​eβˆ’β€‹Ξ½Β―e​γ)B​r​(Kβˆ’β†’Ο€0​eβˆ’β€‹Ξ½Β―e)=(0.64Β±0.02​(s​t​a​t)Β±0.03​(s​y​s​t))β‹…10βˆ’2.π‘…π΅π‘Ÿβ†’superscript𝐾superscriptπœ‹0superscript𝑒subscriptΒ―πœˆπ‘’π›Ύπ΅π‘Ÿβ†’superscript𝐾superscriptπœ‹0superscript𝑒subscriptΒ―πœˆπ‘’β‹…plus-or-minus0.640.02π‘ π‘‘π‘Žπ‘‘0.03𝑠𝑦𝑠𝑑superscript102R=\frac{Br(K^{-}\rightarrow\pi^{0}e^{-}\overline{\nu}_{e}\gamma)}{Br(K^{-}\rightarrow\pi^{0}e^{-}\overline{\nu}_{e})}=(0.64\pm 0.02(stat)\pm 0.03(syst))\cdot 10^{-2}. (6)

Using PDG value for Ke​3subscript𝐾𝑒3K_{e3} decay branching for Kβˆ’β†’Ο€0​eβˆ’β€‹Ξ½Β―e​γ→superscript𝐾superscriptπœ‹0superscript𝑒subscriptΒ―πœˆπ‘’π›ΎK^{-}\rightarrow\pi^{0}e^{-}\overline{\nu}_{e}\gamma is calculated B​r=(3.06Β±0.09Β±0.14)β‹…10βˆ’4π΅π‘Ÿβ‹…plus-or-minus3.060.090.14superscript104Br=(3.06\pm 0.09\pm 0.14)\cdot 10^{-4}. It can be compared with theoretical prediction[3] at tree level B​r=2.8β‹…10βˆ’4π΅π‘Ÿβ‹…2.8superscript104Br=2.8\cdot 10^{-4} and B​r=3.0β‹…10βˆ’4π΅π‘Ÿβ‹…3.0superscript104Br=3.0\cdot 10^{-4} for O​(p4)𝑂superscript𝑝4O(p^{4}) level. Theoretical prediction of V.V.Braguta, A.A.Likhoded, A.E.Chalov[10] at tree level is B​r=3.12β‹…10βˆ’4π΅π‘Ÿβ‹…3.12superscript104Br=3.12\cdot 10^{-4}.

For the asymmetry AΞΎsubscriptπ΄πœ‰A_{\xi}(for the same cuts as in Table.2) we get

AΞΎ=βˆ’0.015Β±0.021subscriptπ΄πœ‰plus-or-minus0.0150.021A_{\xi}=-0.015\pm 0.021 (7)

At present it is the best estimate of this asymmetry. It can be compared with an upper limit on the AΞΎsubscriptπ΄πœ‰A_{\xi} value |Aξ​(Kβˆ’β†’Ο€0​eβˆ’β€‹Ξ½Β―e​γ)|<0.8β‹…10βˆ’4subscriptπ΄πœ‰β†’superscript𝐾superscriptπœ‹0superscript𝑒subscriptΒ―πœˆπ‘’π›Ύβ‹…0.8superscript104|A_{\xi}(K^{-}\rightarrow\pi^{0}e^{-}\overline{\nu}_{e}\gamma)|<0.8\cdot 10^{-4} in the S​U​(2)LΓ—S​U​(2)RΓ—U​(1)π‘†π‘ˆsubscript2πΏπ‘†π‘ˆsubscript2π‘…π‘ˆ1SU(2)_{L}\times SU(2)_{R}\times U(1) model[14] and AΞΎ=βˆ’0.59β‹…10βˆ’4subscriptπ΄πœ‰β‹…0.59superscript104A_{\xi}=-0.59\cdot 10^{-4} in the Standard Model[10]

The authors would like to thank D.S. Gorbunov, V.A. Matveev and V.A. Rubakov, for numerous discussions. V.V.Braguta, A.A.Likhoded, A.E.Chalov for program of matrix element calculation. The work is supported in part by the RFBR grants N03-02-16330 (IHEP group) and N03-02-16135 (INR group) and by Russian Science Support Foundation (INR group).

References

  • [1] J. Bijnens, G. Echer and J. Gasser, Nucl.Phys. B396 (1993) 81;
  • [2] A. Pitch, Rep. Prog. Phys. 58 (1995) 563;
  • [3] L.Maiani, G.Pancheri and N.Paver, The Second DAFNE Physics Handbook, (INFN-LNF-Divisione Ricerca, SIS-Ufficio Pubblicazioni, Frascati (Roma) Italy, ISBN 88-86409-02-8).
  • [4] J. Gasser et.al ., arXiv:hep-ph/0412130
  • [5] N. Cabibo Phys.Rev.Lett 10(1963)531
  • [6] M. Kobayashi, T. Maskawa Progr.Theor. Phys. 49 (1973) 652.
  • [7] C. Jarlskog Z.Phys. C29(1985)491.
  • [8] G.F.Farrar and M.E.Shaposhnikov, Phys.Rev.Lett 70(1993)2833 [Erratum ibid 71(1993)210][arXiv:hep-ph/9305274]; P.Het and Sather, Phys.Rev D51(1995)379 [arXiv:hep-ph/9404302]; M.Carena, M.Quiros and C.E.Wagner, Phys.Lett. B380(1996) 81 [arXiv:hep-ph/9303420]
  • [9] J.Gevas, J.Iliopolus, J.Kaplan Phys. Lett. 20(1966)432.
  • [10] V.V.Braguta, A.A.Likhoded, A.E.Chalov, Phys. Rev. D 65(2002) 054038 [arXiv:hep-ph/0106147]
  • [11] Y.Kuzuruki Phys. Lett., B193 (1987) 339.
  • [12] A. Bartl, T.Kernreiter and W. Porod Phys Lett., B538 (2002) 59.
  • [13] N. Oshimo Mod. Phys. Lett. A4 (1989) 145.
  • [14] V.V.Braguta, A.A.Likhoded, A.E.Chalov Phys.Atom.Nucl.67:1003-1009,2004, Yad.Fiz.67:1025-1032,2004 [arXiv:hep-ph/0305067]
  • [15] V.N.Bolotov et.al ., IHEP preprint 8-98, 1998.
  • [16] R.Brun et al ., Preprint CERN-DD/EE/84-1.
  • [17] I.V.Ajinenko et al ., Yad. Fiz 65(2002) 2125; I.V.Ajinenko et al ., Phys. At. Nucl., 66 (2003) 2064 I.V.Ajinenko et al ., Phys Lett., B574 (2003) 14. O.P.Yuschenko et al ., Phys Lett., B589 (2004) 111.
  • [18] I.V.Ajinenko et al ., Yad. Fiz 66(2003) 107; I.V.Ajinenko et al ., Phys. At. Nucl., 66 (2003) 105 O.P.Yuschenko et al ., Phys Lett., B581 (2004) 159.
  • [19] V.V.Barmin et.al ., SJNP 55(1991) 547, 53(1991)976 .
  • [20] V.N.Bolotov et.al ., JETPL 42(1985)481, Yad. Fiz 44(1986)108.
  • [21] F.Romano et.al ., Phys Lett., 36B(1971)525.