Hadron Spectroscopy from BES and CLEOc
Abstract
Recent results from BES and CLEOc experiments on hadron spectroscopy and charmonium decays using , and data samples collected in annihilation are reviewed, including the observation of in , study of the scalar particles in radiative and hadronic decays, as well as in hadronic decays, and the study of the “ puzzle” in , , and decays.
Keywords:
hadron spectroscopy, charmonium, QCD:
14.40.Gx, 14.40.Cs, 12.38.Qk, 13.25.Gv1 Introduction
BESII bes running at BEPC and CLEOc cleo running at CESR are the two detectors operating in the -charm energy region, and have collected large data samples of charmonium decays including 58 M events, 14 M events, and 33 pb-1 data around peak at BESII, and 4 M events, and 281 pb-1 events at CLEOc. To study the continuum background in the charmonium decays, special data samples at center of mass energy lower than the mass were taken both at BESII ( GeV) and at CLEOc ( GeV), the luminosity are 6.4 pb-1 and 21 pb-1 respectively. These data samples are used for the study of the hadron spectroscopy, the decay properties and the CKM matrix, as well as the charmonium decay dynamics.
In this paper, we focus on the search for the new resonances in decays, the properties of the scalars from radiative and hadronic decays, and a new approach of studying the scalars using decays, and the extensive study of the “ puzzle” related physics in , and decays.
It should be noted that the CLEOc detector is much better than the BESII detector, especially in the photon detection, this makes its 4 M events data sample produces results with similar precision as from 14 M events from BESII.
2 Observation of
The decay channel , with , or , is analyzed using a sample of events collected with the BESII detector etap , to search for the other decay modes of the possible existing bound state as observed in process at BESII gpp . Figure 1 shows the invariant mass spectrum for the combined and samples. A clear peak is observed at around 1.835 GeV/c2. The spectrum is fitted with a Breit-Wigner (BW) function convolved with a Gaussian mass resolution function (with MeV/c2) to represent the signal plus a smooth polynomial background function. The signal yield from the fit is events and the statistical significance is 7.7 .

The mass of is measured to be MeV/c2, the width is MeV/c2, and the product branching fraction is = . The mass and width of the are not compatible with any known meson resonance listed by PDG pdg . In Ref. pdg , the candidate closest in mass to the is the (unconfirmed) with MeV/c2. However, the width of MeV/c2, is considerably larger than that of the (see also BESI , where the component in the mode of radiative decay has a mass MeV/c2 and a width MeV/c2). Another candidate with mass close to the in PDG pdg is the observed in the mass threshold in radiative decays gpp , where a mass of MeV/c2, and width smaller than 30 MeV/c2 at 90% C.L. were reported. It has been pointed out that the -wave BW function used for the fit in Ref. gpp should be modified to include the effect of final-state-interactions (FSI) on the shape of the mass spectrum fsi1 ; fsi2 . By redoing the -wave BW fit to the invariant mass spectrum of Ref. gpp including the Isospin zero, -wave FSI factor of Ref. fsi2 , BES gets a mass MeV/c2 (in good agreement with the ) and a width MeV/c2 at the 90 C.L. (not in contradiction with the ). There are also theoretical arguments that the two states, and , are indeed one particle, and is a bound state yan ; zhu , however, other possible interpretations of the that have no relation to the mass threshold enhancement are not excluded. Further information about the and , especially better precisions on the mass and width measurements and the determination of the spin-parity are strongly desired before concluding the nature of the states.
3 Scalar particles in and decays
The study of the scalars are very important in two aspects: in experiment, there are still controversies about the resonance parameters of these states; and in theory, it is still hard to incorporate all the experimental results in a self-consistent picture. The reason for the former is somewhat due to the techniques used in extracting the physics information from the experimental data, namely, the partial wave analysis (PWA) was extensively used in the analyses, but sometimes it is rather arbitrary what resonance need to be included in the complicated fit with a few ten and even more than one hundred free parameters. The reason for the latter, in part is due to the fact that the experimental results may not all be reliable, and the complexity in the low energy QCD domain that the higher order terms neglected may not be small, and the mixing of the states in principle is hard to be considered completely.
3.1 Radiative and hadronic decays
Using the world largest data sample in annihilation experiment, BES studied the scalars decay into pair of pseudoscalars (, , and ) in radiative decays as well as recoiling against a or an wpipi ; wkk ; phipipi ; gkk . The full mass spectra and the scalar part in them are shown in Fig. 2.

From the analyses, BES sees significant contributions of particle in and , and also hint in . Two independent partial wave analyses are performed on data and four different parameterizations of the amplitude are tried, all give consistent results for the pole, which is at MeV/c2. There is also events accumulation in the low mass in mode, most probably due to the contribution of the , however, there is no attempt to analyze the structure at BES, one possible reason is the presentation of the huge background from . Nevertheless, the coupling of the with a photon in decays is an important piece of information for the understanding of the nature of the particle, a better detector with more statistics may want to measure it. A measurement of the resonance parameters of using the BESII data gives similar pole position as measured in zhuys .
Strong is seen in and modes, from which the resonance parameters are measured to be MeV/c2, MeV/c2 and , where is the mass, and and are the couplings to and respectively if the is parameterized using the the Flatté’s formula. The production of is very weak recoiling against an or a photon, which indicates is the dominant component in it.
The data also show a strong scalar contribution at around 1.4 GeV/c2, it is due to the dominant interfering with a smaller component. The mass and width of are determined to be: MeV/c2 and MeV/c2. In , a similar structure is observed in the same mass region, the fit yields a resonance at mass MeV/c2 with width of MeV/c2, possibly the , and the contribution from the can not be excluded. The production of and in is insignificant.
The invariant mass distributions from and , the invariant mass distributions from , and show clear scalar contribution around 1.75 GeV/c2. Two states are resolved from the bump, one is with MeV/c2 and MeV/c2 which decays to mostly, and one possible new state with MeV/c2 and MeV/c2 which couples to stronger than to . However, the existence of the second scalar particle needs confirmation: the signal observed in is rather in the edge of the phase space, and the reconstruction efficiency of the decreases dramatically as the momentum of the decreases thus the momentum of the kaon from decays is very low and can not be detected. Furthermore, there are wide higher mass scalar states above 2 GeV/c2 as observed in (Fig. 2e) and pdg , whose tails may interfere with the and produce structure near the edge of the phase space.
3.2 Pair production of scalars in
Partial wave analysis of is performed ppkk using produced in decays at BESII. In 14 M produced events, 1371 , candidates are selected with around 3% background contamination.
Fig. 3(a) shows the scatter plot of versus invariant mass which provides further information on the intermediate resonant decay modes for decay, while Fig. 3(b) shows the scatter plot of versus invariant masses for the resonances with strange quark.


Besides and modes, mode which leads to a measurement of and decay processes is also included in the fit. The PWA results are summarized in Table 1. From these results, we notice that scalar resonances have larger decay fractions compared to those of tensors, and such decays provide a relatively clean laboratory to study the properties of scalars, such as , , , and so forth. The upper limits of the pair production of the scalar mesons which are less significant are determined at the 90% C.L. to be
| Decay mode | Branching ratio | s.s. | |
|---|---|---|---|
| (X) | |||
| (90% C.L.) |
The above results supply important information on the understanding of the natures of the scalar states zhaoq .
3.3 Comments on the PWA
PWA is extensively used in extracting physics information from the experimental data, all the information listed above in this section is from PWA. While we know the PWA uses the information in the full phase space for physics study so that it is more powerful than working in one dimension (invariant mass, for example) or a bit higher dimension, it suffers from too many free parameters and other technical problems.
First of all, the experimental data are all affected by the finite resolution in momentum, energy, or direction measurement, this was not considered in current analyses; secondly, the parametrization of the resonance, especially the wide resonance, still have room to improve. Finally, the effect of the imperfect simulation of the detectors is hard to be considered in a fit with a few ten or even more free parameters. These effects may not be significant when the statistics is low, however, as the statistics increases, all these effects will possibly produce significant fake signals. How to handle these, if not now, at least in the near future, should be studied since high luminosity experiments will be soon available.
Studying the papers dealing with the PWA, it is found that two important information are missing in most of the analyses, which are the goodness-of-fit and the correlation coefficients between the fit out parameters.
In many of the analyses, the comparison to the alternative fits are given to show the fit is the best among all the fits tested, however this does not guarantee the fit used in the analysis is reliable, just like a fit to a Gaussian using a 2nd order polynomial is better than using a straight line, but does not mean the fit is acceptable. To give the goodness-of-fit is not easy in case of PWA since the fitting function is always very complicated. A possible way is to supply a simple test in one or multi-dimension as has been done in Ref. ppkk , although not perfect, it shows the reader a feeling how the fit describes the data. Another possible way is try to use toy Monte Carlo to get the expected distribution of the or the likelihood after generating many MC samples using the fit out parameters as input, and compare with the one got from the fit to the data — this may be a bit time consuming, however, it is more reliable since the detector effects are considered.
The parameters from the fit are generally correlated, and sometimes, some variables are highly correlated, in this case, only reporting the diagonal error is not enough. This is extremely important when there are two nearby resonances with strong interference, they are anti-correlated and one component will increase (decrease) as the other decrease (increase) to make the total contribution unchanged. Neglecting this in the theoretical analysis will also be dangerous. Another effect of the correlation is the significance of the signal may be affected strongly, that is, a declared significance may not be as high as that determined when there is no correlation, and vice versa.
4 “ puzzle” in vector charmonia decay
From perturbative QCD (pQCD), it is expected that both and decaying into light hadrons are dominated by the annihilation of into three gluons or one virtual photon, with a width proportional to the square of the wave function at the origin appelquist . This yields the pQCD “12% rule”,
| (1) |
A large violation of this rule was first observed in decays to and by Mark II mk2 , known as the puzzle, where only upper limits on the branching fractions were reported in decays. Since then, many two-body decay modes of the have been measured by the BES collaboration and recently by the CLEO collaboration; some decays obey the rule while others violate it besres ; cleocvp .
The extension of the above rule to is straightforward, in the same scheme, one would expect
| (2) |
As the data samples are available both at BESII and CLEOc, the search for the decays of into light hadrons was performed. Since is above the charm threshold, it is expected the dominant decays of it is to charmed meson pairs, however, large fraction of charmless decays of is expected if is a mixture of - and -wave charmonium states and the mixing is responsible for the “12% rule” violation in and decays. The above two rules may be tested by the large data samples of , , and at both BESII and CLEOc.
4.1 : current status
The mode of the vector charmonia decays is essential for this study, since this is the first puzzling channel found in and decays. The new measurements, together with the old information, show us a new picture of the charmonium decay dynamics.
4.1.1
BESII measured the branching fraction using its and data samples bes3pi , and BARBAR measured the same branching fraction using events produced by initial state radiative (ISR) events at GeV babar3pi . Together with the measurement from Mark-II mk2 , we get a weighted average of the .
To extract the branching fraction, PWA is needed to consider the possible contribution from the excited states, the only available information on the fraction of in was got at Mark-III. Using the information given in Ref. bill , we estimate , with the error from an educated guess based on the information in the paper since we have no access to the covariant matrix from the fit showed in the paper. From this number and the got above, we estimate . This is substantially larger than the world average listed by PDG pdg , which is .
4.1.2
was studied both at BESII psprhopi and CLEOc cleocvp . After selecting two charged pions and two photons, clear signals are observed in the two photon invariant mass spectra, the numbers of signals are found to be 229 and 196 from BESII (shown in left plot of Fig. 4 as an example) and CLEOc respectively, and the branching fraction of is measured to be and at BESII and CLEOc respectively. The two experiments give results in good agreement with each other. The Dalitz plot of events (right plot of Fig. 4) shows very different signature from that of decays, there are lots of events in the center part of the Dalitz plot in the former case, while in the latter, almost all the events are in the mass region and there is almost nothing in the center of the Dalitz plot.


To extract the branching fraction of , however, BESII uses a PWA including the high mass states and the interference between them, while CLEOc counts the number of events by applying a mass cut. The branching fraction from BESII is , while that from CLEOc is , the difference is large. Although big difference exist between BESII and CLEOc results exist, these do mean the signal exists, rather than the signal is completely missing as has been guessed before. If we take a weighted average neglecting the difference between the two measurements, we get .
Comparing with , one gets
The suppression compared to the 12% rule is obvious.
4.1.3
It has been pointed out that the continuum amplitude plays an important role in measuring decays into light hadrons wympspp . In fact, there are two issues need to be clarified in decays, that is whether decays into light hadrons really exist, and if it exists, how large is it. By comparing the cross sections of at the resonance peak ( GeV) and at a continuum energy point ( GeV at BESII and GeV at CLEOc) below the peak, both BESII and CLEOc found that at continuum is larger than that at resonance peak. The average of the two experiments psppbes ; psppcleoc are
The difference, after considering the form factor variation between 3.65 and 3.773 GeV, is still significant, and it indicates there is an amplitude from decays which interferes destructively with the continuum amplitude, which makes the cross section at the peak smaller than the pure contribution of continuum process.
For the mode, BESII can only give upper limit of its cross section due to the limited statistics of the data sample, the upper limit at 90% C. L. is found to be 6.0 pb psppbes at the peak, which is in consistent with the measurement from CLEOc using a much larger data sample: psppcleoc ; while the cross section at the continuum is pb measured by CLEOc.
To extract the information on the branching fraction, BESII developed a method based on the measured cross sections at resonance peak and at the continuum psppbes . By neglecting the electromagnetic decay amplitude of , there are two amplitudes contribute to the cross section at the peak, the strong decay amplitude of and the continuum amplitude. Taking the continuum amplitude as a real number, the strong decay amplitude is described as one real number for the magnitude, and one phase between strong and electromagnetic decays to describe the relative phase between the two amplitudes. Since only two measurements are available (at peak and at continuum), one can only extract decay branching fraction as a function of the relative phase. BESII measurement on the upper limit of the cross section at peak, together with the CLEOc measurement of the continuum cross section restrict the physics region of the branching fraction and the relative phase as shown in Fig. 5(left). From the Figure, we see that the branching fraction of is restricted within and , and the phase is between and , at 90% C.L.

The observation of the signal at peak and the measurement of the cross section psppcleoc at CLEOc further make the physical region in the branching ratio and relative phase plane smaller: the CLEOc measurement gives a similar out bound of the physical region as BES gives, while also indicates the central part of the physical region in Fig. 5(left) is not allowed by physics. By using a toy Monte Carlo to simulate the CLEOc selection criteria and the interference between resonance and continuum amplitudes, we found that the branching fraction could be either or from the CLEOc measurements, if the relative phase between strong and electromagnetic decay amplitudes is as observed in and decays wymphase .
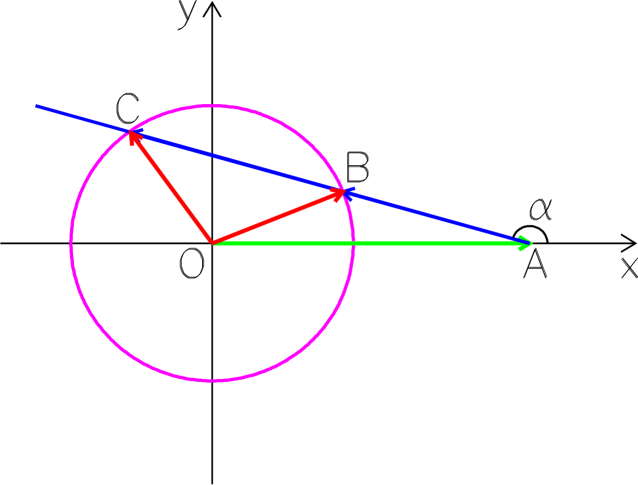
The reason why there are two solutions for decays can be understood as illustrated in Fig. 5b. If we take the continuum amplitude as a real number, it can be shown as a vector along the real axis in the complex plane, the total cross section at peak only gives the magnitude of the total amplitude and it is shown as a circle in the plot, the amplitude of the decays, represented by a vector connecting the end of the continuum amplitude and the end of the total amplitude may have two cross points with the circle, representing the two solutions of the decay amplitudes, and thus the branching fractions. Only in some very special cases, there is only one solution. The angle between the continuum amplitude and the decay amplitudes is shown in the plot as , it is the sum of the relative phase between the strong and electromagnetic decays of , and the phase from Breit-Wigner function for the resonance. It can be seen that, the two solution only happens when the cross section at continuum is larger than or equal to that at peak; otherwise, there is only one solution, as in case. However, as in physics, there is only one decay branching fraction, there must be a way to extract the decay branching fraction experimentally, this could be made possible if one more data sample is taken at a different energy point, for example, in the shoulder of the resonance; furthermore, if one even wants to get the value of the relative phase, one more data point is necessary. In total, to get concrete physics information on the decay branching fraction, at least data samples at four different energy points are needed, better have one point far from the resonance, so that it gives absolute measurement of the continuum amplitude.
Based on current data samples, one gets
to be compared with the pQCD prediction of 0.019% if is pure -wave charmonium.
4.2 Other studies and comments
There are many more new measurements on decays for the extensive study of the “12% rule” besres ; bescleoc ; cleocvp , among which the Vector-Pseudoscalar (VP) modes are measured at first priority. The ratios of the branching fractions are all suppressed for these VP modes compared with the 12% rule. The multi-hadron modes and the Baryon-antibaryon modes are either suppressed, or enhanced, or normal, which are very hard to categorize simply. The various models, developed for interpreting specific mode may hard to find solution for all these newly observed modes.
The decays into light hadrons were searched for in various decay modes, including VP and multi-hadron modes psppcleoc ; psppmulti . However, only the comparison between the cross sections at continuum and those at resonance peak are given, instead of giving the decay branching fractions. In current circumstances, it is still not clear whether the decays into light hadrons with large branching fractions, since, as has been shown in the case, there could be two solutions for the branching fraction, and the two values could be very different.
As the luminosity at the peak is large enough, current study is limited by the low statistics at the continuum: at CLEOc, the luminosity at continuum is more than an order of magnitude smaller than that at peak, this prevents from a high precision comparison between the cross sections at the two energy points. One conclusion we can draw from the existing data is that the measurements do not contradict with the assumption that the relative phase between strong and electromagnetic decay amplitudes is around , and the decays into light hadrons could be large.
The study of the puzzle between and decays and the charmless decays of should not be isolated as they were since , and are all charmonium states with very similar quantum numbers, and it is expected and are the mixtures of and states rosnersd . In developing models to solve one of the problems, the others should also be considered. There have been a few models developed following this line or can be easily extended to all these three states, like the - and -wave charmonia mixing model rosnersd , the re-annihilation in rosnerddb , the four-quark component in voloshin , and survival in survival , and so on. Experimentally testable predictions are welcome for validating the models.
One further observation is that many of the attempts to interpret the puzzle are based on the potential models for the charmonium which were developed more than 20 years ago, as the B-factories discovered many new charmonium states xyz which are hard to be explained in the potential models, it may indicate even the properties of , and are not as expected from the potential models. The further understanding of the other high mass charmonium states may shed light on the understanding of the low lying ones.
5 Summary
There are many new results on hadron spectroscopy from the charmonium decays from BES and CLEOc experiments. While many analyses supply more information on the known states like the light scalar particles to understand the nature of them, there are also new observations which may indicate there are still something unexpected in the low energy regime such as the possible existing baryonium. The decay properties of the vector charmonium states, although have been studied for more than three decades, is still far from being understood, one extreme example is the “ puzzle” in and decays. Further studies of all these are expected from the BESIII at BEPCII which will start its data taking in 2007.
References
- (1) BES Collaboration, J. Z. Bai et al., Nucl. Instr. Meth. A 344, 319 (1994); A 458, 627 (2001).
- (2) CLEO-c Collaboration, CLEO-c and CESR-c: A New Frontier of Weak and Strong Interactions, CLNS 01/1742.
- (3) BES Collaboration, M. Ablikim et al., hep-ex/0508025, accepted by Phys. Rev. Lett.
- (4) BES Collaboration, J.Z. Bai et al., Phys. Rev. Lett. 91, 022001 (2003).
- (5) Particle Data Group, S. Eidelman et al., Phys. Lett. B 592, 1 (2004).
- (6) BES Collaboration, J.Z. Bai et al., Phys. Lett. B446, 356 (1999).
- (7) B.S. Zou and H.C. Chiang, Phys. Rev. D 69, 034004 (2003).
- (8) A. Sibirtsev et al., Phys. Rev. D 71, 054010 (2005).
- (9) G.J. Ding and M.L. Yan, Phys. Rev. C 72, 015208 (2005).
- (10) S.L. Zhu and C.S. Gao, hep-ph/0507050.
- (11) BES Collaboration, M. Ablikim et al., Phys. Lett. B 598, 149 (2004).
- (12) BES Collaboration, M. Ablikim et al., Phys. Lett. B 603, 138 (2004).
- (13) BES Collaboration, M. Ablikim et al., Phys. Lett. B 607, 243 (2004).
- (14) BES Collaboration, J. Z. Bai et al., Phys. Rev. D 68, 052003 (2003).
- (15) Y.S. Zhu (for the BES Collaboration), this conference.
- (16) L. Roca et al., Nucl. Phys. A 744, 127 (2004).
- (17) D. Bugg, this conference.
- (18) F. Close and Q. Zhao, hep-ph/0504043.
- (19) Q. Zhao, B.S. Zou and Z.B. Ma, hep-ph/0508088.
- (20) BES Collaboration, M. Ablikim, et al., hep-ex/0508050.
- (21) Q. Zhao, hep-ph/0508086.
- (22) T. Appelquist and H. D. Politzer, Phys. Rev. Lett. 34, 43 (1975); A. De Rújula and S. L. Glashow, Phys. Rev. Lett. 34, 46 (1975).
- (23) Mark II Collaboration, M. E. B. Franklin et al., Phys. Rev. Lett. 51, 963 (1983).
- (24) Many results may be found in Ref. pdg ; more recent results may be found in BES Collaboration, J. Z. Bai et al., Phys. Rev. D 69, 072001 (2004); Phys. Rev. Lett. 92, 052001 (2004); BES Collaboration, M. Ablikim et al., Phys. Rev. D 70, 112007 (2004); Phys. Rev. D 70, 112003 (2004); and Phys. Lett. B 614, 37 (2005).
- (25) CLEO Collaboration, N. E. Adam et al., Phys. Rev. Lett. 94, 012005 (2005).
- (26) BES Collaboration, J. Z. Bai et al., Phys. Rev. D 70, 012005 (2004).
- (27) BES Collaboration, J. Z. Bai et al., Phys. Rev. D 70, 072004 (2004).
- (28) MARK-III Collaboration, L. Chen and W.M. Dunwoodie, in Proceedings of Hadron 91 Conference, College Park, Maryland, 1991, p. 100, SLAC-PUB-5674 (1991).
- (29) BES Collaboration, M. Ablikim et al., Phys. Lett. B 619, 247 (2005).
- (30) P. Wang, X. H. Mo and C. Z. Yuan, Phys. Lett. B 574, 41 (2003).
- (31) BES Collaboration, M. Ablikim et al., hep-ex/0507092, Phys. Rev. D (in press).
- (32) CLEO Collaboration, G.S. Adams et al., hep-ex/0509011.
- (33) P. Wang, C. Z. Yuan and X. H. Mo, Phys. Rev. D 69, 057502 (2004).
- (34) BES Collaboration, M. Ablikim et al., Phys. Rev. D 71, 072006 (2005); CLEO Collaboration, R. A. Briere et al., Phys. Rev. Lett. 95, 062001 (2005); CLEO Collaboration, T. K. Pedlar et al., Phys. Rev. D 72, 051108(R) (2005). X. H. Mo (for the BES Collaboration), this conference.
- (35) CLEO Collaboration, G. S. Huang et al., hep-ex/0509046.
- (36) J. L. Rosner, Phys. Rev. D 64, 094002 (2001).
- (37) J. L. Rosner, hep-ph/0405196.
- (38) M. Voloshin, Phys. Rev. D 71, 114003 (2005).
- (39) P. Artoisenet, J. M. Gerard and J. Weyers, hep-ph/0506325; J. M. Gérard and J. Weyers, Phys. Lett. B 462, 324 (1999).
- (40) K. K. Seth, this conference.