Measurements of the Dalitz Plot Parameters for K±→π±​π0​π0β†’superscript𝐾plus-or-minussuperscriptπœ‹plus-or-minussuperscriptπœ‹0superscriptπœ‹0K^{\pm}\to\pi^{\pm}\pi^{0}\pi^{0} Decays

G.A.Β Akopdzhanov V.B.Β Anikeev V.A.Β Bezzubov S.P.Β Denisov A.A.Β Durum Yu.V.Β Gilitsky V.M.Β Korablev V.I.Β Koreshev A.V.Β Kozelov E.A.Β Kozlovsky V.I.Β Kurbakov V.V.Β Lipaev A.M.Β Rybin A.A.Β Shchukin M.M.Β Soldatov D.A.Β Stoyanova K.I.Β Trushin I.A.Β Vasilyev State Research Center Institute for High Energy Physics, Protvino, Moscow region, 142281 Russia
Abstract

The g𝑔g, hβ„Žh, and kπ‘˜k Dalitz plot parameters, which are coefficients in a series expansion of the squared module of the matrix element |M​(u,v)|2∝1+g​u+h​u2+k​v2proportional-tosuperscript𝑀𝑒𝑣21π‘”π‘’β„Žsuperscript𝑒2π‘˜superscript𝑣2|M(u,v)|^{2}\propto 1+gu+hu^{2}+kv^{2} (u𝑒u, v𝑣v are invariant variables), have been measured for K±→π±​π0​π0β†’superscript𝐾plus-or-minussuperscriptπœ‹plus-or-minussuperscriptπœ‹0superscriptπœ‹0K^{\pm}\rightarrow\pi^{\pm}\pi^{0}\pi^{0}Β decays using 35​G​e​V/c35𝐺𝑒𝑉𝑐35~{}GeV/c hadron beams at the IHEP (Protvino) accelerator. Dependences of parameters and fit quality on the Ο€0​π0superscriptπœ‹0superscriptπœ‹0\pi^{0}\pi^{0} mass cut were investigated. The results point to the important role of Ο€+β€‹Ο€βˆ’β†’Ο€0​π0β†’superscriptπœ‹superscriptπœ‹superscriptπœ‹0superscriptπœ‹0\pi^{+}\pi^{-}\rightarrow\pi^{0}\pi^{0} charge exchange scattering near the Ο€0​π0superscriptπœ‹0superscriptπœ‹0\pi^{0}\pi^{0} mass threshold. The comparison of our data with previous measurements is presented.

††journal: Eur.Β Phys.Β J.Β C

, , , , , , , , , , , , , , , , ,

††thanks: Corresponding author. E-mail address: Alexander.Kozelov@ihep.ru

1 Introduction

The Dalitz plot parameters for K±→π±​π0​π0β†’superscript𝐾plus-or-minussuperscriptπœ‹plus-or-minussuperscriptπœ‹0superscriptπœ‹0K^{\pm}\rightarrow\pi^{\pm}\pi^{0}\pi^{0}Β decays measured in the three most precise experiments with Kβˆ’superscript𝐾K^{-} [1, 2] and K+superscript𝐾K^{+} [3] beams differ by 2 to 5 standard deviations [4]. For example, the difference of the Dalitz plot slopes g𝑔g obtained in [2] and [3] is equal to 0.109Β±0.021plus-or-minus0.1090.0210.109\pm 0.021. As shown by our data [5] this result cannot be explained by CP violation and is most probably due to underestimation of systematic uncertainties. In this paper we present new results on the Dalitz plot parameters based on the analysis of 493k events of K±→π±​π0​π0β†’superscript𝐾plus-or-minussuperscriptπœ‹plus-or-minussuperscriptπœ‹0superscriptπœ‹0K^{\pm}\rightarrow\pi^{\pm}\pi^{0}\pi^{0}Β decays collected with the TNF-IHEP facility [5, 6].

2 Experimental Setup

Studies of charged kaon decays have been performed using 35​G​e​V/c35𝐺𝑒𝑉𝑐35~{}GeV/c positive and negative hadron beams at the IHEP accelerator. The beam intensity was monitored by four scintillation counters. Its typical value was 4β‹…106β‹…4superscript1064\cdot 10^{6} per 1.71.71.7 second spill. Three threshold and two differential Cherenkov counters were used to select kaons with a background of less than 1%. The products of kaon decays originating in the 58.5 mπ‘šm long vacuum pipe were detected by wide aperture scintillation hodoscopes and the total absorption electromagnetic calorimeter GEPARD consisting of 1968 lead-scintillator cells. The Ο€0superscriptπœ‹0\pi^{0} mass resolution was 12.3​M​e​V/c212.3𝑀𝑒𝑉superscript𝑐212.3~{}MeV/c^{2}. The calorimeter was divided into 16 trigger elements. An anticoincidence beam counter was placed downstream of the vacuum pipe. The first level trigger T1 was formed according to the following logic formula:

T​1=S​1β‹…S​2β‹…S​3β‹…S​4β‹…(D​1+D​2)β‹…C​1Β―β‹…C​2Β―β‹…C​3Β―β‹…A​CΒ―,𝑇1⋅⋅⋅⋅𝑆1𝑆2𝑆3𝑆4𝐷1𝐷2¯𝐢1¯𝐢2¯𝐢3¯𝐴𝐢T1=S1\cdot S2\cdot S3\cdot S4\cdot(D1+D2)\cdot\overline{C1}\cdot\overline{C2}\cdot\overline{C3}\cdot\overline{AC},

where Si𝑖i, D​i𝐷𝑖Di, C​i𝐢𝑖Ci, and A​C𝐴𝐢AC are logical signals from the beam, differential, threshold, and anticoincidence counters respectively. The Level 2 trigger required more than 0.8Β G​e​V𝐺𝑒𝑉GeV energy deposition in at least three trigger elements of the GEPARD. The details of the setup and measurement procedure can be found elsewhere [5].

3 K±→π±​π0​π0β†’superscript𝐾plus-or-minussuperscriptπœ‹plus-or-minussuperscriptπœ‹0superscriptπœ‹0K^{\pm}\rightarrow\pi^{\pm}\pi^{0}\pi^{0}Β event selection

The following criteria were used to select K±→π±​π0​π0β†’superscript𝐾plus-or-minussuperscriptπœ‹plus-or-minussuperscriptπœ‹0superscriptπœ‹0K^{\pm}\rightarrow\pi^{\pm}\pi^{0}\pi^{0}Β events [5]:

  • β€’

    one to three secondary tracks are reconstructed;

  • β€’

    the probability of the decay vertex fit is more than 5%;

  • β€’

    the decay vertex is inside the fiducial length of the decay pipe;

  • β€’

    the number of clusters with energy above 1Β G​e​V𝐺𝑒𝑉GeV in the calorimeter and the number of tracks in the hodoscopes correspond to the K±→π±​π0​π0β†’superscript𝐾plus-or-minussuperscriptπœ‹plus-or-minussuperscriptπœ‹0superscriptπœ‹0K^{\pm}\rightarrow\pi^{\pm}\pi^{0}\pi^{0}Β decay;

  • β€’

    charged pion energy exceeds 8Β G​e​V𝐺𝑒𝑉GeV;

  • β€’

    the Ο‡2superscriptπœ’2\chi^{2} probability P​(Ο‡2)𝑃superscriptπœ’2P(\chi^{2}) of the 6C kinematic fit is more than 0.1 (all possible photon combinations are considered and the best is selected);

  • β€’

    event passes software LevelΒ 2 trigger.

The experimental setup was simulated using the Monte Carlo (MC) method with the GEANTΒ 3.21 code. The setup geometry was described in detail and the data obtained in the experiment were taken into account. Among these data there were calibration coefficients for each channel of the calorimeter, the dependence of the hodoscope efficiency on the particle coordinates and correlations between kaon’s spatial and angular coordinates and its momentum.

The final data sample includes 493K completely reconstructed K±→π±​π0​π0β†’superscript𝐾plus-or-minussuperscriptπœ‹plus-or-minussuperscriptπœ‹0superscriptπœ‹0K^{\pm}\rightarrow\pi^{\pm}\pi^{0}\pi^{0}Β  events. The MC statistics is about four times higher. The background level estimated from the MC simulations is less than 0.25% and is mainly due to K±→π±​π0β†’superscript𝐾plus-or-minussuperscriptπœ‹plus-or-minussuperscriptπœ‹0K^{\pm}\rightarrow\pi^{\pm}\pi^{0} decays. It is shown in our paper [5] that the event distributions in the Dalitz plots for K+superscript𝐾K^{+} and Kβˆ’superscript𝐾K^{-} decays are identical. Taking this into account we used combined statistics for K±→π±​π0​π0β†’superscript𝐾plus-or-minussuperscriptπœ‹plus-or-minussuperscriptπœ‹0superscriptπœ‹0K^{\pm}\rightarrow\pi^{\pm}\pi^{0}\pi^{0}Β decays to estimate the Dalitz plot parameters.

4 Results

Table 1: Fit results with higher-order terms in (1)
g𝑔g 0.6259Β±0.0043plus-or-minus0.62590.00430.6259\pm 0.0043 0.6151Β±0.0051plus-or-minus0.61510.00510.6151\pm 0.0051 0.6284Β±0.0048plus-or-minus0.62840.00480.6284\pm 0.0048 0.6129Β±0.0063plus-or-minus0.61290.00630.6129\pm 0.0063
hβ„Žh 0.0551Β±0.0044plus-or-minus0.05510.00440.0551\pm 0.0044 0.0782Β±0.0073plus-or-minus0.07820.00730.0782\pm 0.0073 0.0556Β±0.0044plus-or-minus0.05560.00440.0556\pm 0.0044 0.0795Β±0.0077plus-or-minus0.07950.00770.0795\pm 0.0077
kπ‘˜k 0.0082Β±0.0011plus-or-minus0.00820.00110.0082\pm 0.0011 0.0080Β±0.0011plus-or-minus0.00800.00110.0080\pm 0.0011 0.0070Β±0.0015plus-or-minus0.00700.00150.0070\pm 0.0015 0.0087Β±0.0016plus-or-minus0.00870.00160.0087\pm 0.0016
l𝑙l β€” 0.0273Β±0.0069plus-or-minus0.02730.00690.0273\pm 0.0069 β€” 0.0292Β±0.0076plus-or-minus0.02920.00760.0292\pm 0.0076
mπ‘šm β€” β€” βˆ’0.0027Β±0.0024plus-or-minus0.00270.0024-0.0027\pm 0.0024 0.0016Β±0.0027plus-or-minus0.00160.00270.0016\pm 0.0027
Ο‡2superscriptπœ’2\chi^{2} 506.1 490.2 504.8 489.8
Ο‡2/n​d​fsuperscriptπœ’2𝑛𝑑𝑓\chi^{2}/ndf 1.18 1.14 1.17 1.14
P​(Ο‡2)𝑃superscriptπœ’2P(\chi^{2}) 6.6β‹…10βˆ’3β‹…6.6superscript1036.6\cdot 10^{-3} 2.4β‹…10βˆ’2β‹…2.4superscript1022.4\cdot 10^{-2} 7.4β‹…10βˆ’3β‹…7.4superscript1037.4\cdot 10^{-3} 2.4β‹…10βˆ’2β‹…2.4superscript1022.4\cdot 10^{-2}

The following parametrization of the squared module of the matrix element for K±→π±​π0​π0β†’superscript𝐾plus-or-minussuperscriptπœ‹plus-or-minussuperscriptπœ‹0superscriptπœ‹0K^{\pm}\rightarrow\pi^{\pm}\pi^{0}\pi^{0}Β decays was used in the data analysis [4]:

|M​(u,v)|2∝1+g​u+h​u2+k​v2proportional-tosuperscript𝑀𝑒𝑣21π‘”π‘’β„Žsuperscript𝑒2π‘˜superscript𝑣2\displaystyle|M(u,v)|^{2}\propto 1+gu+hu^{2}+kv^{2} (1)

Due to the finite setup resolution on the u𝑒u and v𝑣v variables [5] the β€˜measured’ uβ€²superscript𝑒′u^{\prime}, vβ€²superscript𝑣′v^{\prime} values can differ from the true u𝑒u, v𝑣v for both experimental and MC events. To take this into account the Dalitz plot parameters were estimated by minimizing the following functional form:

Ο‡2​(g,h,k)=βˆ‘iN​b​i​n(niβˆ’Cβ‹…mi))2Οƒi2,\chi^{2}(g,h,k)=\sum\limits_{i}^{Nbin}{\frac{{\left({n_{i}-C\cdot m_{i})}\right)^{2}}}{{\sigma_{i}^{2}}}},

where nisubscript𝑛𝑖n_{i} is the number of events in the i𝑖i-th experimental Dalitz plot bin, mi≑mi​(g,h,k)=βˆ‘jwi​jsubscriptπ‘šπ‘–subscriptπ‘šπ‘–π‘”β„Žπ‘˜subscript𝑗subscript𝑀𝑖𝑗m_{i}\equiv m_{i}(g,h,k)=\sum\limits_{j}{w_{ij}} (wi​j=1+gβ‹…uj+hβ‹…uj2+kβ‹…vj2)subscript𝑀𝑖𝑗1⋅𝑔subscriptπ‘’π‘—β‹…β„Žsuperscriptsubscript𝑒𝑗2β‹…π‘˜superscriptsubscript𝑣𝑗2(w_{ij}=1+g\cdot u_{j}+h\cdot u_{j}^{2}+k\cdot v_{j}^{2}) is a sum of the weighted MC events in the i𝑖i-th Dalitz plot bin, C=βˆ‘ni​/β€‹βˆ‘mi𝐢subscript𝑛𝑖/subscriptπ‘šπ‘–C={{\sum{n_{i}}}\mathord{\left/{\vphantom{{\sum{n_{i}}}{\sum{m_{i}}}}}\right.\kern-1.2pt}{\sum{m_{i}}}} is a normalization factor and Οƒi2=ni+C2β‹…βˆ‘jwi​j2superscriptsubscriptπœŽπ‘–2subscript𝑛𝑖⋅superscript𝐢2subscript𝑗superscriptsubscript𝑀𝑖𝑗2\sigma_{i}^{2}=n_{i}+C^{2}\cdot\sum\limits_{j}{w_{ij}^{2}} takes into account limited MC statistics. The following values of the g𝑔g, hβ„Žh, kπ‘˜k parameters and elements of the correlation matrix were obtained:

{g=0.6259Β±0.0043,h=0.0551Β±0.0044,k=0.0082Β±0.0011,(1.000.900.411.000.331.00).cases𝑔plus-or-minus0.62590.0043β„Žplus-or-minus0.05510.0044π‘˜plus-or-minus0.00820.00111.000.900.41missing-subexpression1.000.33missing-subexpressionmissing-subexpression1.00\left\{\begin{array}[]{lll}g&=&0.6259\pm 0.0043,\\ h&=&0.0551\pm 0.0044,\\ k&=&0.0082\pm 0.0011,\end{array}\right.\qquad\left(\begin{array}[]{ccc}1.00&0.90&0.41\\ &1.00&0.33\\ &&1.00\end{array}\right). (2)
Refer to caption
Figure 1: Ratio of experimental to MC events vs Ο€0​π0superscriptπœ‹0superscriptπœ‹0\pi^{0}\pi^{0} invariant mass M0subscript𝑀0M_{0}.

The errors quoted are statistical only, Ο‡2/𝑛𝑑𝑓superscriptπœ’2𝑛𝑑𝑓\chi^{2}/{\it ndf} is 506/430 = 1.18 and P​(Ο‡2)=0.0066𝑃superscriptπœ’20.0066P(\chi^{2})=0.0066. The low significance of the fit is primarily due to a difference between the experimental data and the MC simulations based on equation (1) in the threshold region of the Ο€0​π0superscriptπœ‹0superscriptπœ‹0\pi^{0}\pi^{0} invariant mass M0subscript𝑀0M_{0} (Fig.Β 1). This discrepancy can not be avoided by the addition of higher order terms lβ‹…u3⋅𝑙superscript𝑒3l\cdot u^{3} and/or mβ‹…u​v2β‹…π‘šπ‘’superscript𝑣2m\cdot uv^{2} in the |M​(u,v)|2superscript𝑀𝑒𝑣2|M(u,v)|^{2} expansion (see TableΒ 1) and might be due to nonanalitical terms in the matrix element connected to Ο€+β€‹Ο€βˆ’β†’Ο€0​π0β†’superscriptπœ‹superscriptπœ‹superscriptπœ‹0superscriptπœ‹0\pi^{+}\pi^{-}\rightarrow\pi^{0}\pi^{0} rescattering [7]. This effect was recently considered in detail by Cabibbo [8] and Cabibbo, Isidory [9]. It plays an important role in the region of M0∼2​mΟ€0similar-tosubscript𝑀02subscriptπ‘šsuperscriptπœ‹0M_{0}\sim 2m_{\pi^{0}} and its contribution can be suppressed by introducing a complementary criterion of M0>MTsubscript𝑀0subscript𝑀𝑇M_{0}>M_{T}. It appeared that the fit with MTβ‰₯290subscript𝑀𝑇290M_{T}\geq 290Β M​e​V/c2𝑀𝑒𝑉superscript𝑐2MeV/c^{2} results in stable values of the Dalitz plot parameters independent from the M0subscript𝑀0M_{0} cut and a satisfactory fit significance. Introduction of the higher order terms in Eq.(1) does not change the g𝑔g, hβ„Žh, kπ‘˜k parameters and Ο‡2superscriptπœ’2\chi^{2} value in this case. The fit with MT=290subscript𝑀𝑇290M_{T}=290Β M​e​V/c2𝑀𝑒𝑉superscript𝑐2MeV/c^{2} gave the following results:

{g=0.6339Β±0.0046,h=0.0593Β±0.0088,k=0.0083Β±0.0013,(1.000.520.431.000.161.00),cases𝑔plus-or-minus0.63390.0046β„Žplus-or-minus0.05930.0088π‘˜plus-or-minus0.00830.00131.000.520.43missing-subexpression1.000.16missing-subexpressionmissing-subexpression1.00\left\{\begin{array}[]{lll}g&=&0.6339\pm 0.0046,\\ h&=&0.0593\pm 0.0088,\\ k&=&0.0083\pm 0.0013,\end{array}\right.\qquad\left(\begin{array}[]{ccc}1.00&0.52&0.43\\ &1.00&0.16\\ &&1.00\end{array}\right), (3)

and Ο‡2/n​d​f=1.04superscriptπœ’2𝑛𝑑𝑓1.04\chi^{2}/ndf=1.04, P​(Ο‡2)=0.3𝑃superscriptπœ’20.3P(\chi^{2})=0.3.

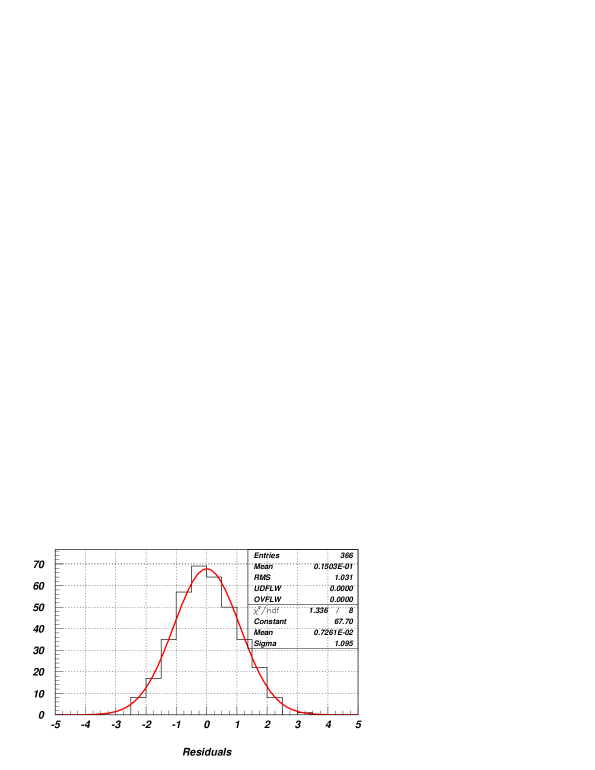
Comparison of the matrices in (2) and (3) shows that the correlations between g𝑔g, hβ„Žh, and hβ„Žh, kπ‘˜k are much weaker (significantly lower) if the MTsubscript𝑀𝑇M_{T} cut is applied. Figs.Β 2-4 confirm the good agreement between experimental and MC data with MT=290subscript𝑀𝑇290M_{T}=290Β M​e​V/c2𝑀𝑒𝑉superscript𝑐2MeV/c^{2}.

Refer to caption
Figure 2: The uβ€²superscript𝑒′u^{\prime} distribution of events in different intervals of |vβ€²|superscript𝑣′|v^{\prime}| (histogram – simulation, circles – experiment).
Refer to caption
Figure 3: Event distributions projected on the uβ€²superscript𝑒′u^{\prime} and |vβ€²|superscript𝑣′|v^{\prime}| axes (histogram - simulation, circles - experiment).
Refer to caption
Figure 4: Normalized residuals of the fit (niβˆ’mi)/Οƒisubscript𝑛𝑖subscriptπ‘šπ‘–subscriptπœŽπ‘–(n_{i}-m_{i})/\sigma_{i}.

To estimate the systematic uncertainties of the Dalitz plot parameters we checked the stability of the results against variation of the cuts in the event selection criteria. The parameters appeared to be most sensitive to the change of the minimum gamma energies from 1 to 2Β G​e​V𝐺𝑒𝑉GeV (Δ​g=βˆ’0.0057Δ𝑔0.0057\Delta g=-0.0057, Δ​h=βˆ’0.0047Ξ”β„Ž0.0047\Delta h=-0.0047, Δ​k=βˆ’0.0006Ξ”π‘˜0.0006\Delta k=-0.0006) and of the minimum charged pion momentum from 1 to 8Β G​e​V/c𝐺𝑒𝑉𝑐GeV/c (Δ​g=0.0048Δ𝑔0.0048\Delta g=0.0048, Δ​h=0.0051Ξ”β„Ž0.0051\Delta h=0.0051 and Δ​k=0.0011Ξ”π‘˜0.0011\Delta k=0.0011). The change in the bin size by factors of 2 and 0.5 and exclusion of the bins at the Dalitz plot boundary from the fit gives Δ​g=0.0012Δ𝑔0.0012\Delta g=0.0012, Δ​h=0.0045Ξ”β„Ž0.0045\Delta h=0.0045, and Δ​k=0.0004Ξ”π‘˜0.0004\Delta k=0.0004. Uncertainties in the kaon momentum, beam profile and angular spread, as well as GEPARD calibration coefficients have no influence on the parameters. The background contribution to systematic errors turned out to be negligible. Finally, our estimations of the systematic uncertainties are the following: δ​g=0.0093𝛿𝑔0.0093\delta g=0.0093, δ​h=0.0086π›Ώβ„Ž0.0086\delta h=0.0086, δ​k=0.0014π›Ώπ‘˜0.0014\delta k=0.0014. They do not include the errors connected with g𝑔g, hβ„Žh, kπ‘˜k variations due to introducing the M0subscript𝑀0M_{0} cut and the higher order terms in the expansion (1).

Fig.Β 5 shows our results (2) together with previous measurements of the Dalitz plot parameters [1, 2, 3, 4, 10, 11, 12, 13, 14]. The error bars include both systematic and statistical uncertainties.

Refer to caption
Figure 5: The Dalitz plot parameters g𝑔g, hβ„Žh and kπ‘˜k for the K+β†’Ο€+​π0​π0β†’superscript𝐾superscriptπœ‹superscriptπœ‹0superscriptπœ‹0K^{+}\rightarrow\pi^{+}\pi^{0}\pi^{0}Β (solid circles), Kβˆ’β†’Ο€βˆ’β€‹Ο€0​π0β†’superscript𝐾superscriptπœ‹superscriptπœ‹0superscriptπœ‹0K^{-}\rightarrow\pi^{-}\pi^{0}\pi^{0}Β (open circles) and K±→π±​π0​π0β†’superscript𝐾plus-or-minussuperscriptπœ‹plus-or-minussuperscriptπœ‹0superscriptπœ‹0K^{\pm}\rightarrow\pi^{\pm}\pi^{0}\pi^{0}Β  (triangles) decays. Vertical solid and dotted lines show the average values and their errors as calculated by the PDG [4].

5 Conclusions

The new data on the Dalitz plot parameters for K±→π±​π0​π0β†’superscript𝐾plus-or-minussuperscriptπœ‹plus-or-minussuperscriptπœ‹0superscriptπœ‹0K^{\pm}\rightarrow\pi^{\pm}\pi^{0}\pi^{0}Β decays based on the analysis of ∼0.5​Msimilar-toabsent0.5𝑀\sim 0.5M events collected with the TNF-IHEP facility are presented. The following results were obtained without a cut on the Ο€0​π0superscriptπœ‹0superscriptπœ‹0\pi^{0}\pi^{0} invariant mass: g=0.6259Β±0.0043​(s​t​a​t)Β±0.0093​(s​y​s​t)𝑔plus-or-minus0.62590.0043π‘ π‘‘π‘Žπ‘‘0.0093𝑠𝑦𝑠𝑑g=0.6259\pm 0.0043\,(stat)\pm 0.0093\,(syst), h=0.0551Β±0.0044​(s​t​a​t)Β±0.0086​(s​y​s​t)β„Žplus-or-minus0.05510.0044π‘ π‘‘π‘Žπ‘‘0.0086𝑠𝑦𝑠𝑑h=0.0551\pm 0.0044\,(stat)\pm 0.0086\,(syst), k=0.0082Β±0.0011​(s​t​a​t)Β±0.0014​(s​y​s​t)π‘˜plus-or-minus0.00820.0011π‘ π‘‘π‘Žπ‘‘0.0014𝑠𝑦𝑠𝑑k=0.0082\pm 0.0011\,(stat)\pm 0.0014\,(syst). The g𝑔g and hβ„Žh values are in good agreement with those of Ajinenko et al [2]. We observe a deviation of the kπ‘˜k value from zero ∼4.5similar-toabsent4.5\sim 4.5 standard deviations while Ajinenko et al reported k=0.001Β±0.002π‘˜plus-or-minus0.0010.002k=0.001\pm 0.002. We investigated the dependence of the Dalitz plot parameters and the fit quality on the Ο€0​π0superscriptπœ‹0superscriptπœ‹0\pi^{0}\pi^{0} invariant mass cut MTsubscript𝑀𝑇M_{T}. It turned out that the fit significance becomes rather high if a cut of MTβ‰₯290subscript𝑀𝑇290M_{T}\geq 290Β M​e​V/c2𝑀𝑒𝑉superscript𝑐2MeV/c^{2} is applied. With this cut the addition of higher order terms in expansion (1) does not influence the g𝑔g, hβ„Žh, and kπ‘˜k parameters and the value of Ο‡2/n​d​fsuperscriptπœ’2𝑛𝑑𝑓\chi^{2}/ndf. These results may be considered as evidence of the important contribution of Ο€+β€‹Ο€βˆ’β†’Ο€0​π0β†’superscriptπœ‹superscriptπœ‹superscriptπœ‹0superscriptπœ‹0\pi^{+}\pi^{-}\rightarrow\pi^{0}\pi^{0} rescattering [8, 9] to the matrix element of the K±→π±​π0​π0β†’superscript𝐾plus-or-minussuperscriptπœ‹plus-or-minussuperscriptπœ‹0superscriptπœ‹0K^{\pm}\rightarrow\pi^{\pm}\pi^{0}\pi^{0}Β decay in the threshold region of the Ο€0​π0superscriptπœ‹0superscriptπœ‹0\pi^{0}\pi^{0} invariant mass.

Acknowledgments

We appreciate the support of the experiment from A.A.Logunov, N.E.Tyurin, and A.M.Zaitsev and valuable contributions from V.N.Mikhailin, Yu.V.Mikhailov, V.A.Sen’ko, and A.N.Sytin. These studies were supported in part by the President grant 1305.2003.2 and by the Russian Fund for Basic Research (grants 05-02-16557 and 05-02-17614).

References

  • [1] V.N.Β Bolotov et al., Sov. J. Nucl. Phys., 44, 73 (1986).
  • [2] I.V.Β Ajinenko et al., Phys.Lett. B567, 159 (2003).
  • [3] V.Y.Batusov et al., Nucl. Phys. B516, 3 (1998).
  • [4] S.Β Eidelman et al., Phys. Lett. B592, 1 (2004).
  • [5] G.A.Β Akopdzhanov et al., Eur. Phys. J. C 40, 343 (2005).
  • [6] V.V.Β Ammosov et al., Preprint IHEP 98-2, Protvino, 1998
  • [7] V.V.Β Anisovich, L.G.Β Dakhno, A.K.Β Likhoded, Sov. J. Nucl. Phys., 8, 91 (1968).
  • [8] N.Β Cabibbo, Phys. Rev. Lett. 93, 121801 (2004).
  • [9] N.Β Cabibbo, G.Β Isidori, JHEP 503, 21 (2005).
  • [10] D.Β Davison et al., Phys. Rev., 180, 1333 (1969).
  • [11] B.Β Aubert et al., Nuovo Cim., 12A, 509 (1972).
  • [12] K.M.Β Smith et al., Nucl. Phys., B91, 45 (1975).
  • [13] M.Β Sheaff, Phys. Rev., D12, 2570 (1975).
  • [14] H.Β Braun et al., Lett. Nuovo Cim., 17, 521 (1976).