Uncertainties on and production at the LHC
HERA - LHC Workshop Proceedings
Abstract
Uncertainties on low- PDFs are crucial for the standard model benchmark processes of and production at the LHC. The current level of PDF uncertainty is critically reviewed and the possibility of reducing this uncertainty using early LHC data is investigated taking into account realistic expectations for measurement accuracy, kinematic cuts and backgrounds.
1 Introduction
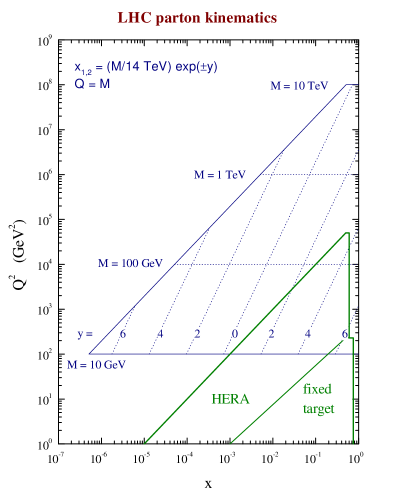
At leading order (LO), and production occur by the process, , and the momentum fractions of the partons participating in this subprocess are given by, , where is the centre of mass energy of the subprocess, or , is the centre of mass energy of the reaction ( TeV at the LHC) and gives the parton rapidity. The kinematic plane for LHC parton kinematics is shown in Fig. 1. Thus, at central rapidity, the participating partons have small momentum fractions, . Moving away from central rapidity sends one parton to lower and one to higher , but over the measurable rapidity range, , values remain in the range, . Thus, in contrast to the situation at the Tevatron, valence quarks are not involved, the scattering is happening between sea quarks. Furthermore, the high scale of the process GeV2 ensures that the gluon is the dominant parton, see Fig. 1, so that these sea quarks have mostly been generated by the flavour blind splitting process. Thus the precision of our knowledge of and cross-sections at the LHC is crucially dependent on the uncertainty on the momentum distribution of the gluon.
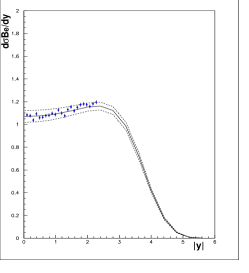
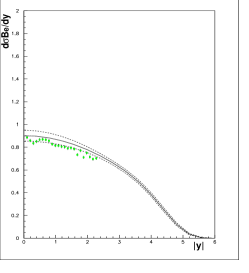
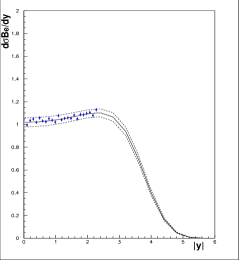
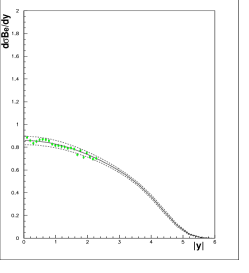
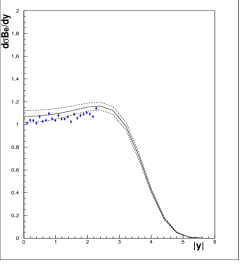
HERA data have dramatically improved our knowledge of the gluon, as illustrated in Fig. 2, which shows and rapidity spectra predicted from a global PDF fit which does not include the HERA data, compared to a fit including HERA data. The latter fit is the ZEUS-S global fit [1], whereas the former is a fit using the same fitting analysis but leaving out the ZEUS data. The full PDF uncertainties for both fits are calculated from the error PDF sets of the ZEUS-S analysis using LHAPDF [2] (see the contribution of M.Whalley to these proceedings). The predictions for the cross-sections, decaying to the lepton decay mode, are summarised in Table 1.
PDF Set ZEUS-S no HERA nb nb nb ZEUS-S nb nb nb CTEQ6.1 nb nb nb MRST01 nb nb nb
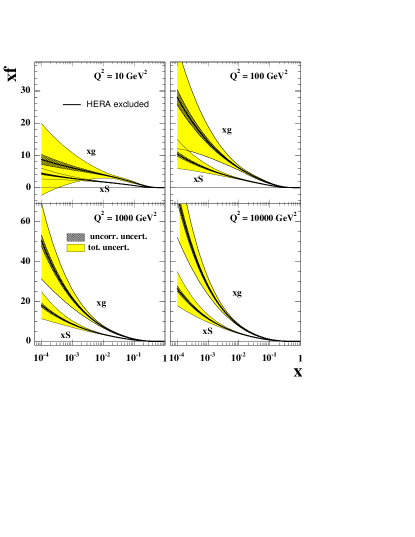
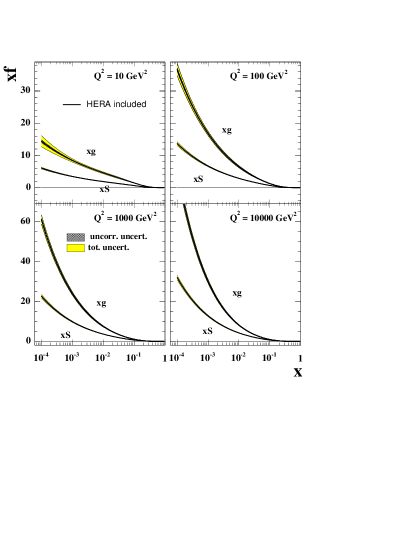
The uncertainties in the predictions for these cross-sections have decreased from pre-HERA to post-HERA. The reason for this can be seen clearly in Fig. 3, where the sea and gluon distributions for the pre- and post-HERA fits are shown for several different bins, together with their uncertainty bands. It is the dramatically increased precision in the low- gluon PDF, feeding into increased precision in the low- sea quarks, which has led to the increased precision on the predictions for production at the LHC.


Further evidence for the conclusion that the uncertainties on the gluon PDF at the input scale ( GeV2, for ZEUS-S) are the major contributors to the uncertainty on the cross-sections at , comes from decomposing the predictions down into their contributing eigenvectors. Fig 4 shows the dominant contributions to the total uncertainty from eigenvectors 3, 7, and 11 which are eigenvectors which are dominated by the parameters which control the low-, mid- and high-, gluon respectively.


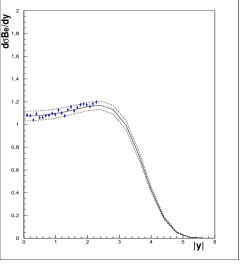
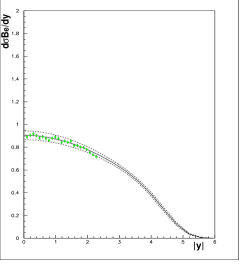
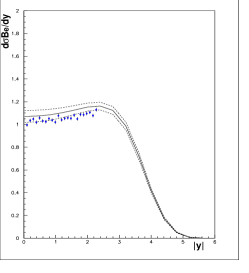
The post-HERA level of precision illustrated in Fig. 2 is taken for granted in modern analyses, such that production have been suggested as ‘standard-candle’ processes for luminosity measurement. However, when considering the PDF uncertainties on the Standard Model (SM) predictions it is necessary not only to consider the uncertainties of a particular PDF analysis, but also to compare PDF analyses. Fig. 5 compares the predictions for production for the ZEUS-S PDFs with those of the CTEQ6.1[3] PDFs and the MRST01[4] PDFs111MRST01 PDFs are used because the full error analysis is available only for this PDF set.. The corresponding cross-sections, for decay to leptonic mode are given in Table 1. Comparing the uncertainty at central rapidity, rather than the total cross-section, we see that the uncertainty estimates are rather larger: for ZEUS-S; for CTEQ6.1M and about for MRST01. The difference in the central value between ZEUS-S and CTEQ6.1 is . Thus the spread in the predictions of the different PDF sets is comparable to the uncertainty estimated by the individual analyses. Taking all of these analyses together the uncertainty at central rapidity is about .


Since the PDF uncertainty feeding into the and production is mostly coming from the gluon PDF, for all three processes, there is a strong correlation in their uncertainties, which can be removed by taking ratios. Fig. 6 shows the asymmetry
for CTEQ6.1 PDFs, which have the largest uncertainties of published PDF sets. The PDF uncertainties on the asymmetry are very small in the measurable rapidity range. An eigenvector decomposition indicates that sensitivity to high- and quark flavour distributions is now evident at large . Even this residual flavour sensitivity can be removed by taking the ratio
as also shown in Fig. 6. This quantity is almost independent of PDF uncertainties. These quantities have been suggested as benchmarks for our understanding of Standard Model Physics at the LHC. However, whereas the rapidity distribution can be fully reconstructed from its decay leptons, this is not possible for the rapidity distribution, because the leptonic decay channels which we use to identify the ’s have missing neutrinos. Thus we actually measure the ’s decay lepton rapidity spectra rather than the rapidity spectra. The lower half of Fig. 6 shows the rapidity spectra for positive and negative leptons from and decay and the lepton asymmetry,
A cut of, GeV, has been applied on the decay lepton, since it will not be possible to trigger on leptons with small . A particular lepton rapidity can be fed from a range of rapidities so that the contributions of partons at different values is smeared out in the lepton spectra, but the broad features of the spectra and the sensitivity to the gluon parameters remain. The lepton asymmetry shows the change of sign at large which is characteristic of the structure of the lepton decay. The cancellation of the uncertainties due to the gluon PDF is not so perfect in the lepton asymmetry as in the asymmetry. Nevertheless in the measurable rapidity range sensitivity to PDF parameters is small. Correspondingly, the PDF uncertainties are also small () and this quantity provides a suitable Standard Model benchmark.


In summary, these preliminary investigations indicate that PDF uncertainties on predictions for the rapidity spectra, using standard PDF sets which describe all modern data, have reached a precision of . This may be good enough to consider using these processes as luminosity monitors. The predicted precision on ratios such as the lepton ratio, , is better () and this measurement may be used as a SM benchmark. It is likely that this current level of uncertainty will have improved before the LHC turns on- see the contribution of C. Gwenlan to these proceedings. The remainder of this contribution will be concerned with the question: how accurately can we measure these quantities and can we use the early LHC data to improve on the current level of uncertainty.
2 k-factor and PDF re-weighting
To investigate how well we can really measure production we need to generate samples of Monte-Carlo (MC) data and pass them through a simulation of a detector. Various technical problems arise. Firstly, many physics studies are done with the HERWIG (6.505)[5], which generates events at LO with parton showers to account for higher order effects. Distributions can be corrected from LO to NLO by k-factors which are applied as a function of the variable of interest. The use of HERWIG is gradually being superceded by MC@NLO (2.3)[6] but this is not yet implemented for all physics processes. Thus it is necessary to investigate how much bias is introduced by using HERWIG with k-factors. Secondly, to simulate the spread of current PDF uncertainties, it is necessary to run the MC with all of the eigenvector error sets of the PDF of interest. This would be unreasonably time-consuming. Thus the technique of PDF reweighting has been investigated.
One million events were generated using HERWIG (6.505). This corresponds to 43 hours of LHC running at low luminosity, . These events are split into and events according to their Standard Model cross-section rates, : (the exact split depends on the input PDFs). These events are then weighted with k-factors, which are analytically calculated as the ratio of the NLO to LO cross-section as a function of rapidity for the same input PDF [7]. The resultant rapidity spectra for are compared to rapidity spectra for events generated using MC@NLO(2.3) in Fig 7222In MC@NLO the hard emissions are treated by NLO computations, whereas soft/collinear emissions are handled by the MC simulation. In the matching procedure a fraction of events with negative weights is generated to avoid double counting. The event weights must be applied to the generated number of events before the effective number of events can be converted to an equivalent luminosity. The figure given is the effective number of events.. The MRST02 PDFs were used for this investigation. The accuracy of this study is limited by the statistics of the MC@NLO generation. Nevertheless it is clear that HERWIG with k-factors does a good job of mimicking the NLO rapidity spectra. However, the normalisation is too high by . This is not suprising since, unlike the analytic code, HERWIG is not a purely LO calculation, parton showering is also included. This normalisation difference is not too crucial since in an analysis on real data the MC will only be used to correct data from the detector level to the generator level. For this purpose, it is essential to model the shape of spectra to understand the effect of experimental cuts and smearing but not essential to model the overall normalisation perfectly. However, one should note that HERWIG with k-factors is not so successful in modelling the shape of the spectra, as shown in the right hand plot of Fig. 7. This is hardly surprising, since at LO the have no and non-zero for HERWIG is generated by parton showering, whereas for MC@NLO non-zero originates from additional higher order processes which cannot be scaled from LO, where they are not present.


Suppose we generate events with a particular PDF set: PDF set 1. Any one event has the hard scale, , and two primary partons of flavours and , with momentum fractions according to the distributions of PDF set 1. These momentum fractions are applicable to the hard process before the parton showers are implemented in backward evolution in the MC. One can then evaluate the probability of picking up the same flavoured partons with the same momentum fractions from an alternative PDF set, PDF set 2, at the same hard scale. Then the event weight is given by
| (1) |
where is the parton momentum distribution for flavour, , at scale, , and momentum fraction, . Fig. 8 compares the and spectra for a million events generated using MRST02 as PDF set 1 and re-weighting to CTEQ6.1 as PDF set 2, with a million events which are directly generated with CTEQ6.1. Beneath the spectra the fractional difference between these distributions is shown. These difference spectra show that the reweighting is good to better than , and there is no evidence of a dependent bias. This has been checked for reweighting between MRST02, CTEQ6.1 and ZEUS-S PDFs. Since the uncertainties of any one analysis are similar in size to the differences between the analyses it is clear that the technique can be used to produce spectra for the eigenvector error PDF sets of each analysis and thus to simulate the full PDF uncertainties from a single set of MC generated events. Fig. 8 also shows a similar comparison for spectra.


3 Background Studies
To investigate the accuracy with which events can be measured at the LHC it is necessary to make an estimate of the importance of background processes. We focus on events which are identified through their decay to the channel. There are several processes which can be misidentified as . These are: , with decaying to the electron channel; with at least one decaying to the electron channel (including the case when both ’s decay to the electron channel, but one electron is not identified); with one electron not identified. We have generated one million events for each of these background processes, using HERWIG and CTEQ5L, and compared them to one million signal events generated with CTEQ6.1. We apply event selection criteria designed to eliminate the background preferentially. These criteria are:
-
•
ATLFAST cuts (see Sec. 5)
-
•
pseudorapidity, , to avoid bias at the edge of the measurable rapidity range
-
•
GeV, high is necessary for electron triggering
-
•
missing GeV, the in a signal event will have a correspondingly large missing
-
•
no reconstructed jets in the event with GeV, to discriminate against QCD background
-
•
recoil on the transverse plane GeV, to discriminate against QCD background
Table 2 gives the percentage of background with respect to signal, calculated using the known relative cross-sections of these processes, as each of these cuts is applied. After, the cuts have been applied the background from these processes is negligible. However, there are limitations on this study from the fact that in real data there will be further QCD backgrounds from processes involving in which a final state decay mimics a single electron. A preliminary study applying the selection criteria to MC generated QCD events suggests that this background is negligible, but the exact level of QCD background cannot be accurately estimated without passing a very large number of events though a full detector simulation, which is beyond the scope of the current contribution.
Cut ATLFAST cuts 382,902 264,415 367,815 255,514 GeV 252,410 194,562 GeV 212,967 166,793 No jets with GeV 187,634 147,415 GeV 159,873 125,003
4 Charge misidentification
Clearly charge misidentification could distort the lepton rapidity spectra and dilute the asymmetry .
where is the measured asymmetry, is the true asymmetry, is the rate of true misidentified as and is the rate of true misidentified as . To make an estimate of the importance of charge misidentification we use a sample of events generated by HERWIG with CTEQ5L and passed through a full simulation of the ATLAS detector. Events with two or more charged electromagnetic objects in the EM calorimeter are then selected and subject to the cuts; , GeV, as usual and, , for bremsstrahlung rejection. We then look for the charged electromagnetic pair with invariant mass closest to and impose the cut, GeV. Then we tag the charge of the better reconstructed lepton of the pair and check to see if the charge of the second lepton is the same as the first. Assuming that the pair really came from the decay of the this gives us a measure of charge misidentification. Fig 9 show the misidentification rates , as functions of pseudorapidity333These have been corrected for the small possibility that the better reconstructed lepton has had its charge misidentified as follows. In the central region, , assume the same probability of misidentification of the first and second leptons, in the more forward regions assume the same rate of first lepton misidentification as in the central region.. These rates are very small. The quantity , can be corrected for charge misidentification applying Barlow’s method for combining asymmetric errors [8]. The level of correction is in the central region and in the more forward regions.
5 Compare events at the generator level to events at the detector level
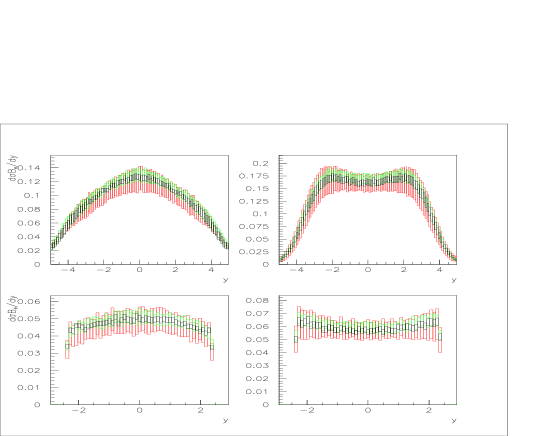
We have simulated one million signal, , events for each of the PDF sets CTEQ6.1, MRST2001 and ZEUS-S using HERWIG (6.505). For each of these PDF sets the eigenvector error PDF sets have been simulated by PDF reweighting and k-factors have been applied to approximate an NLO generation. The top part of Fig. 10, shows the and spectra at this generator level, for all of the PDF sets superimposed. The events are then passed through the ATLFAST fast simulation of the ATLAS detector. This applies loose kinematic cuts: , GeV, and electron isolation criteria. It also smears the 4-momenta of the leptons to mimic momentum dependent detector resolution. We then apply the selection cuts described in Sec. 3. The lower half of Fig. 10, shows the and spectra at the detector level after application of these cuts, for all of the PDF sets superimposed. The level of precision of each PDF set, seen in the analytic calculations of Fig. 5, is only slightly degraded at detector level, so that a net level of PDF uncertainty at central rapidity of is maintained. The anticipated cancellation of PDF uncertainties in the asymmetry spectrum is also observed, within each PDF set, and the spread between PDF sets suggests that measurements which are accurate to better than could discriminate between PDF sets.
6 Using LHC data to improve precision on PDFs
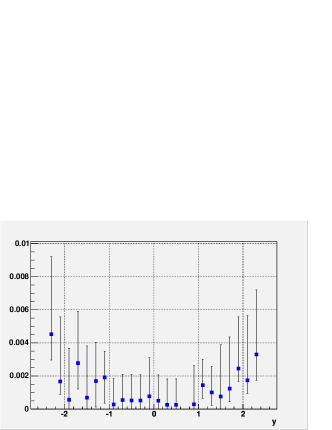
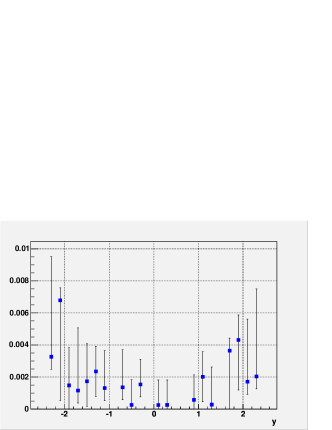
The high cross-sections for production at the LHC ensure that it will be the experimental systematic errors, rather than the statistical errors, which are determining. We have imposed a random scatter on our samples of one million events, generated using different PDFs, in order to investigate if measurements at this level of precision will improve PDF uncertainties at central rapidity significantly if they are input to a global PDF fit. Fig. 11 shows the and rapidity spectra for events generated from the ZEUS-S PDFs () compared to the analytic predictions for these same ZEUS-S PDFs. The lower half of this figure illustrates the result if these events are then included in the ZEUS-S PDF fit. The size of the PDF uncertainties, at , decreases from to . The largest improvement is in the PDF parameter controlling the low- gluon at the input scale, : at low-, , before the input of the LHC pseudo-data, compared to, , after input. Note that whereas the relative normalisations of the and spectra are set by the PDFs, the absolute normalisation of the data is free in the fit so that no assumptions are made on our ability to measure luminosity. Secondly, we repeat this procedure for events generated using the CTEQ6.1 PDFs. As shown in Fig. 12, the cross-section for these events is on the lower edge of the uncertainty band of the ZEUS-S predictions. If these events are input to the fit the central value shifts and the uncertainty decreases. The value of the parameter becomes, , after input of these pseudo-data. Finally to simulate the situation which really faces experimentalists we generate events with CTEQ6.1, and pass them through the ATLFAST detector simulation and cuts. We then correct back from detector level to generator level using a different PDF set- in this cases the ZEUS-S PDFs- since in practice we will not know the true PDFs. Fig. 13 shows that the resulting corrected data look pleasingly like CTEQ6.1, but they are more smeared. When these data are input to the PDF fit the central values shift and errors decrease just as for the perfect CTEQ6.1 pseudo-data. The value of becomes, , after input of these pseudo-data. Thus we see that the bias introduced by the correction procedure from detector to generator level is small compared to the PDF uncertainty.


7 Conclusions and a warning: problems with the theoretical predictions at small-?
We have investigated the PDF uncertainty on the predictions for and production at the LHC, taking into account realistic expectations for measurement accuracy and the cuts on data which will be needed to identify signal events from background processes. We conclude that at the present level of PDF uncertainty the decay lepton asymmetry, , will be a useful standard model benchmark measurement, and that the decay lepton spectra can be used as a luminosity monitor which will be good to . However, we have also investigated the measurement accuracy necessary for early measurements of these decay lepton spectra to be useful in further constraining the PDFs. A systematic measurement error of less than would provide useful extra constraints.
However, a caveat is that the current study has been performed using standard PDF sets which are extracted using NLO QCD in the DGLAP [9] formalism. The extension to NNLO is straightforward, giving small corrections . PDF analyses at NNLO including full accounting of the PDF uncertainties are not extensively available yet, so this small correction is not pursued here. However, there may be much larger uncertainties in the theoretical calculations because the kinematic region involves low-. There may be a need to account for resummation (first considered in the BFKL [13] formalism) or high gluon density effects. See reference [17] for a review.
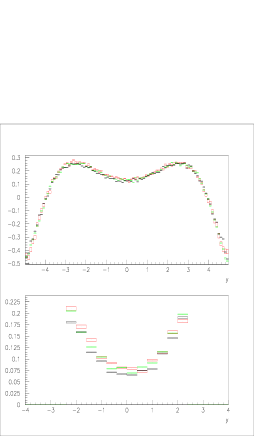
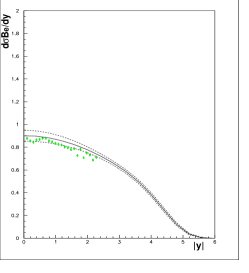
The MRST group recently produced a PDF set, MRST03, which does not include any data for . The motivation behind this was as follows. In a global DGLAP fit to many data sets there is always a certain amount of tension between data sets. This may derive from the use of an inappropriate theoretical formalism for the kinematic range of some of the data. Investigating the effect of kinematic cuts on the data, MRST found that a cut, , considerably reduced tension between the remaining data sets. An explanation may be the inappropriate use of the DGLAP formalism at small-. The MRST03 PDF set is thus free of this bias BUT it is also only valid to use it for . What is needed is an alternative theoretical formalism for smaller . However, the MRST03 PDF set may be used as a toy PDF set, to illustrate the effect of using very different PDF sets on our predictions. A comparison of Fig. 14 with Fig. 2 or Fig. 5 shows how different the analytic predictions are from the conventional ones, and thus illustrates where we might expect to see differences due to the need for an alternative formalism at small-.


References
- [1] ZEUS Coll., S. Chekanov et al., Phys. Rev D 67, 012007 (2003)
- [2] M.R. Whalley, D. Bourikov, R.C. Group, Les houches accord parton density function interface. Preprint hep-ph/0508110 (http://durpdg.dur.ac.uk/lhapdf, http://hepforge.cedar.ac.uk/lhapdf/), 2005
- [3] J. Pumplin et al., JHEP 0207, 012 (2002)
- [4] A.D. Martin et al., Eur. Phys.J C23, 73 (2002)
- [5] G. Corcella et al., JHEP 0101, 010 (2001)
- [6] S. Frixione, B.R. Webber, Mc@nlo. Preprint hep-ph/0402116 (hep-ph/0402116), 2004
- [7] J. Stirling, private communication, 2004
- [8] R. Barlow, Method for combining asymmetric statistical errors. Preprint MAN/HEP/04/02 (PHYSSTAT2003), 2003
- [9] G. Altarelli, G. Parisi, Nucl.Phys. B126, 298 (1977)
- [10] V.N. Gribov, L.N. Lipatov, Sov.J.Nucl.Phys 15, 438 (1972)
- [11] L.N. Lipatov, Sov.J.Nucl.Phys 20, 94 (1975)
- [12] Yu.L. Dokshitzer, JETP 46, 641 (1977)
- [13] L.N. Lipatov, Sov.J.Nucl.Phys 23, 338 (1976)
- [14] E.A. Kuraev, L.N. Lipatov, V.A. Fadin, JETP 45, 199 (1977)
- [15] Ya.Ya. Balitski, L.N. Lipatov, Sov.J.Nucl.Phys 28, 822 (1978)
- [16] L.N. Lipatov, Sov.J.Nucl.Phys 63, 904 (1980)
- [17] R C E Devenish and A M Cooper-Sarkar, Deep Inelastic Scattering. Oxford University Press, Oxford, 2004.