First Evidence and Measurement
of
Production at the (5S)
M. Artuso
C. Boulahouache
S. Blusk
J. Butt
O. Dorjkhaidav
J. Li
N. Menaa
R. Mountain
R. Nandakumar
K. Randrianarivony
R. Redjimi
R. Sia
T. Skwarnicki
S. Stone
J. C. Wang
K. Zhang
Syracuse University, Syracuse, New York 13244
S. E. Csorna
Vanderbilt University, Nashville, Tennessee 37235
G. Bonvicini
D. Cinabro
M. Dubrovin
Wayne State University, Detroit, Michigan 48202
A. Bornheim
S. P. Pappas
A. J. Weinstein
California Institute of Technology, Pasadena,
California 91125
R. A. Briere
G. P. Chen
J. Chen
T. Ferguson
G. Tatishvili
H. Vogel
M. E. Watkins
Carnegie Mellon University, Pittsburgh, Pennsylvania
15213
J. L. Rosner
Enrico Fermi Institute, University of Chicago, Chicago,
Illinois 60637
N. E. Adam
J. P. Alexander
K. Berkelman
D. G. Cassel
V. Crede
J. E. Duboscq
K. M. Ecklund
R. Ehrlich
L. Fields
R. S. Galik
L. Gibbons
B. Gittelman
R. Gray
S. W. Gray
D. L. Hartill
B. K. Heltsley
D. Hertz
C. D. Jones
J. Kandaswamy
D. L. Kreinick
V. E. Kuznetsov
H. Mahlke-Krüger
T. O. Meyer
P. U. E. Onyisi
J. R. Patterson
D. Peterson
E. A. Phillips
J. Pivarski
D. Riley
A. Ryd
A. J. Sadoff
H. Schwarthoff
X. Shi
M. R. Shepherd
S. Stroiney
W. M. Sun
D. Urner
T. Wilksen
K. M. Weaver
M. Weinberger
Cornell University, Ithaca, New York 14853
S. B. Athar
P. Avery
L. Breva-Newell
R. Patel
V. Potlia
H. Stoeck
J. Yelton
University of Florida, Gainesville, Florida 32611
P. Rubin
George Mason University, Fairfax, Virginia 22030
C. Cawlfield
B. I. Eisenstein
G. D. Gollin
I. Karliner
D. Kim
N. Lowrey
P. Naik
C. Sedlack
M. Selen
E. J. White
J. Williams
J. Wiss
University of Illinois, Urbana-Champaign, Illinois
61801
D. M. Asner
K. W. Edwards
Carleton University, Ottawa, Ontario, Canada K1S 5B6
and the Institute of Particle Physics, Canada
D. Besson
University of Kansas, Lawrence, Kansas 66045
T. K. Pedlar
Luther College, Decorah, Iowa 52101
D. Cronin-Hennessy
K. Y. Gao
D. T. Gong
J. Hietala
Y. Kubota
T. Klein
B. W. Lang
S. Z. Li
R. Poling
A. W. Scott
A. Smith
University of Minnesota, Minneapolis, Minnesota 55455
S. Dobbs
Z. Metreveli
K. K. Seth
A. Tomaradze
P. Zweber
Northwestern University, Evanston, Illinois 60208
J. Ernst
State University of New York at Albany, Albany, New
York 12222
K. Arms
Ohio State University, Columbus, Ohio 43210
H. Severini
University of Oklahoma, Norman, Oklahoma 73019
S. A. Dytman
W. Love
S. Mehrabyan
J. A. Mueller
V. Savinov
University of Pittsburgh, Pittsburgh, Pennsylvania
15260
Z. Li
A. Lopez
H. Mendez
J. Ramirez
University of Puerto Rico, Mayaguez, Puerto Rico 00681
G. S. Huang
D. H. Miller
V. Pavlunin
B. Sanghi
I. P. J. Shipsey
Purdue University, West Lafayette, Indiana 47907
G. S. Adams
M. Cravey
J. P. Cummings
I. Danko
J. Napolitano
Rensselaer Polytechnic Institute, Troy, New York 12180
Q. He
H. Muramatsu
C. S. Park
E. H. Thorndike
University of Rochester, Rochester, New York 14627
T. E. Coan
Y. S. Gao
F. Liu
R. Stroynowski
Southern Methodist University, Dallas, Texas 75275
(August 22, 2005)
Abstract
We use data collected by the CLEO III detector at CESR to measure
the inclusive yields of mesons as and . From these measurements we make a
model dependent estimate of the ratio of
to the total quark
pair production of % at the (5S)
energy.
pacs:
13.25.Hw, 13.66.Bc
An enhancement in the total annihilation cross-section
into hadrons was discovered at CESR long ago
CLEOIImeasurement ; CUSBmasses and its mass measured as
10.8650.008 GeV. This effect was named the (5S)
resonance. Theoretical models UQM ; NQM ; CC predict the
different relative decay rates of the (5S) into
combinations of and where indicates the possible presence
of a meson. This original 116 pb-1 of data failed
to reveal if mesons were produced. It is important to check
the predictions of these and other models; furthermore,
“B factories” could exploit a possible yield here as they
have done for mesons on the (4S).
In this Letter we examine yields because in a simple spectator
model the decays into the nearly all the time. Since the
branching ratio has already been measured to be
PDG , we expect a large difference
between the yields at the (5S) and the
(4S) that can lead to an estimate of the size of the
component at the (5S).
When we discuss the (5S) here, we mean any production
above what is expected from continuum production of quarks lighter
than the at an center-of-mass energy of 10.865 GeV. The
CLEO III detector is equipped to measure the momenta and directions
of charged particles, identify charged hadrons, detect photons, and
determine with good precision their directions and energies. It has
been described in detail previously in references CLEODR and
RICH .
In this analysis we use 0.42 fb-1 of integrated luminosity
taken at the (5S) peak in Feb. 2003. We also use 6.34
fb-1 of integrated luminosity collected on the (4S)
and 2.32 fb-1 of data taken in the continuum 40 MeV in
center-of-mass energy below the (4S). These data were
accumulated between Aug. 2000 and June 2001. The detector hardware
wasn’t changed over the entire time period. Efficiencies are
carefully monitored and did not change measurably between data sets.
We look for candidates through the reconstruction of three
charged tracks in hadronic events via the
decay mode. Here and elsewhere in this
paper mention of one charge implies the same consideration for the
charge-conjugate mode. Requiring the Fox-Wolfram shape parameter
Fox to be less than suppresses continuum
background events which are less isotropic than -quark events.
Pairs of oppositely charged tracks were considered candidate decay
products of a if at least one of the tracks is identified
as a kaon, and if the invariant mass of the system is
within of the nominal mass. A third
track was combined with the system to form a
candidate without using particle identification.
The Ring Imaging Cherenkov (RICH) of the CLEO III detector is used
for track momenta larger than 0.62 GeV/c. Information on the angle
of the detected Cherenkov photons is translated into a Likelihood of
a given photon being due to a particular particle analyzed with a
specific mass hypothesis. Contributions from all photons associated
with a particular track with one mass hypothesis are then summed to
form an overall Likelihood denoted as for each “”
particle hypothesis.
To utilize the information on the ionization loss in the drift
chamber of the CLEO III detector, dE/dx, we calculate the
differences between the expected and the observed ionization losses
divided by the error for the pion and kaon hypotheses, called
and .
We use both RICH and dE/dx information in the following manner: (a)
If neither RICH nor dE/dx information is available, then the track
is accepted. (b) If dE/dx is available and RICH is not, then we
insist that kaon candidates have
(c) If RICH information
is available and dE/dx is not available, then we require that
for kaons.
(d) If both dE/dx and RICH information are available, we require
that for kaons.
To suppress combinatoric backgrounds, we take advantage of the
polarization of the as it is a vector particle while the
other particles in this decay are spinless. The expected
distribution from real decays varies as ,
where is the angle between the and the
momenta measured in the rest frame while combinatoric
backgrounds tend to be flat. Thus, we require to be
larger than .
For combinations satisfying the previous requirements,
we look for candidates having a momentum less than half of the
beam energy. Instead of momentum we choose to work with the variable
which is the momentum divided by the beam energy, to
remove differences caused by the change of the beam energies between
continuum data taken just below the (4S), at the
(4S) and at the (5S). The invariant
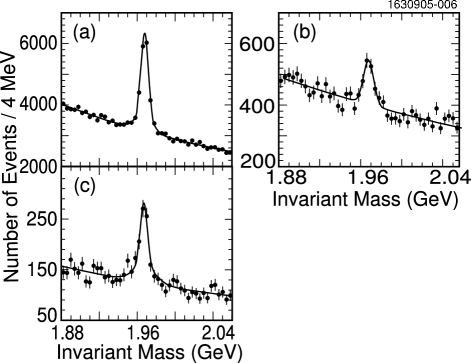
mass distributions for are shown in
Fig. 1.
Figure 1: The invariant mass distributions of the candidates
with 0.5 from: (a) the (4S) on-resonance
data (b) the continuum below the (4S)
resonance data (c) the (5S) on-resonance data.
We fit the invariant mass of the candidates in 10
different intervals (from 0 to 0.5) for data taken at the
(4S) peak, at the continuum below the (4S) and
at the (5S) peak.
The invariant mass distribution in each interval of the
(4S) data set was fit to a Gaussian signal shape and a
linear background. The width of each Gaussian was allowed to float.
The corresponding distributions at the other energies were similarly
fit, but with the corresponding Gaussian widths fixed to those
determined at the (4S). The raw yields are
listed in the second, third and fourth columns of
Table 1.
The number of candidates is determined by subtracting the
scaled four-flavor (, , and quark) continuum data
below the (4S) from the (4S) and from the
(5S) data. To determine the scale factors, , we
account for both the ratio of luminosities and the dependence of
the continuum cross section using
(1)
where , , and are the
collected luminosities and the center-of-mass energies at the
(nS) and at the continuum below the (4S). We
find: and .
The second (systematic) error on these scale factors is determined
by using the number of charged tracks in the interval.
The lower limit is determined by the maximum value tracks from
events can have, including smearing due to the
measuring resolution, and the upper limit is chosen to eliminate
radiative electromagnetic processes. Since the tracks should be
produced only from continuum events, we suppress beam-gas and
beam-wall interactions, photon pair and pair events using
strict cuts on track multiplicities, event energies and event
shapes. (Since particle production may be larger at the higher
energy than the continuum below the ,
we apply a small multiplicative correction of (0.61.1)%, as
determined by Monte Carlo simulation to the relative track yields.)
We find that the scale factors using this track counting method are
2.6680.007, and , for
and , respectively, and use the difference as the systematic
error.
The total number of hadronic events above four-flavor continuum are
equals and equals . The and systematic
errors here are due to the and systematic errors on
and scale factors respectively.
The branching ratio of in each -th
interval is given by
where are the continuum subtracted on
resonance yields. is taken as
49.1% PDG . The reconstruction efficiency is
taken to be the same at both resonances. This is reasonable because
our tracking and particle identification efficiencies are carefully
monitored and did not change significantly between data sets.
Specifically, our Monte Carlo simulations of the
reconstruction efficiencies includes time dependent effects of dead
channels and individual hit efficiencies in both the tracking and
RICH systems. A comparison of the simulations at both energies shows
changes in the reconstruction efficiency between the two energies of
2%.
The
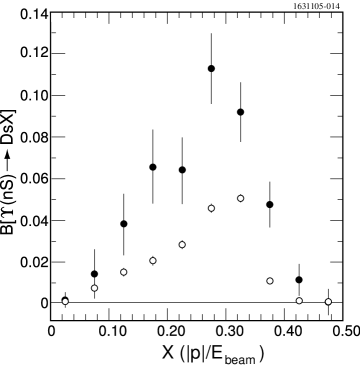
results are listed in Table 1. We show in
Fig. 2 the distribution of the inclusive
yields from (4S) and (5S) decays, continuum
subtracted and efficiency corrected.
()
ON (4S)
ON
(5S)
Continuum
(%)
(%)
0.00-0.05
0.05-0.10
0.10-0.15
0.15-0.20
0.20-0.25
0.25-0.30
0.30-0.35
0.35-0.40
0.40-0.45
0.45-0.50
Table 1: The dependent yields from the (nS)
data, the continuum below the (4S), the (nS)
continuum subtracted data, , the efficiency
, and the partial branching ratios
=, for equal to 4S and 5S. The
errors are statistical only.
Figure 2: Branching rate as a function of from
(5S) decays (filled circles) and from (4S) decays
(open circles).
The total production rate is found by summing the partial production
rates. The product of the production rate at the
(4S) and the is
(3)
which is in a good agreement with previous measurements
PDG , while at the (5S)
(4)
Many systematic errors cancel in the ratio of decay rates. Thus
(5)
directly demonstrates, at 5.6 standard deviation significance, a
much larger yield of at the (5S) than at the
(4S).
We use , which is the
weighted average of the PDG value PDG
and the recent measured value of
DsNewMeas , although the latter value is at the 90% c.l.
upper limit found previously Muheim . We find
(6)
and consequently:
(7)
In addition, we find
(8)
From these results, we estimate the size of
component at the (5S) in
a model dependent manner. Here we start with the knowledge that
an equal admixture of and mesons decay into the sum of
and mesons roughly 100% of the time PDG . Thus
we expect mesons to decay into mesons also about 100%
of the time. In what follows we estimate our own theoretical
corrections to this number.
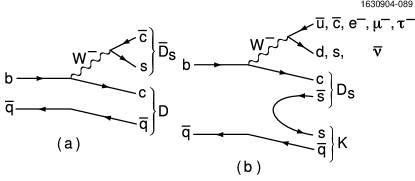
Figure 3: Dominant decay diagrams for a meson into mesons
( is either a or quark).
We know that the branching fraction comes either from the
process, shown in Fig. 3(a), or from the piece if
it manages to create an pair through fragmentation,
see Fig. 3(b).
Figure 4: Dominant decay diagrams for a meson into mesons.
Similarly, the production of mesons from decay arises
from two dominant processes. Fig. 4(a) shows the simple
spectator process that is expected to produce mesons nearly
all the time; here the primary transition has the charm
quark pairing with the spectator anti-strange quark.
Fig. 4(b) shows the subset of process (a) where and these two quarks form a color singlet pair. The
chances of this occurring should be similar to the chance of getting
an upper-vertex in decay (Fig. 3(a)), i. e. a
along with a .
We can use data to help estimate the size of these processes. First
let us consider the diagram shown in Fig. 4(a). The
nearly 100% probability that this process will produce mesons
is reduced if the pair fragments into a kaon plus a
instead of a by producing an additional or
pair. We don’t actually know the size of this
fragmentation, though it’s clear that producing a light
quark-antiquark pair ( or ) is easier
than . We estimate that the reduction in yield
due to this fragmentation is a effect. Next we
estimate the size of the process depicted in Fig. 4(b).
The modes have branching fractions that sum to about
. There are some additional decays due to and
decays, that also contribute mesons. We
add these and estimate an extra ( of mesons in
decays produced by diagram Fig. 4(b). Taking into
account all these contributions, we derive a model dependent
estimate of . Therefore, we use .
We can estimate now the fraction of the (5S) that decays
into , which we denote as . The
yields at the come from two sources, and
mesons. The equation linking them is
where the product branching fractions and are given by equations
4 and 3 respectively. Therefore, at the
(5S) energy, we obtain the
ratio to the total quark pair production above
four-flavor (, , and quarks) continuum of
(10)
The systematic errors in this analysis are dominated by the
relative error on and on scale factors
which contribute large components ( and ) to the
error on the number of hadronic events above continuum at the
(4S) and (5S). There is also a contribution from
the error on the branching fraction estimate
and a contribution from the error on the absolute
branching fraction. An additional component comes
from a error on the detection efficiency, which
includes a error on the tracking efficiency and a error
on the particle identification, both per track. We also have
error on the yields due to the fitting method. The total systematic
error is obtained by summing all entries in quadrature.
In conclusion, we have measured the inclusive yields of mesons
as and
. The ratio
(11)
provides the first statistically significant evidence (5.6)
of substantial production of mesons at the (5S)
resonance. Using a model dependent estimate of , we find that the ratio to the
total quark pair production above the four-flavor
(, , and ) continuum at the (5S) energy is
(12)
Several phenomenological models predict the decay rates of the
(5S) into combinations of and
, though here we are only concerned
with the relative fraction . The unitarized quark model
estimates UQM and the predictions of Martin and Ng CC
are about 30%, both somewhat larger than our measurement. Byers and
Eichten NQM present two models both giving 20% in
good agreement with our finding.
We gratefully
acknowledge the effort of the CESR staff in providing us with
excellent luminosity and running conditions. This work was
supported by the National Science Foundation and the U.S.
Department of Energy.
References
(1)
D. Besson et al. (CLEO Collaboration), Phys. Rev. Lett. 54,
381 (1985).
(2)
D. M. Lovelock et al. (CUSB Collaboration), Phys. Rev. Lett. 54, 377 (1985).
(3)
S. Ono et al., Phys. Rev. Lett. 55, 2938 (1985); S. Ono, A. I.
Sanda, N. A. Törnqvist, Phys. Rev. D 34, 186 (1986); N. A.
Törnqvist, ibid 53, 878 (1984).
(4)
A. D. Martin and C.-K. Ng, Z. Phys. C 40, 139 (1988).
(5)
N. Beyers and E. Eichten, Nucl. Phys. B (Proc. Suppl.) 16, 281
(1990); N. Beyers [hep-ph/9412292] (1994).
(6)
S. Eidelman et al., Phys. Lett.. B592, 1 (2004).
(7)
D. Peterson et al., Nucl. Instrum. and Meth. A478, 142
(2002); Y. Kubota et al. (CLEO), Nucl. Instrum. and Meth. A320, 66 (1992).
(8)
M. Artuso et al., “The CLEO RICH Detector,”
[arXiv:physics/0506132] and M. Artuso et al., Nucl. Instrum. and
Meth. A502, 91 (2003).
(9)
G. Fox and S. Wolfram, Phys. Rev. Lett.. 41, 1581 (1978).
(10)
B. Aubert et al et al.. Phys. Rev. D 71, 091104(R) (2005).
(11)
F. Muheim and S. Stone, Phys. Rev. D 49, 3767 (1994).