Observation of the State of Charmonium
Abstract
The spin-singlet P-wave state of charmonium, , has been observed in the decay followed by . Inclusive and exclusive analyses of the spectrum have been performed. Two complementary inclusive analyses select either a range of energies for the photon emitted in or a range of values of . These analyses, consistent with one another within statistics, yield MeV/ and a product of the branching ratios . When the is reconstructed in seven exclusive decay modes, events are seen with an average mass MeV/, and . If combined, the inclusive and exclusive data samples yield an overall mass MeV/ and product of branching ratios . The mass implies a P-wave hyperfine splitting MeV/.
pacs:
14.40.Gx, 13.25.Gv, 13.20.Gd, 12.38.QkSince the discovery of the , the first bound state of a charmed quark and charmed antiquark Aubert:1974js ; Augustin:1974xw , the (charmonium) spectrum has provided many insights about quarks and the forces holding them together. The charmed quark was the first to be found with a mass larger than the characteristic scale of quantum chromodynamics (QCD). Charmonium bound states thus could be treated starting from a nonrelativistic description Appelquist:1974zd . One could calculate decay rates and level splittings and thereby determine the magnitude of the strong coupling constant at the charm mass scale, and the Lorentz structure of the force confining quarks (see, e.g., Novikov:1977dq ; Kwong:1987mj ; Quigg:2004nv for reviews.)
The hyperfine (spin-spin) splittings in charmonium S-wave states are appreciable Eidelman:2004wy ; etacmass :
| (1) |
For an interquark potential , the sum of vector and scalar contributions, only the vector part contributes to the spin-spin splitting Novikov:1977dq ; Kwong:1987mj ; Ng:1985uq ; Pantaleone:1985uf , giving rise in lowest order of ( is the mass of the charmed quark) to a spin-spin interaction perturbation
| (2) |
The second equality on the right-hand side is obtained when one takes and neglects the slow variation of with scale. The resulting local spin-spin interaction then contributes only to splittings in S-wave states. Taking account of the scale dependence of Ng:1985uq ; Pantaleone:1985uf and wave function variations, one finds at most a few MeV/ splitting between the state and the spin-weighted average of the states Eidelman:2004wy : MeV. Small splittings are also consistent with a wide variety of estimates in potential models models and non-relativistic QCD NRQCD , as well as with lattice gauge theory estimates latt . Values of larger than a few MeV/ could indicate unexpected behavior of the vector potential , unexpectedly large distortions of the masses of the states due to coupled-channel effects, or – in lattice theory – effects of light-quark degrees of freedom.
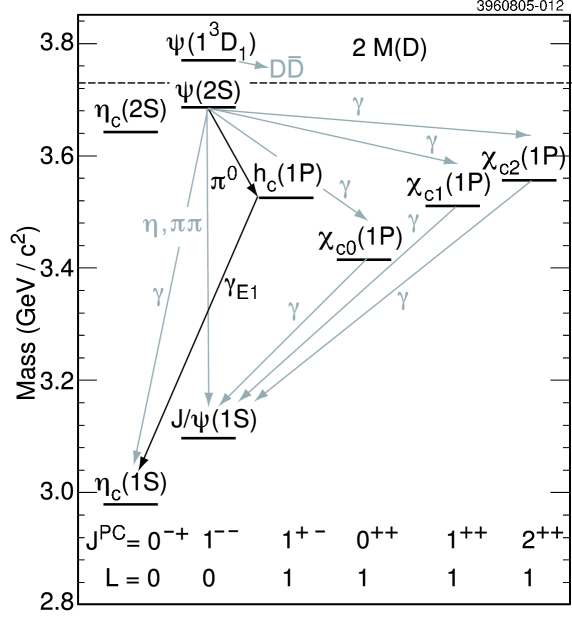
The low-lying charmonium spectrum is illustrated in Fig. 1. The can be easily populated by radiative transitions from the . Their subsequent radiative decays to also are prominent. In contrast, the state is not easily produced. It can be produced in the direct channel, and a few events were seen at the CERN Intersecting Storage Rings (ISR), clustered about MeV/ Baglin:1986yd . The significance of the signal was . Stronger evidence was presented by Fermilab Experiment E760 in the channel Armstrong:1992ae , with a combined branching ratio
| (3) |
for MeV/, with an additional possible shift of up to MeV/ due to resonance-continuum interference. However, E835, the sequel to E760 with three times its integrated luminosity, did not confirm the E760 signal Joffe ; Andreotti:2005vu . Instead, a signal with significance for was reported recently Andreotti:2005vu , with MeV/, width MeV, and eV.
The decay can occur via isospin mixing (e.g., – mixing) in the neutral pion Segre:1976wj . Previous experimental upper limits on the branching ratio for this process are –80 for between 3500 and 3535 MeV/, and for MeV/, where Porter:1982 . Ko Ko:1994nw estimated . A recent theoretical range is – Kuang:2002hz .
The decay is an electric dipole (E1) transition whose matrix element should be the same as that for the decays . Estimates E1rate of range between 160 and 560 keV; a recent value is 354 keV Godfrey:2002rp . The hadronic and photon + hadronic decay rates of are not as well estimated, but the total width is generally found to be 1 MeV or less, with Ref. Godfrey:2002rp obtaining 0.94 MeV and hence . In other treatments this branching ratio can be larger; it is rarely smaller. In the polarizations of the and should be almost identical, since the spinless is expected to be emitted in an S wave. The subsequent E1 transition should then lead to a photon with distribution with respect to the beam axis.
The present paper describes the identification of at the Cornell Electron Storage Ring (CESR), using the CLEO III and CLEO-c detectors, via the sequential process
| (4) |
illustrated by the bold arrows in Fig. 1 labeled “” and “,” respectively. Exclusive reconstruction of decays in seven modes permits observation of with convincing significance and little background, while inclusive analysis in which the is not reconstructed provides a better measurement of and of the combined branching ratio for .
We mention relevant aspects of the CLEO detector in Section II. An overview of inclusive and exclusive analysis methods is presented in Section III. We then describe background sources and suppressions (Sec. IV), data sample and event selection (Sec. V), Monte Carlo samples (Sec. VI), the extraction of signal from the data (Sec. VII), and systematic errors (Sec. VIII). The combined results of the different analyses are presented in Sec. IX. A summary and discussion of the results are given in Sec. X.
II. THE CLEO DETECTOR
The data upon which the present report is based were taken with the CLEO III and CLEO-c detectors, described in detail elsewhere Kubota:1991ww ; Viehhauser:2001ue ; Peterson:2002sk ; Artuso:2002ya . Elements critical for the analyses presented here are the calorimeter and, for the exclusive analysis, the charged particle tracking and particle identification systems. The barrel (80% of ) and endcap (additional 13% of ) electromagnetic calorimeters consist of a total of 7800 thallium-doped cesium iodide (CsI) crystals. Their excellent resolutions in position and energy (2.2% at GeV and 5% at 100 MeV) are a major source of sensitivity and discrimination against background in identifying the chain of decays , and in measuring . Pion/kaon separation is performed utilizing the energy loss in the drift chamber, , and photons in the Ring-Imaging Cherenkov (RICH) counters. The combined and RICH particle identification system has an efficiency of and misidentification rates of for both and . Approximately one-half of the data sample used an upgraded configuration, denoted CLEO-c, with an inner drift chamber detector sensitive to longitudinal position Briere:2001rn .
III. OVERVIEW OF ANALYSES
In the analyses described here one starts by looking for the neutral pion emitted in , expected to have an energy of MeV for MeV/ Aulchenko:2003qq when MeV/, and the E1 photon emitted in , with an expected energy in the rest frame of MeV for MeV/ etac . One takes advantage of the good energy resolution of the CLEO electromagnetic calorimeter by searching for an enhancement in the spectrum of masses recoiling against the ,
| (5) |
reducing background by selecting a range of E1 photon energy or mass in the transition , with
| (6) |
Here and are the energy and the magnitude of the three-momentum in the rest frame, while is the angle between the and in that frame.
A search that is inclusive with respect to the decay, i.e., one that imposes no further requirements on the decay products, exploits the full event yield. With a sample of approximately three million , an estimated product branching ratio , and an estimated efficiency of about 15%, one expects about 180 counts in the peak in inclusive analyses, albeit on top of a background several times larger.
An exclusive analysis, in which specific decay modes of the are detected, benefits from much lower backgrounds with reduced efficiency. In the present analysis nearly 10% of all decays are reconstructed, leading one to expect events with little background. The method is validated by reconstructing the more abundant decays in the direct reaction , for which Athar:2004dn . (The Particle Data Group average of other measurements is Eidelman:2004wy .)
The following features are common to both inclusive and exclusive analyses. The sensitivity of the search for depends upon the degree to which the peak can be recognized above a background which rises sharply as energy increases. Thus understanding of resolution is central to observation of the in this process. It is also crucial in pinning down the mass of .
Because the signal in is expected to have fairly low momentum, its decay photons tend to be back-to-back in azimuth. Mismeasurements of their energies are partly compensated by the mass constraint used when combining them into a candidate and thus affect the detection probability only minimally, resulting in a narrow distribution in energy and therefore in , as will be seen in the specific analyses described below.
At MeV (the energy of the expected signal for ), the experimental resolution of the photon energy is comparable to that expected from Doppler broadening of the when the photon is observed in the rest frame ( MeV). One can correct for this broadening using information on as in Eq. (6).
Two complementary inclusive analyses have been pursued. In one, candidates for are selected by choosing events containing an E1 photon candidate in a range of energies expected for , and displaying a peak in . This method has the advantage that backgrounds to the signal photon and are uncorrelated with one another, but it presupposes foreknowledge of the interesting range of values, and does not compensate for the broadening of the photon energy spectrum due to recoil. In a second inclusive method, events are chosen within a given range of as calculated from the energies and relative angle of the and , and displays a peak in . This method compensates for the recoil broadening of the energy spectrum and does not presuppose a value of . However, since both photon and energies are needed to calculate , backgrounds are correlated, and some subtraction methods appropriate for the first method are not valid for the second.
Exclusive reconstruction of decay modes of the offers the potential of significant background reduction. The following decay modes were studied: , , , , , , . They are summarized in Table 1 together with their branching fractions in decay Eidelman:2004wy . In order to reduce the effect of the poorly known branching ratios, the ratio of rates of decay to and is measured. The normalizing mode has been recently measured at CLEO Athar:2004dn . Its study also permits us to construct and verify event selection criteria in reconstruction.
| Mode | (%) |
|---|---|
| Total |
IV. BACKGROUND SOURCES AND SUPPRESSIONS
We first describe major backgrounds to the signal, and how they are suppressed, in a qualitative manner. Details of background suppression are described in the next section. Selection criteria are applied in different ways depending on the nature of the analysis.
-
•
The transition . Approximately 1/3 of all decay to the final state Adam:2005uh . Subsequent decays of can generate both soft s (a background to the signal for ) and hard photons in the vicinity of the signal energy MeV for the expected E1 transition . Thus, all analyses to be reported here excluded some range of mass around recoiling against in the reaction .
-
•
The transition . The decay accounts for about 1/6 of all decays Adam:2005uh . In addition to the backgrounds mentioned above for charged pion pairs, either of the two neutral pions can be mistaken for that in the signal for . Thus, in inclusive analyses, a range of masses around in the spectrum recoiling against the dipion pair in was excluded.
-
•
The transition . The sum of the product branching ratios exceeds 5% Adam:2005uh . This background can be reduced by excluding events with a range of masses around in the spectrum recoiling against in .
-
•
Candidates for 500 MeV E1 photons which are or decay products. A sufficiently energetic can give rise to a photon which can be mistaken for the signal E1 photon in . It is possible to suppress such photons by rejecting all candidates which can form a candidate if paired with another photon. A similar rejection of decay products also can be applied.
-
•
Mis-pairings of candidates for decay. In general photons from decays are identified by requiring that their energies and directions lead to a reconstructed mass within about 15 MeV/ of the nominal value of 135 MeV/. If some other pairing gives a better-reconstructed mass, the original pairing is discarded and the better pairing is adopted.
V. DATA SAMPLE AND EVENT SELECTION
The data samples obtained with the CLEO III and CLEO-c configurations are shown in Table 2, where the number of events was calculated by the method described in Athar:2004dn and was estimated to have an uncertainty of .
| Detector | Time | |||
|---|---|---|---|---|
| period | (MeV) | (pb)-1 | ||
| CLEO-III | 2002–3 | 1.5 | 2.74 | 1.56 |
| CLEO-c | 2003–4 | 2.3 | 2.89 | 1.52 |
| Total | 5.63 | 3.08 |
Common features of event selection for all analyses are listed in the following. Several other analysis-specific criteria will be described in the corresponding subsections. Selection requirements for all analyses are summarized in Table 3.
-
•
Charged particle selection criteria were standard ones used for other CLEO analyses. The distance of closest approach of a track with respect to the run-averaged collision point was required to be less than 5 cm along the beam line and less than 0.5 cm in the direction transverse to the beam. Each track was required to be fitted with a reduced (i.e., per degree of freedom) of less than 20, to give between 50% and 120% of the expected number of signals on drift chamber wires, and to make an angle of at least with respect to the beam axis.
-
•
A photon candidate was defined as a shower which does not match a track within 100 mrad, is not in a “hot” cell of the electromagnetic calorimeter, and has the transverse distribution of energy consistent with an electromagnetic shower.
-
•
The minimum photon candidate energy was set at 30 MeV in the barrel and 50 MeV in the endcaps.
-
•
In kinematic fitting, photon energies and angles for candidates were adjusted to give the exact mass. This increases precision in the determination of the energy and hence the mass, which is computed from Eq. (5) using the nominal values of and .
-
•
Photon candidates for the E1 transition were subjected to background suppression involving vetoing of candidates which could form a .
-
•
Neutral pion candidates were tested for the possibility that one of their showers could form a neutral pion with some other shower, and were rejected if any other pairing was more consistent with a mass.
-
•
Events were flagged if they were candidates for the processes or and rejected accordingly.
-
•
When an empirical parametrization of the background shape was needed, the analyses employed a convenient parametrization of backgrounds to the recoil spectrum known as an ARGUS function ARGUSfn , appropriate for processes such as in which there is a kinematic endpoint, equal here to MeV/.
-
•
A large generic Monte Carlo sample of million events permitted the optimization of signal-to-background ratio by adding an appropriately normalized sample of signal Monte Carlo events and choosing event selection criteria to maximize the likelihood ratio for fits with and without a resonance signal.
-
•
The distribution of the photon polar angles in both and (relevant to the exclusive analysis) was assumed to be . For the former decay this assumption is based on the expectation that the retains the polarization in the (mainly S-wave) process .
| Property | Inclusive analysis specifying: | Exclusive | |
|---|---|---|---|
| or quantity | range | range | analysis |
| Initial | charged | Depends on # | Hadronic |
| event | tracks and | ( of charged | selection |
| selection | showers | tracks (see text) | (see text) |
| or | |||
| range | MeV | MeV/ | MeV/ |
| Photon | 10 most | All | All |
| showers | energetic | ||
| Photon | Barrel plus | Barrel | Barrel plus |
| acceptance | endcaps | only | endcaps |
| No. of in | One and | One and | At least |
| signal region (a) | only one | only one | one |
| rejection | Reject best- | Reject all | Reject all |
| on | pull only | with pull | with pull |
| rejection | None | None | |
| on | MeV/ | ||
| excluded | MeV/ | MeV/ | MeV/ |
| None | |||
| excluded | MeV/ | MeV/ | |
| None | |||
| rejection | MeV/ | MeV/ | |
(a) Defined as giving MeV/
A. Inclusive analyses
The event selection criteria for the analysis selecting a range of are summarized in Table 3. Showers were required to have at least 30 MeV energy if detected in the barrel region of the calorimeter and at least 50 MeV if detected in the endcaps. Only the ten highest-energy showers and tracks in an event were considered, in order to reduce combinatorial background. A maximum of ten neutral pions composed of the ten highest-energy showers was considered.
Neutral pions were reconstructed by requiring that the two-photon invariant mass be in the range MeV/ or within three standard deviations of the peak. (Resolutions in MeV/ depend on properties of each candidate, such as energy and calorimeter location.)
Selection criteria were guided by maximizing the likelihood ratio for fits to Monte Carlo-generated background with and without a simulated signal. In order to reduce the abundant background due to photons and charged particles from the decay of , the cascades were suppressed by excluding candidates for using the criteria in the second column of Table 3. Photon candidates for in were rejected if they could form a or (defined, respectively, by or MeV/) when combined with any other photon. It was demanded that there be only one photon in the event with energy MeV.
In the complementary analysis selecting a range of (Table 3, third column), events were chosen corresponding to a slight modification of a previously used criterion Athar:2004dn for selection of hadronic events at the energy.111For ( = number of charged tracks), the maximum energy visible in the calorimeter was required to be less than the total center-of-mass energy , vs. in Ref. Athar:2004dn . For the criteria were the same as in Ref. Athar:2004dn . Background suppression techniques were similar in most respects to those of the other inclusive analysis except for the following details:
-
•
Photons for or candidates were chosen only in the barrel region of the electromagnetic calorimeter, in an attempt to improve energy resolution.
-
•
Neutral pion candidates were required to have a mass within of the peak, and were rejected if any other pairing of photons within this same “pull mass” (normalized deviation from the correct mass in units of Gaussian width) provided a better fit to the mass. Partner photons for this rejection were allowed to be either in endcaps ( MeV) or barrel ( MeV).
-
•
Candidates for the E1 transition photon which could form a were vetoed Athar:2004dn as in the -selection analysis, rejecting any photon forming a pair with mass less than from when combined with a photon in endcap regions of the calorimeter with at least 50 MeV or barrel regions with at least 30 MeV. However, Monte Carlo simulations (to be discussed in Sec. VI) indicated no need to veto mesons.
B. Exclusive analysis
The exclusive analysis measures the ratio of the cascade decays to the direct radiative decays by identifying the decay channels listed in Table I. To design event selection criteria, 20,000 signal Monte Carlo were generated for each mode of the cascade and direct radiative decays. The 39 million generic Monte Carlo decays without were utilized to study the background to the cascade decay. All reconstructed events were required to have no extra tracks and total extra unmatched shower energy less than 200 MeV. The basic particle selection criteria, in addition to those mentioned at the start of this Section, include the following specific to this analysis:
-
•
: Mass less than from nominal value.
-
•
: Decay displaced by more than with respect to the run-averaged collision point, mass within 10 MeV/ of nominal value
-
•
: Mass within of the nominal value
-
•
: within 20 MeV/ of the nominal mass
Information from the RICH and detectors was combined to distinguish kaons from pions when RICH information was available. RICH information was utilized when a track was in the RICH fiducial volume with , a kaon candidate had momentum at least 600 , and three or more photons were detected near the predicted ring location. A combined “Log-Likelihood” was defined as , where is times the natural logarithm of the RICH likelihood for the pion hypothesis, and is for the kaon hypothesis, while is the deviation of from what is expected for the pion hypothesis normalized to the measurement error and is the same for the kaon hypothesis. If RICH information was not available, a track was identified as a kaon if and . When RICH information was not available and track momentum was above 600 , a track was identified as a pion if . When RICH information was available or track momentum was below 600 , charged kaons and pions were well-separated. In the and modes, at least one kaon candidate was required to be identified when and were well-separated.
Because the resonance width is only 0.3 MeV, considerably less than the beam energy spread, the beam energy was always assumed to be half of when running at the .222The crossing angle is around 4 mrad, corresponding to a transverse momentum of about 3686 MeV/. In , the missing mass should equal the nominal mass since the is undetected. In this case, a 1C kinematic fit was performed assuming that the missing particle has the mass of . In all other modes, final decay particles were fully reconstructed, and the net 4-momentum of reconstructed charged or neutral tracks should equal the 4-momentum of the which is known, permitting 4C kinematic fits. The values from the fits indicate how well each reconstructed event matches the kinematics of the decay hypothesis. A rather loose requirement of /d.o.f. in all modes was imposed. The signal was fully reconstructed in all the modes except . In , the mass was inferred from the energies of the recoiling E1 photon and .
Generic Monte Carlo studies indicate that photons from s in and () decays are a large background source to . A photon candidate was vetoed if the absolute value of its best pull mass, when combined with all other photons of energies greater than 30 MeV, was less than 3. This cut greatly reduced the background but also resulted in a 15% efficiency loss according to signal Monte Carlo. The net effect on the expected sensitivity to was positive.
VI. MONTE CARLO SAMPLES
Monte Carlo simulations of background and signal were employed in order to optimize event selection criteria and to estimate backgrounds to data. The generic Monte Carlo sample mentioned earlier was used. Simulations employed hadronization routines embodied in JETSET JETSET , with its parameters optimized for decays Athar:2004dn . The detector simulation was based on Geant GEANT . Hadronization of decays was emulated using Model 14 of the LUND/JETSET fragmentation algorithm.
A. Inclusive analyses
1. Choice of background shapes.
The -range analysis uses the recoil spectrum from the data itself as background, without demanding a candidate with MeV for the E1 photon. This is feasible since the contribution is invisible, being at the level of . The -range analysis uses generic Monte Carlo background instead, since the selection of an mass range in analyzing the data affects the background shape.
2. Optimization of signal significance.
Monte Carlo samples were employed to choose ranges of selection providing the highest sensitivity to the signal, as judged by maximum likelihood for the resonance hypothesis. These samples also permitted studies of input/output agreement and statistical variation. The optimum event selection criteria determined in these Monte Carlo studies were applied to the data.
In the -range analysis, 30,000 signal events were generated for . Assuming , 15,600 signal events were added to the 39 million generic Monte Carlo sample. The input masses and widths were taken as MeV/, MeV, and MeV/, MeV etac . In the -range analysis, events were generated for , with a 37.7% branching ratio Godfrey:2002rp for the subsequent decay . The remaining decays were taken to have a 56.8% branching ratio to and a 5.5% branching ratio to . The mass of was assumed to be 3525.3 MeV/, and the width was taken to be 1 MeV. The mass of was chosen as 2981.8 MeV/ etac .
The results of the Monte Carlo studies for the -range analysis are summarized in the second and third columns of Table 4. Significance levels are obtained as , where is the maximum likelihood for the resonance fit, and is the likelihood for the fit with no resonance. Selection ranges (summarized in the second column of Table 3) were chosen to maximize the significance for the Monte Carlo sample calculated in this manner. For each effect examined, asterisked values for all other parameters were assumed.
| MC | DATA | ||||||
| Signif. | Mass, MeV/ | Yield | /DOF | Signif. | |||
| Effect of background shapes | |||||||
| DATA | 3524.40.7 | 13941 | 3.41.0 | 1.36 | 3.6 | ||
| MC | 3524.60.7 | 14640 | 3.51.0 | 1.59 | 3.8 | ||
| All of the following optimizations were done using background from DATA | |||||||
| Effect of changing range of hard energy, 503, MeV/ | |||||||
| 30 | 16.4 | 1.01 | 3524.00.7 | 12038 | 3.10.9 | 1.19 | 3.3 |
| 35 | 17.3 | 1.00 | 3524.40.7 | 13941 | 3.41.0 | 1.36 | 3.6 |
| 40 | 16.1 | 0.96 | 3524.40.6 | 14543 | 3.41.0 | 1.28 | 3.5 |
| 45 | 16.3 | 0.90 | 3524.80.8 | 13445 | 3.01.0 | 1.24 | 3.1 |
| 50 | 15.8 | 0.86 | 3524.80.9 | 13247 | 2.91.0 | 1.26 | 2.9 |
| Effect of changing mass range for rejection, MeV/ | |||||||
| 17.2 | 0.97 | 1.28 | 3.9 | ||||
| 17.3 | 0.99 | 1.36 | 3.9 | ||||
| 17.3 | 1.00 | 1.36 | 3.6 | ||||
| 17.1 | 1.00 | 1.38 | 3.4 | ||||
| Effect of changing mass range for rejection, MeV/ | |||||||
| 17.2 | 0.99 | 1.45 | 3.4 | ||||
| 17.2 | 1.00 | 1.30 | 3.4 | ||||
| 17.3 | 1.00 | 1.36 | 3.6 | ||||
| 17.3 | 1.00 | 1.30 | 3.8 | ||||
| Effect of number of s in the signal region | |||||||
| 17.3 | 1.00 | 1.36 | 3.6 | ||||
| 17.2 | 0.95 | 1.04 | 3.0 | ||||
| Effect of endcap s in signal s | |||||||
| with | 17.3 | 1.00 | 1.36 | 3.6 | |||
| without | 16.0 | 0.91 | 1.16 | 3.5 | |||
| Effect of suppression on E1 photon | |||||||
| with | 17.3 | 1.00 | 1.36 | 3.6 | |||
| without | 15.8 | 0.91 | 1.21 | 3.1 | |||
| Effect of suppression | |||||||
| without | 17.3 | 1.00 | 1.36 | 3.6 | |||
| with | 17.0 | 1.02 | 1.21 | 3.6 | |||
| Table IV, continued | |||||
| DATA (no MC entries) | |||||
| Mass, MeV/ | yield | /DOF | signif. | ||
| Effect of changing total width of , MeV | |||||
| 1.36 | 3.6 | ||||
| 0.9 | 1.36 | 3.6 | |||
| 1.39 | 3.6 | ||||
| Effect of changing resolution widths | |||||
| MC | 1.36 | 3.6 | |||
| MC-25% | 1.35 | 3.6 | |||
| MC+25% | 1.39 | 3.6 | |||
| Effect of binning | |||||
| 2 MeV/ | 1.36 | 3.6 | |||
| 1 MeV/ | 1.16 | 3.5 | |||
| Effect of changing fit range, MeV/ | |||||
| 3496-3552 | 1.36 | 3.6 | |||
| 3500-3540 | 0.96 | 3.5 | |||
| CLEO III VERSUS CLEO-c | |||||
| CLEO III | 0.96 | 3.3 | |||
| CLEO-c | 1.55 | 2.1 | |||
These choices were found to lead to the same output from the generic Monte Carlo sample as the input:
| Input | Output | |
|---|---|---|
| (MeV/) | 3526.0 | |
| 4.0 |
The above choices were based on maximum likelihood in 22 variations with no contact with the experimental data, i.e., by “blind” analysis. The best choices indeed are mirrored in the data. Table 4 therefore lists for the data the values of the likelihood-based significance for all 22 variations examined in the Monte Carlo sample. It is interesting to note that these choices do lead to higher significance values in most cases, although, as is to be expected, because of the factor smaller statistics in the data, both the significance level and their variations are smaller than those in the Monte Carlo sample by a factor close to .
The recoil mass distribution for the Monte Carlo sample in the -range analysis is shown in Figure 2. It was fitted using the sum of two Gaussians with widths fixed to values determined by the signal Monte Carlo sample. The background was fitted using a histogram of the recoil distribution from the generic Monte Carlo as described above. The dashed line shows the contribution of background without signal.

MC
In the -range analysis, widths in were determined by fits using a Gaussian plus a low-order polynomial, while fits to used a Breit-Wigner resonance function with MeV convolved with two Gaussians, a quadratic polynomial constrained to vanish at the kinematic endpoint, and an ARGUS background function.
The best range of masses for optimizing signal significance was determined via Monte Carlo studies using a likelihood ratio criterion. Five windows 2940–3020, 2945–3015, 2950–3010, 2955–3005, and 2960–3000 MeV/ were considered. Upper and lower bounds were chosen symmetrically with respect to MeV/. Detection of the correct candidate for the E1 photon but assignment of a background with the wrong energy as a signal candidate can introduce a potential bias on in the presence of asymmetric limits.
Selecting events within the above windows, fits were performed for 3496 MeV/ MeV/ to the generated mass distributions. The signal Monte Carlo was generated using a flat angular distribution for the E1 photon. A correction to the efficiency was performed for the expected form with respect to the beam axis. The ratio of the two efficiencies when integrating to a maximum is . For , corresponding to the outermost ring of the barrel calorimeter used in this analysis, the correction factor is . The efficiencies were corrected for .
After fits to the signal Monte Carlo yielded the parameters of its Breit-Wigner plus Gaussian functions, the generic Monte Carlo distribution was combined with a weighted signal distribution to emulate a combined branching ratio for the decay followed by of . The resulting distribution was fitted both with (generic + weighted signal), and with generic background alone, yielding a ratio of likelihoods.

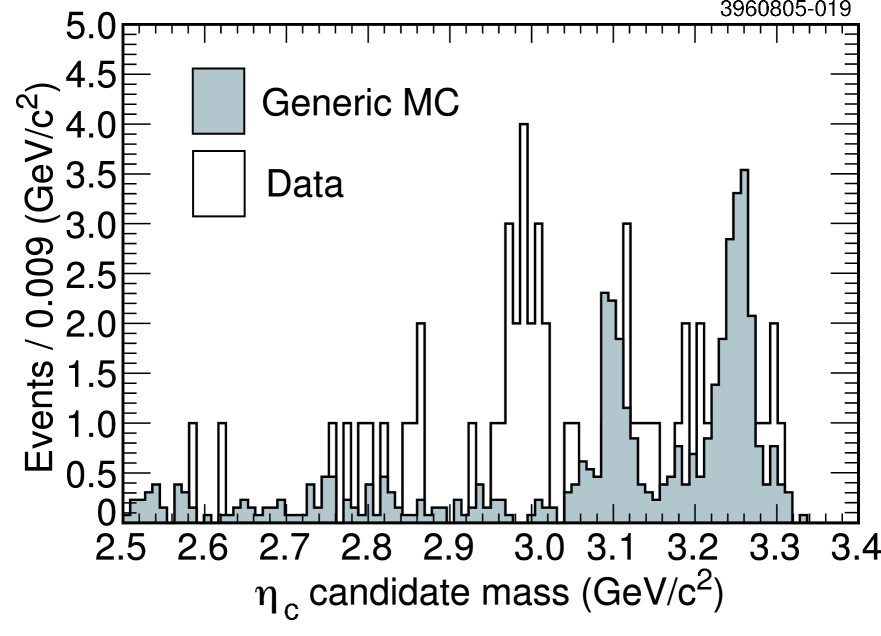
This process resulted in an optimum range of 2945 MeV/ MeV/. The corresponding distribution is shown in Fig. 3. For any wider range, the photons from the transition become contaminated with contributions of Doppler-broadened photons from the E1 transition . Backgrounds from this transition and others rise steeply as the upper limit on is increased above 3020 MeV/.
| range (MeV/) | |||||
| 2940–3020 | *2945–3015 | 2950–3010 | 2955–3005 | 2960–3000 | |
| 3525.240.16 | 3525.230.16 | 3525.220.17 | 3525.210.17 | 3525.180.18 | |
| Significance | 17.08 | 17.30 | 17.20 | 17.05 | 16.45 |
| Efficiency (%) | 15.3 | 14.6 | 13.5 | 12.2 | 10.6 |
Fits to simulated signal and background in the -range analysis are compared in Table 5. The mass range 2945–3015 MeV/ gives the greatest signal significance for an of mass 3525.3 MeV/ produced with . The extracted values of are about 0.1 MeV/ below the input. This feature is included in the estimate of systematic errors. The maximum significance of scales to for a sample of events.
3. Variations in output parameters.
In the generic Monte Carlo sample, for all the 22 variations of the -range analysis listed in Table 4, the change in output and were found to be MeV/, and , i.e., within the statistical errors assigned by the output. To see the level of statistical variations in Monte Carlo samples as small as the data (i.e., million ), the total sample of 39 million decays was split into 13 independent samples, each of 3 million . Table 6 summarizes results of the analysis for the choices of the final selection and for variations of these choices. For the final selection the limits of variation were found to be MeV/ and . For the effect of variations from the final selection is within the range observed for the final selection. There may be some evidence of larger than expected variation when one changes to MeV, and when one includes more than one signal candidate. A choice of MeV begins to accept photons on the high-energy tail of the transition when detector resolution and recoil effects are taken into account.
Because the Monte Carlo signal sample was generated with an assumed MeV/, or MeV, it is prudent to examine what bias is introduced in and if the true were to differ from 3526 MeV/. The resulting variation in efficiency was found to be less than 2.5% for MeV/.
| – MeV/ | – MeV/ with variations from final | ||||
| Final selection | MeV | No endcap | No supp. | ||
| MC | –0.4/+0.3 | –1.8/+0.7 | –2.1/+0.2 | –0.3/+0.2 | –0.4/+0.3 |
| Data | +0.4 | +0.4 | +0.4 | +0.2 | |
| – with variations from final | |||||
| Final selection | MeV | No endcap | No supp. | ||
| MC | –1.1/+1.4 | –1.2/+0.7 | –0.3/+1.1 | –0.5/+0.3 | –1.1/+0.3 |
| Data | –0.5 | –0.5 | +0.0 | –0.4 | |
| (MeV/) | (MeV/) with variations from final | |||||
| Final selection | MeV | MeV | w/endcap | w/ supp. | ||
| MC | –0.5/+0.3 | –0.5/+0.3 | –0.5/+0.4 | –0.4/+0.3 | –0.4/+0.4 | –0.4/+0.5 |
| Data | +0.4 | –0.3 | +0.0 | +0.5 | –0.4 | |
| – with variations from final | ||||||
| Final selection | MeV | MeV | w/endcap | w/ supp. | ||
| MC | –0.7/+0.5 | –0.7/+0.4 | –0.6/+0.4 | –0.6/+0.3 | –0.5/+0.4 | –0.5/+0.6 |
| Data | –0.6 | +0.1 | –0.3 | –1.5 | +0.1 | |
The corresponding variations in the -range analysis were explored by again forming 13 samples of million generic Monte Carlo and adding 13 samples of 3135 signal Monte Carlo events with , , and . This permitted simulation of a combined branching ratio . Fits were performed using the same functions used in fitting data. The results are shown in Table 7. Deviations from the mean were found to be of the expected magnitude for data samples of this size.
4. Quality of generic Monte Carlo simulation.
Because the CLEO generic Monte Carlo is used to determine optimum selection criteria for energy ranges and binary choices, one must quantify its level of agreement with data in emulating the spectrum. The EvtGen EvtGen generator is combined with a JETSET JETSET version tuned to match the relevant low-energy regime Athar:2004dn . For photon energies below 450 MeV and pion momenta below 550 MeV/, the data and Monte Carlo agree within . Above these values the ratio of data to Monte Carlo falls below 95%, rising again from above MeV and from above MeV/. For low energy photons in the slow from , the generic Monte Carlo is satisfactory, but its use over extended ranges of energy and momenta, as required in determining background shapes, may not be so. This provides a motivation for basing the background shapes on the data, i.e., the recoil spectrum without requiring MeV, instead of the recoil spectrum from the generic Monte Carlo.
5. Choices in analysis.
| / | Range | MC | Signal | |||
|---|---|---|---|---|---|---|
| mTk | supp | Mass (MeV/) | Evts. in pk. | |||
| * | * | *No | 17.3 | |||
| * | * | Yes | 16.9 | |||
| * | *No | 16.7 | ||||
| * | Yes | 16.3 | ||||
| mTk | * | *No | 17.3 | |||
| mTk | * | Yes | 16.9 | |||
| mTk | *No | 16.6 | ||||
| mTk | Yes | 16.2 | ||||
In the analysis, electromagnetic cascades involving E1 transitions to and from intermediate states were suppressed by excluding events with the effective mass of charged tracks exceeding 3050 MeV/ (“mTk” criterion). In the analysis, the mass recoiling against was reconstructed directly (“” criterion), and events with a recoil mass within MeV/ of were excluded.
In the analysis, which does not use endcap photons and does not restrict photons in candidates to the ten most energetic showers, an advantage in Monte Carlo significance by about appears when the range rather than the range is selected.
In the analysis, Monte Carlo likelihood ratios favor suppressing candidates which can form an when paired with other photons. In the analysis, which uses a larger pool of photon candidates for possible pairings, such a suppression entails a loss of efficiency for signal detection, leading to decreased significance in Monte Carlo by . The analysis consequently does not adopt this suppression.
The above three criteria were compared in a binary manner, leading to the results shown in Table 8. The effects of each variation are largely independent of each other when measured by change in significance. The first row was chosen over the fifth in the analysis on the basis of a very slight excess in Monte Carlo (MC) significance ; differences in resulting mass and branching ratio are within statistics.
6. Dependence on branching ratio and in signal Monte Carlo.
In the analysis, Monte Carlo simulations were performed by assuming rather than the value of 37.7% Godfrey:2002rp used in the analysis. Moreover, slightly different values of for the signal Monte Carlo were used in the two analyses. The results of changing just or both and in the signal Monte Carlo were studied for the analysis. Several features were notable in this comparison.
(1) The maximum signal likelihoods in Monte Carlo were less for the choice of : (15.5,16.1) for MeV/ versus 17.3 for and MeV/. (2) For the same range, the values of in data were stable under variation of or input , while the extracted values of rose by about when was taken in the signal Monte Carlo. (3) When , the maximum signal likelihood in Monte Carlo still favored no suppression applied to the E1 photon, but to a lesser extent.
Because the variations in and observed under the above changes were ascribable to the signal fitting hypothesis rather than to the data themselves, they were included in estimates of systematic error, giving MeV/ and .
7. Asymmetric selection windows.
The mass windows were chosen symmetric about 2980 MeV/ in the analysis to avoid spectrum distortions if an E1 photon of the correct energy were paired with a random pion not associated with the transition . Slightly higher Monte Carlo significance (17.5 versus nominal 17.3) occurs with the asymmetric window 2955–3015 MeV/ (versus nominal 2945–3015 MeV/). On the other hand, the signal significance in data peaks for the asymmetric window 2945–3005 MeV/ at (versus 4.0 for the nominal window), and the value of obtained from the data is 0.4 MeV/ lower. This behavior is consistent with the lower masses observed in a recent analysis of radiative decays Athar:2004dn and in the exclusive analysis reported below.
B. Exclusive analysis
The signal Monte Carlo indicates that the reconstructed (or recoil) mass and width are mode dependent because of the different final decay particles. The value of calculated after kinematic fitting was required to be within 50 MeV/ of the nominal mass. Monte Carlo events indicate that this is more than 80% efficient. The width of the reconstructed mass distribution depends on both the detector resolution and the intrinsic width, . The latter has not been well measured Eidelman:2004wy ; etac , and the former is decay-mode dependent. Because the requirement that be within 50 MeV/ of its nominal value is loose, the systematic uncertainty of the efficiency due to this requirement is minimal, however. Measuring the ratio of branching ratios for cascade decay and direct radiative decay reduces this systematic uncertainty further. In addition to the other criteria in Table III, this analysis takes the pull mass limit for signal selection and suppression to be 3, and the reduced for kinematic constraints to be less than 10. The direct radiative decay is studied in the same decay modes, using similar event selection criteria except that the and signal selection criteria are dropped, and the yield is determined from the fit to the recoil mass spectrum.
VII. THE SIGNAL IN THE DATA
A. Inclusive analyses
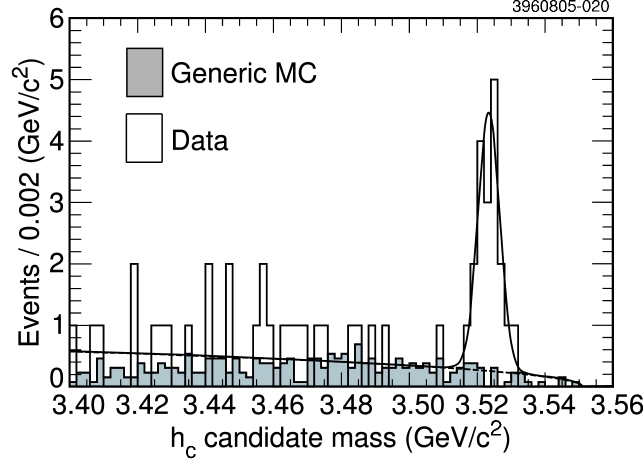
Figure 4 shows the spectrum of recoils against for the data in Table 2 with the event selection criteria determined to optimize the signal sensitivity in the analysis. These data were fitted with background as determined in Sec. VI plus a Breit-Wigner resonance of width 0.9 MeV. The background used was the recoil spectrum without the cut on . The peak shape consisted of the Breit-Wigner width convolved with an instrumental resolution function, determined from the signal Monte Carlo simulation, which itself was fitted with a double Gaussian. The efficiency for the final event selection was determined to be . The results are:

DATA
-
•
N(evts) = , significance =
-
•
MeV/
-
•
= (3.41.0).
When selecting a range of from Monte Carlo, choosing events in the interval 2945–3015 MeV/ gave the greatest signal significance, and hence this interval was used for further analysis. For the data the significance is slightly greater for a narrower range of , as shown in Table 9. The resulting mass spectrum is shown in Fig. 5. The results are:

-
•
N(evts) = , significance =
-
•
MeV/
-
•
.
The CLEO-III and CLEO-c data were fitted separately. Results are shown in Table 4 for the analysis and Table 10 for the analysis. The relative weights of the two samples [with values of differing by about 2 MeV/] differ between the two analyses, with the analysis finding fewer signal events in the CLEO-c sample while the analysis finds approximately equal signals in the CLEO III and CLEO-c samples. This accounts for the major part of the difference between values in the combined samples. No such difference was found in Monte Carlo simulations of CLEO-c data, indicating that the observed difference is purely statistical.
| range (MeV/) | |||||
| 2940–3020 | *2945–3015 | 2950–3010 | 2955–3005 | 2960–3000 | |
| 3525.670.85 | 3525.260.60 | 3525.080.55 | 3525.060.57 | 3524.970.58 | |
| Signif. | 3.24 | 4.03 | 4.27 | 4.22 | 3.97 |
| Data | Mass | Events | Branching |
|---|---|---|---|
| sample | (MeV/) | in peak | ratio () |
| CLEO-III | |||
| CLEO-c |
The angular distribution of the photon in the inclusive analysis was obtained by fitting separately the peak in the angular ranges , , and . The results are presented in Fig. 6. A distribution, as expected for an E1 transition from a spin 1 state, gives a satisfactory fit, with for 2 degrees of freedom. The angular distribution for the background, obtained in the same way as for the fit to the signal, corresponds to the dotted histogram in Fig. 4, and is flat as expected.

B. Exclusive analysis
There are several ways to search for an signal in exclusive modes. One may observe enhancements in the photon energy spectrum from , the reconstructed mass spectrum, or the recoil energy spectrum. The photon energy resolution is 2.1% to 3.8% for a photon of energy around 500 MeV, depending on whether it is in the barrel or endcap CsI calorimeter. The signal photon energy also has a spread because of the intrinsic width of . The reconstructed mass calculated from the 4-momenta of the and the transition photon also has poor resolution, and depends on decay modes. In the signal Monte Carlo, both the photon energy resolution and reconstructed mass resolution are larger than 15 MeV in all modes used. The recoil (from ) has much better energy resolution because of the mass constraint fit employed in the reconstruction algorithm, as mentioned previously. The spectrum recoiling against a is also independent of decay modes, so one can fit the signal with the same signal shape when signals from different modes are added together.
After all the selection criteria except for are imposed, there is a clear cluster of events in the plot of candidate mass versus recoil mass, shown in Fig. 7. Properties of the nineteen events in the band between the dotted lines and with between 3516 and 3530 MeV/ are summarized in Table 11.

| Mode | (MeV/) | |||
|---|---|---|---|---|
| (MeV/) | (MeV) | Reconstructed | Recoil | |
| 3524.3 | 475.0 | 3018.7 | 3012.0 | |
| 3529.3 | 496.4 | 2995.3 | 2991.9 | |
| 3521.7 | 513.4 | – | 2964.2 | |
| 3521.5 | 541.2 | – | 2930.8 | |
| 3517.7 | 463.2 | – | 3019.2 | |
| 3523.5 | 486.1 | – | 2998.3 | |
| 3525.0 | 499.9 | 2989.2 | 2983.4 | |
| 3524.3 | 474.5 | 2978.8 | 3012.7 | |
| 3526.7 | 507.1 | 2989.5 | 2976.8 | |
| 3527.2 | 494.1 | 2983.3 | 2992.6 | |
| 3520.4 | 475.9 | 2975.3 | 3007.1 | |
| 3523.0 | 471.6 | 2987.5 | 3014.8 | |
| 3530.9 | 523.0 | 2956.5 | 2962.0 | |
| 3519.2 | 498.7 | 2992.6 | 2979.0 | |
| 3519.8 | 463.2 | 3009.1 | 3021.3 | |
| 3524.0 | 473.8 | 3007.6 | 3013.2 | |
| 3524.8 | 517.5 | 2972.5 | 2962.4 | |
| 3525.4 | 497.7 | 2976.1 | 2986.5 | |
| 3521.1 | 414.4 | 3013.0 | 3078.8 | |
There is a highly populated band at the mass in Fig. 7. Monte Carlo studies indicate that most of these events are from and . When one soft photon from a of is missing, neither the beam energy constraint nor suppression can remove this background, but mass selection is powerful in rejecting such events. Once this selection is imposed, corresponding to the range MeV/ in Fig. 8, a clearer signal appears in the recoil mass spectrum around 3525 MeV/ (Fig. 10). The distribution was fitted using an unbinned maximum likelihood method and ARGUS background function to obtain the yield and the mass of the observed signal. The double Gaussian signal shape is obtained from signal Monte Carlo in which the dominant narrower Gaussian width is 3.2 MeV/. The unbinned maximum likelihood fit yields candidates with mass at MeV/. The significance of the signal calculated from the difference in the likelihood with and without the signal contribution is .
A clear signal also is observed in mass recoiling against the photon in the study of the radiative decay . This confirms the appropriateness and effectiveness of the event selection criteria. The recoil mass resolution is identical for all modes, and independent of track momentum resolution. The signal shape function, a Breit-Wigner function convolved with a double Gaussian, is obtained from signal Monte Carlo. The width of the Breit-Wigner function represents the intrinsic width. The detector resolution, represented by a double Gaussian, was obtained by fitting the distribution of the difference between the generated and reconstructed candidate masses.
A total of events in all seven modes was observed (Fig. 10). The ratio of the branching ratios for the cascade () and direct radiative () decays in each mode is shown in Table 12. To calculate the resulting event-weighted average ratio , one may write the observed number of decays via and the observed number via to an channel with respectively as
| (7) |
where and are efficiencies for mode for direct and cascade decays (Table 12). One then finds
| (8) |
where and .
| direct radiative decay | cascade decay | (cascade)/ | |||
| Mode | Eff(%) | Yield | Eff(%) | Yield | (direct) |
| 12.7 | 5.6 | 1.91.4 | 0.1160.090 | ||
| 32.6 | 74.012.0 | 15.3 | 3.12.1 | 0.0810.057 | |
| 24.9 | 10.36.9 | 10.8 | 2.81.7 | 0.6330.673 | |
| 35.6 | 46.0 12.0 | 15.1 | 7.32.8 | 0.2900.132 | |
| 24.2 | 21.66.4 | 10.9 | 0.91.0 | 0.0980.114 | |
| 30.6 | 23.76.9 | 14.8 | 0.0+1.0333We estimate the error of the yield to be 1 according to the Poisson distribution. | 0.000+0.083 | |
| 16.4 | 12.74.8 | 7.3 | 1.01.0 | 0.2050.225 | |
| Total | - | 22022 | - | 17.54.5 | 0.1780.049 |

VIII. SYSTEMATIC ERRORS
The systematic errors on and are summarized in Table 13. The following subsections describe how these errors were obtained in the individual analyses. When different approaches yield different results, the most conservative value is entered.
| , MeV/ | ||||
| Systematics in | Inclusive | Exclusive | Inclusive | Exclusive |
| Number of | N/A | N/A | 0.1 | N/A |
| N/A | N/A | N/A | 0.8 | |
| Background shape | 0.3 | 0.2 | 0.2 | 0.3 |
| energy scale | 0.2 | 0.2 | 0.1 | |
| Signal shape | 0.1 | 0.1 | 0.3 | 0.2 |
| width | 0.1 | 0.1 | 0.3 | 0.2 |
| efficiency | 0.2 | 0.3 | ||
| E1 Photon efficiency | 0.2 | 0.2 | ||
| Binning, fitting range | 0.1 | 0.1 | 0.3 | 0.2 |
| Modeling of decays | 0.1 | 0.3 | 0.3 | |
| mass | 0.1 | 0.2 | 0.1 | 0.1 |
| width | 0.2 | 0.1 | ||
| branching ratios | N/A | N/A | 0.1 | |
| Sum in quadrature | ||||
A. Inclusive analyses
1. Choice of background.
Final results in the analysis were obtained using the recoil background generated from the data. To estimate the systematic error due to choice of background, data were also fitted with a generic Monte Carlo background shape, yielding systematic uncertainties MeV/, . A similar value of was obtained in the analysis by replacing generic Monte Carlo background by a second order polynomial plus an ARGUS function. However, a slightly larger value of was seen both in data and in Monte Carlo. It is this value we quote in Table 13.
2. Photon energy calibration for energy scale.
The standard CLEO CsI calorimeter calibration was used. To determine if the uncertainty in this calibration can lead to systematic error in , the total deposited calorimeter energy was varied by amounts estimated by studies of radiative transitions in Athar:2004dn and found in data. The analysis procedure, including fitting, was then repeated with Monte Carlo data to check for dependence on absolute calibration of CC energy. The small effects found may be ascribed in part to the compensating effect of the demand that the two photons in the low-energy have the correct effective mass. We assign an error of MeV/ in to the energy scale on the basis of the arguments advanced in the subsection on the exclusive analysis.
3. Signal shape.
The systematic uncertainty due to uncertainty in the line shape was found by varying the Gaussian part of the signal shape by 10% to account for a possible mis-modeling (via Monte Carlo) of photon energy resolution to be MeV/ in , and in .
4. Choice of resonance width.
The systematic uncertainty due to variation of (0.5, 0.9, 1.5 MeV) was found to be 0.1 MeV/ in , and in . Variation of the Gaussian widths by led to negligible changes in mass and combined branching ratio.
5. Binning and fitting range.
In the analysis the systematic uncertainty due to fit using 1 MeV/ bins, instead of the usual 2 MeV/ bins, and changing the fitting range from 3496–3552 MeV/ to 3500–3540 MeV/ (see Table 4) was found to be MeV/ in , and in . The analysis chose 1 MeV/ bins to utilize the good resolution anticipated from Monte Carlo simulations. Results were compared with those from 2 MeV/ bins and agreed with those just quoted. For the fitting range 3505-3551.2 MeV/ in this analysis, however, in data rose by . This change was included as a systematic error associated with fitting.
6. Modeling of decays.
The signal Monte Carlo used in the analysis took 100% of decaying to to . An alternative signal Monte Carlo, in which 37.7% of were taken to decay to and the rest to three gluons was generated and used to redetermine efficiency. The resulting changed by . However, in the analysis, larger differences were observed in Monte Carlo simulations when comparing (nominal) and . The nominal choice gave about 10% higher efficiency since events of the form with or sometimes pass signal selection criteria. The systematic error of quoted in Table 13 reflects this larger value.
7. Selected range.
In the inclusive analysis, the 13 small Monte Carlo samples show that neither nor is very sensitive to the selected range in the intervals 2940–3020, 2945–3015, 2950–3010, 2955–3005, and 2960–3000 MeV/, leading to errors of MeV/ in and in .
8. Removal of “pull mass” requirement on signal .
Instead of requiring that the signal possess the best “pull mass” within , all two-photon combinations with within of the correct value were considered in the analysis. The maximum signal significance as measured by likelihood difference in Monte Carlo was reduced from (Table 5) to for the nominal range 2945–3015 MeV/. Although obtained in the data shifted by MeV/ from the nominal value, while the branching ratio shifted by from the nominal value, these shifts are within the statistical errors. No such shifts were detected in Monte Carlo simulations. Consequently, systematic errors were assigned to the effect of removing the pull mass requirement on the signal of less than MeV/ in and in .
9. Number of neutral pions in signal region.
Both inclusive analyses require that there be only one candidate yielding a recoil mass within 30 MeV/ of 3526 MeV/. The effect of relaxing this condition was noted. In all cases (independently of other selection choices), it led to Monte Carlo significances which decreased by 0.2–, a decrease of by about 0.1 MeV/ and by in data, but negligible changes in and in Monte Carlo. Systematic errors in and from this source were estimated to be less than MeV/ and , respectively.
10. Mass ranges for cascade suppression.
In the analysis, nominal mass ranges to suppress , , and cascades involve recoil masses differing from respectively by 8.4 MeV/ (), 32 MeV/ (), and 40 MeV/ (). These values were varied over the respective ranges 6.4–10.4, 22–42, and 30–50 MeV/. The maximum variations from each mode were then added in quadrature. Possible changes of MeV/ in and in were seen in data, but negligible changes occurred in Monte Carlo simulations. These sources were thus estimated to lead to systematic errors of MeV/ and .
11. Minimum energy requirements on photons.
In suppressing cascades, a minimum energy of 50 MeV was taken for photon daughters in the analysis. The result of reducing this energy to 40 MeV was a stronger suppression of both background and signal, leading to an upward shift of the mass by 0.2 MeV/ in data and no change in in data. Changes in mass and were negligible in Monte Carlo.
12. Correction for updated .
The analysis was based on the assumption of MeV/, the world average Hagiwara:2002fs before the measurement of Ref. Aulchenko:2003qq . With the present value of MeV/, a correction of MeV/ thus was applied to the final quoted mass in that analysis.
B. Exclusive analysis
Because the exclusive cascade rates were measured as ratios to the radiative decays, systematic uncertainties related to the final state cancel. The systematic studies dealt with estimating the statistical significance of the signal, the mass, and the production branching ratio.
In order to study the background contribution from the non- part of the data (continuum data), 22 pb-1 of continuum data (beam energy MeV) were analyzed in the same manner. The contribution of continuum data was found to be negligible.
The generic Monte Carlo sample was used to see if any of the known decays could produce a fake peak which would mimic the signal. No significant peak was seen in the signal region (8 bins in the recoil mass histogram, from 3516 to 3532 MeV/) with 39 million generic Monte Carlo events (13 times the data sample). This implies the signal seen in data is not due to a reflection of any known charmonium decays.
The significance can be estimated from the background level in the signal region using the generic Monte Carlo or data sideband. Using events from the likelihood values of the fit with and without the signal contribution, we obtain ; similar calculations with different mass ranges yield . Using events from the generic Monte Carlo sample, appropriately scaled so as to match event populations outside the signal region, we obtain an estimate of a mean background inside the signal window of events. Allowing for Poisson fluctuations of this number results in a probability that background completely accounts for the observed signal of 19 events of (). The binomial probability that the 47 data events in Fig. 10 and the 8 data events in the sideband, MeV/, of Fig. 8 fluctuate to be greater than the 19 events in the signal region, MeV/, of Fig. 10 is , which corresponds to a significance of . Estimates of signal significance are summarized in Table 14.
| Selection | Mass | (cascade)/ | Significance |
|---|---|---|---|
| (MeV/) | (direct) | ||
| Default cuts | 3523.60.9 | 0.1780.049 | 6.1 |
| Fit | +0.1 | 0.1920.056 | 6.2 |
| Fit | +0.5 | 0.1780.051 | 6.1 |
| Fit 15 | 0.0 | 0.1690.049 | 5.8 |
| Within 30 of mass | +0.7 | 0.1650.50 | 5.5 |
| Within 40 of mass | +0.2 | 0.1720.049 | 5.9 |
| Within 60 of mass | 0.0 | 0.1720.049 | 5.9 |
| Within 80 of mass | -0.1 | 0.1880.052 | 6.6 |
| Transition photon veto (2) | 0.0 | 0.1680.051 | 5.6 |
| Transition photon veto (4) | +0.2 | 0.1520.046 | 5.9 |
| Kinematic fitted | +0.4 | 0.1660.049 | 5.6 |
| CLEOIII only | +0.5 | 0.1580.069 | 3.9 |
| CLEOc only | -0.3 | 0.2160.083 | 4.7 |
The mass of is estimated from a recoil mass calculation. The systematic uncertainty associated with this estimate depends on the uncertainty of the energy scale, which is itself dependent on the energies of the photon daughters and their shower locations in the detector. Lower-energy photons and endcap photons have larger associated uncertainties. The fraction of endcap photons is small (10%), so the shower-location effect on energy resolution was ignored. The signal energy is around 160 MeV, and the corresponding daughter photon energies vary from 30 to 130 MeV, with respective uncertainties varying from 1.5% to 0.2%. By changing the photon energy uniformly by 1%, the energy in the signal Monte Carlo was found to shift only less than MeV because of the mass constraint in the analysis algorithm which fits neutral pions. Consequently, a 0.2 MeV systematic uncertainty in was ascribed to the energy scale.
The intrinsic width has not been accurately measured. In the exclusive signal Monte Carlo, it is set at 27 MeV. Because the efficiency for detecting is estimated from signal Monte Carlo and a range of is selected, an overestimate of will result in an underestimated efficiency. On the other hand, it will lead to a wider signal shape for the signal in and hence to an increased yield. Thus the systematic error on the measured ratio of rates for and is likely to be small because the two effects tend to cancel each other. A 2.3% systematic error was assigned to the ratio from the uncertainty in the intrinsic width.
The uncertainties in the decay branching ratios are large; no channel is known to better than 25%. Changing the branching ratio of each mode 40%, once per mode, the measured ratio was found to shift less than 1%. Consequently, a 1% systematic error on the ratio of rates was ascribed to decay branching ratios uncertainties.
In the analysis of the photon recoil mass from the direct radiative decay, the mass was fixed at MeV/. When this mass was floated in fitting, the value determined from the fit was MeV/. This result is lower than, but still consistent with, the CLEO inclusive photon transition study, in which the measured mass is Skwarnicki:2003wn . Varying the fixed value of the mass in the fit of the recoil mass distribution between 2970 and 2984 MeV/ resulted in a variation of 3.6% in the yield. Half of this value, 1.8%, was assigned to the systematic uncertainty of the combined branching ratio due to uncertainty in .
In the decay , the mass selection is based on the value obtained by reconstructing the . When the mass selection window is shifted by 10 MeV/, the measured value of shifts by less than 0.2 MeV/. We assign 0.2 MeV/ as the mass systematic uncertainty due to uncertainty in .
Neutral pion reconstruction efficiency has been studied in measurements of hadronic branching fractions. The discrepancy between Monte Carlo and data is less than 5% He:2005bs . We ascribe a 5% systematic uncertainty in the ratio of rates to efficiency uncertainty. This corresponds to an uncertainty in the product branching ratio of for the exclusive analysis and for the inclusive analysis (which finds a slightly smaller product branching ratio).
In the signal Monte Carlo for the exclusive analysis, was set to zero, so the signal shape obtained from Monte Carlo essentially represented detector resolution. Varying the assumed value of up to 1.5 MeV changed the measured mass by less than 0.1 MeV/ and the branching ratio by 3.9%. We also studied the effects of the signal shape by changing detector resolution by 20%. The background in the exclusive study is quite small, so the recoil mass fit range was chosen starting from 3400 MeV. The wider background range helped to fit the background shape better. Varying the starting point of the fit from 3.40 to 3480 MeV did not change the mass and branching ratio measurement much. First- and second-order polynomial background shapes were used to fit the background and to study the systematics. The mass change was 0.2 MeV/ and the rate change was 4.7%.
The limit in kinematically constrained fits, the selection of the range for , and the veto of E1 transition photon candidates forming a were found to be the most useful selection criteria in the exclusive study. Variation of these selection criteria within reasonable ranges did not change the corresponding mass and product branching ratios appreciably. The resolution in obtained using momentum after kinematic fits was slightly better than that from measured by 2–5%, depending on modes. Because different mass resolutions lead to difficulty in obtaining results and the possible gain in the mass measurement is small, momentum fitting was not used to obtain . Using the kinematically fitted mass yielded values of and production branching ratio consistent with nominal results.
IX. SUMMARY AND DISCUSSION
A. Inclusive analyses: Summary
Two inclusive analyses of CLEO data in search of yield an enhancement in the mass spectrum for recoils against attributed to the resonance of charmonium. When background is reduced by selecting a range of photon energies MeV, the parameters of the resonance are found to be
| (9) |
| (10) |
The significance of the resonance signal in this analysis, as determined by the likelihood method, is . When background is reduced by selecting a range of MeV/, to compensate for Doppler broadening of the photon in the transition arising from the recoil, one finds
| (11) |
| (12) |
The significance of the resonance signal is .
B. Exclusive analysis: Summary
The produced in the reaction was studied by reconstructing in seven modes (Table 1), leading to signal events. The significance as calculated from the difference in the likelihood with and without the signal contribution is , and at least as calculated by a variety of methods. The ratio of to was found to be
| (13) |
with
| (14) |
In CLEO III data, the branching ratio was measured to be Athar:2004dn , which when combined with previous measurements whose average is Eidelman:2004wy , gives . Combining this with Eq. (13), one obtains a production branching ratio of
| (15) |
where the last error reflects the measurement error of . The last two errors combine to give a total systematic error of .
C. Combination of results
The results of the two inclusive analyses, when averaged (taking the larger systematic and statistical errors in each analysis), yield MeV/ and . The average is taken because, as explained in the second-to-last paragraph of Sec. III, each inclusive analysis has its advantages and shortcomings, without a clear preference for one over the other. These results, which provide slightly more precise measurements of and , may be combined with the exclusive results, based on reconstructing the in seven exclusive decay modes with much lower background. We have confirmed the independence of the exclusive analysis from the inclusive analyses by removing the exclusive signal events from our inclusive sample. The results are indistinguishable from those of the original sample. We therefore combine them to obtain MeV/ and , as summarized in Table 15.
| Analysis | (MeV/) | (units of ) |
|---|---|---|
| Inclusive | ||
| Inclusive | ||
| Avg. Inclusive | ||
| Exclusive | ||
| Incl. + Excl. |
D. Discussion
The mass of the observed candidate is close to the spin-weighted average of the states, MeV/. This leads to MeV/, indicating little contribution of a long-range vector confining force or coupled-channel effects which could cause a displacement from this value. It is barely consistent with the (nonrelativistic) bound Stubbe:1991qw . The product of the branching ratios for its production, , and its decay, , is within the range anticipated theoretically.
ACKNOWLEDGMENTS
We gratefully acknowledge the effort of the CESR staff in providing us with excellent luminosity and running conditions. This work was supported by the National Science Foundation and the United States Department of Energy. J. Rosner wishes to thank M. Tigner for extending the hospitality of the Laboratory for Elementary-Particle Physics at Cornell during part of this work and the John Simon Guggenheim Foundation for partial support.
References
- (1) J. J. Aubert et al. [E598 Collaboration], Phys. Rev. Lett. 33, 1404 (1974).
- (2) J. E. Augustin et al. [SLAC-SP-017 Collaboration], Phys. Rev. Lett. 33, 1406 (1974).
- (3) T. Appelquist and H. D. Politzer, Phys. Rev. Lett. 34, 43 (1975); T. Appelquist, A. De Rujula, H. D. Politzer, and S. L. Glashow, Phys. Rev. Lett. 34, 365 (1975); E. Eichten, K. Gottfried, T. Kinoshita, J. B. Kogut, K. D. Lane, and T. M. Yan, Phys. Rev. Lett. 34, 369 (1975) [Erratum-ibid. 36, 1276 (1976)]; E. Eichten, K. Gottfried, T. Kinoshita, K. D. Lane, and T. M. Yan, Phys. Rev. D 21, 203 (1980); Phys. Rev. D 17, 3090 (1978) [Erratum-ibid. D 21, 313 (1980)].
- (4) V. A. Novikov, L. B. Okun, M. A. Shifman, A. I. Vainshtein, M. B. Voloshin and V. I. Zakharov, Phys. Rept. 41, 1 (1978); T. Appelquist, R. M. Barnett and K. D. Lane, Ann. Rev. Nucl. Part. Sci. 28, 387 (1978).
- (5) W. Kwong, J. L. Rosner, and C. Quigg, Ann. Rev. Nucl. Part. Sci. 37, 325 (1987).
- (6) C. Quigg, “Quarkonium: New developments,” presented at 18th Les Rencontres de Physique de la Vallee d’Aoste, La Thuile, Aosta Valley, Italy, Feb. 29 – Mar. 6, 2004, arXiv:hep-ph/0403187; C. Quigg, presented at 6th International Conference on Beauty, Charm, and Hyperons, Chicago, June 27 – July 2, 2004 (unpublished).
- (7) S. Eidelman et al. [Particle Data Group Collaboration], Phys. Lett. B 592, 1 (2004).
- (8) Here we take MeV/ based on CLEO measurements to be discussed subsequently. The average of measurements by the BaBar, Belle, and CLEO Collaborations is MeV/. See the review by K. K. Seth, hep-ex/0501022.
- (9) Y. J. Ng, J. T. Pantaleone, and S. H. H. Tye, Phys. Rev. Lett. 55, 916 (1985).
- (10) J. T. Pantaleone, S. H. H. Tye, and Y. J. Ng, Phys. Rev. D 33, 777 (1986).
- (11) S. Ono and F. Schöberl, Phys. Lett. B 118, 419 (1982); P. Moxhay and J. L. Rosner, Phys. Rev. D 28, 1132 (1983); R. McClary and N. Byers, Phys. Rev. D 28, 1692 (1983); H. Grotch, D. A. Owen, and K. J. Sebastian, Phys. Rev. D 30, 1924 (1984); S. Godfrey and N. Isgur, Phys. Rev. D 32, 189 (1985); S. N. Gupta, S. F. Radford, and W. W. Repko, Phys. Rev. D 34, 201 (1986); K. Igi and S. Ono, Phys. Rev. D 36, 1550 (1987); D. Lichtenberg, E. Predazzi, and R. Roncaglia, Phys. Rev. D 45, 3268 (1992); P. J. Franzini, Phys. Lett. B 296, 199 (1992); F. Halzen, C. Olson, M. G. Olsson, and M. L. Stong, Phys. Lett. B 283, 379 (1992); D. Ebert, R. N. Faustov, and V. O. Galkin, Phys. Rev. D 67, 014027 (2003); Mod. Phys. Lett. A 20, 1887 (2005).
- (12) G. P. Lepage and B. A. Thacker, Nucl. Phys. B Proc. Suppl. 4, 199 (1988); B. A. Thacker and G. P. Lepage, Phys. Rev. D 43, 196 (1991).
- (13) T. Manke et al. [CP-PACS Collaboration], Phys. Rev. D 62, 114508 (2000); M. Okamoto et al. [CP-PACS Collaboration], ibid. 65, 095408 (2002).
- (14) C. Baglin et al. [R704 Collaboration], Phys. Lett. B 171, 135 (1986).
- (15) T. A. Armstrong et al. [Fermilab E-760 Collaboration], Phys. Rev. Lett. 69, 2337 (1992).
- (16) D. Joffe, Ph. D. thesis, Northwestern University, 2004 (unpublished).
- (17) M. Andreotti et al. Fermilab E835 Collaboration], Phys. Rev. D 72, 032001 (2005).
- (18) G. Segre and J. Weyers, Phys. Lett. B 62, 91 (1976).
- (19) F. C. Porter [for the Crystal Ball Collaboration], in New Flavors: Proceedings (17th Rencontre de Moriond, Workshop on New Flavors, Les Arcs, France, 1982), edited by J. Tran Thanh Van and L. Montanet (Editions Frontières, Gif-sur-Yvette, France, 1982), p. 27; E. D. Bloom and C. Peck, Ann. Rev. Nucl. Part. Sci. 33, 143 (1983).
- (20) P. Ko, Phys. Rev. D 52, 1710 (1995).
- (21) Y. P. Kuang, Phys. Rev. D 65, 094024 (2002).
- (22) F. Renard, Phys. Lett. B 65, 157 (1976); V. A. Novikov et al., Phys. Reports 41, 1 (1978); R. McClary and N. Byers, Phys. Rev. D 28, 1692 (1983); Y. P. Kuang, S. F. Tuan, and T. M. Yan, Phys. Rev. D 37, 1210 (1988); V. O. Galkin, A. Y. Mishurov, and R. N. Faustov, Sov. J. Nucl. Phys. 51, 705 (1990) [Yad. Fiz. 51, 1101 (1990)]; G. T. Bodwin, E. Braaten, and G. P. Lepage, Phys. Rev. D 46, 1914 (1992); ibid. 51, 1125 (1995); K. T. Chao et al., Phys. Lett. B 301, 282 (1993); R. Casalbuoni et al., Phys. Lett. B 302, 95 (1993); P. Ko, Phys. Rev. D 47, 2837 (1993); S. N. Gupta, J. M. Johnson, W. W. Repko, and C. J. Suchyta III, Phys. Rev. D 49, 1551 (1994).
- (23) S. Godfrey and J. L. Rosner, Phys. Rev. D 66, 014012 (2002).
- (24) Y. Kubota et al. [CLEO Collaboration], Nucl. Instrum. Meth. A 320, 66 (1992).
- (25) G. Viehhauser [CLEO Collaboration], Nucl. Instrum. Meth. A 462, 146 (2001).
- (26) D. Peterson et al., Nucl. Instrum. Meth. A 478, 142 (2002).
- (27) M. Artuso et al., Nucl. Instrum. Meth. A 502, 91 (2003).
- (28) R. A. Briere et al., CLNS-01-1742.
- (29) V. M. Aulchenko et al. [KEDR Collaboration], Phys. Lett. B 573, 63 (2003).
- (30) The CLEO Collaboration reports MeV/ and MeV (CLEO II) or MeV (CLEO III): D. M. Asner et al. [CLEO Collaboration], Phys. Rev. Lett. 92, 142001 (2004). The BaBar Collaboration quotes MeV: B. Aubert et al., Phys. Rev. Lett. 92, 142002 (2004).
- (31) S. B. Athar et al. [CLEO Collaboration], Phys. Rev. D 70, 112002 (2004).
- (32) N. E. Adam [CLEO Collaboration], Phys. Rev. Lett. 94, 232002 (2005).
- (33) H. Albrecht et al. [ARGUS Collaboration], Phys. Lett. B 241, 278 (1990).
- (34) D. J. Lange, Nucl. Instrum. Methods Phys. Res., Sect. A 462, 152 (2001).
- (35) T. Sjöstrand et al., Comp. Phys. Comm. 135 (2001) 238; for more details see T. Sjöstrand, L. Lönnblad and S. Mrenna, PYTHIA 6.2 Physics and Manual, hep–ph/0108264.
- (36) R. Brun et al., GEANT 3.21, CERN Program Library Long Writeup W5013 (1993), unpublished.
- (37) K. Hagiwara et al. [Particle Data Group], Phys. Rev. D 66, 010001 (2002).
- (38) T. Skwarnicki, Int. J. Mod. Phys. A 19, 1030 (2004).
- (39) Q. He et al. [CLEO Collaboration], Phys. Rev. Lett 95, 121801 (2005).
- (40) J. Stubbe and A. Martin, Phys. Lett. B 271, 208 (1991).