Measurements of the Absolute Branching Ratios for the Dominant Decays, the Lifetime, and with the KLOE Detector
Abstract
From a sample of about mesons produced at DAΦNE, we have selected mesons tagged by observing decays. We present results on the major branching ratios, including those of the semileptonic decays needed for the determination of . These branching ratio measurements are fully inclusive with respect to final-state radiation. The lifetime has also been measured.
, , , , , , , , , , , , , , , , , , , , , , , , , , , , , , , , , , , , , , , , , , , , , , , , , , , , , , , , , , , , , , , , , , , , , , , , , , , , , , , , , , , , , ,
1 Corresponding author: Mario Antonelli INFN - LNF, Casella postale 13, 00044 Frascati (Roma), Italy; tel. +39-06-94032728, e-mail Mario.Antonelli@lnf.infn.it
1 Introduction
We have measured the absolute branching ratios (BR’s) for decays to , , , and , as well as the lifetime of the meson. The branching ratios and lifetime are necessary for the determination of the partial rates for semileptonic decays, from which the CKM matrix element can be obtained. Absolute branching ratios are not usually measured. The PDG derives the BR’s from a “fit” to ratios of partial widths [1], giving errors in the 0.5–2% range. Recently, KTeV [2], measuring a complete set of such ratios and requiring that all BR’s sum to unity, has obtained new BR values in strong disagreement with the PDG values. The NA48 value for BR() [3] essentially agrees with that from KTeV, though the NA48 measurement is sensitive to and in fact makes use of the KTeV value for the latter, averaged with older measurements.
Measurements of the absolute branching ratios are a unique possibility of the factory, where kaons are produced in decays. A pure sample of nearly monochromatic111 mesons at DAΦNE are produced with MeV/, toward the ring’s center. ’s can be selected by identification of decays (tagging). The absolute branching ratios can be determined by counting the fraction of ’s that decay into each channel and correcting for acceptances, reconstruction efficiencies, and background. In addition, the count of all decays in a time interval gives the lifetime with a fractional error equal to 1/, independently of the value of . In this work, we use a slightly different approach. We begin by assuming the lifetime to be known and equal to the PDG value, and measure the number of decays in each of the major channels to obtain the corresponding BR’s. We then observe that the sum of the BR’s differs slightly from one. Renormalizing the sum to one, we find the correct lifetime and BR values.
2 Tagging uncertainties
The efficiency for identification of the tagging decay depends slightly on the fate of the : it is different for events in which the decays to each channel, interacts in the calorimeter, or escapes the detector. We define the tag bias for the detection of decays to a state as the ratio of the tagging efficiency, , for events in which within the fiducial volume (FV) to the overall tagging efficiency, , determined without regard to the fate of the . The tag bias for channel is thus , and
| (1) |
where is the number of decays to , is the number of tagged ’s, is the fraction of decays in the FV, and is the reconstruction efficiency. Losses of ’s from interactions in the beam pipe, chamber walls, and chamber gas are taken into account in the evaluation of .
We use a FV within the chamber defined by cm and cm, where are the coordinates of the decay vertex.222The -axis coincides with the bisectrix of the two beams. The mean decay length in KLOE is 340 cm and 26.1% of the ’s decay in the FV. The dependence of the FV efficiency on the lifetime is
| (2) |
for values of around 50 ns (here, refers to the FV efficiency calculated using ns).
3 The KLOE detector
The KLOE detector consists of a large cylindrical drift chamber (DC), surrounded by a lead/scintillating-fiber electromagnetic calorimeter (EMC). A superconducting coil around the calorimeter provides a 0.52 T field. The drift chamber [4] is 4 m in diameter and 3.3 m long. The momentum resolution is . Two-track vertices are reconstructed with a spatial resolution of 3 mm. The calorimeter [5] is divided into a barrel and two endcaps. It covers 98% of the solid angle. Cells close in time and space are grouped into calorimeter clusters. The energy and time resolutions are and , respectively. The KLOE trigger [6] uses calorimeter and chamber information. For this analysis, only the calorimeter signals are used. Two energy deposits above threshold ( MeV for the barrel and MeV for the endcaps) are required. Recognition and rejection of cosmic-ray events is also performed at the trigger level. Events with two energy deposits above a 30 MeV threshold in the outermost calorimeter plane are rejected.
4 Data and Monte Carlo samples
For the present measurements, we use a subset of the data collected by KLOE at DAΦNE during the years 2001 and 2002 that satisfies basic quality criteria [7]. The data used corresponds to an integrated luminosity of 328 pb-1.
Each run used in the analysis is simulated with the KLOE Monte Carlo (MC) program, GEANFI [8], using values of relevant machine parameters such as and as determined from data. Machine background obtained from the data is superimposed on MC events on a run-by-run basis. The number of events simulated for each run in the data set is equivalent to that expected on the basis of the run luminosity. For this analysis, we use an MC sample consisting of events in which the and decay in accordance with their natural branching ratios. The effects of initial- and final-state radiation are included in the simulation. The treatment of final-state radiation in and decays is discussed in Ref. 9. In particular, the fraction of events produced by the generator for various cutoff values for the energy and angle of the radiated photon compares well with the results of Ref. 10.
Good runs, and the corresponding MC data, are organized into 14 periods. The branching ratio analysis is performed independently for each of these periods. Averages over the 14 periods give the final results. One-fourth of the data is used to compute various corrections; the remainder is used for for the evaluation of the branching ratios. This choice minimizes the total uncertainty.
5 tag by
decays are identified by two tracks of opposite curvature from a vertex in a cylindrical FV with cm and cm, centered on the collision region as determined for each run using Bhabha events. We also require that the two tracks give MeV/ and that 10 MeV/, with calculated from the kinematics of the decay. If more than one vertex is found within the FV, that closest to the nominal position of the IP is used. The momentum, , is obtained from the direction and . The resolution is 0.8 MeV/ and is dominated by the beam-energy spread. The position of the production point, , is taken as the point of closest approach of the direction to the beam line. The line of flight is then constructed from the momentum, , and the position of the production vertex, .
The tag bias is mostly due to the dependence of the calorimeter trigger efficiency on the behavior of the and is estimated by MC to vary from 0.99 to 1.06 for decays to charged particles and to . However, poor knowledge of the cross section for interactions in the calorimeter limits the accuracy of the simulation. To decrease tag-bias effects, we require that the by itself satisfy the calorimeter trigger. This is accomplished by requiring that there be two clusters associated to the tracks from the decay. The clusters must be in fired trigger sectors in the calorimeter barrel, and must have energies above a 100 MeV threshold. Tag bias is also introduced by the dependence of the reconstruction efficiency on the presence of other tracks in the chamber (“track reconstruction interference”). Symmetric decays produce less interference and so we require MeV/ for decays. After imposing these requirements, we are left with a tagging efficiency of about 9%. The tag bias for decays to charged particles is about 0.97 and for decays to about 1.00.
The MC estimate of the tagging efficiency is corrected using data. has been corrected by about % to account for the effect of the cosmic-ray veto in the trigger, where this correction is obtained from a downscaled sample of events for which the veto was not enforced. An additional correction of about % accounts for a small data-MC disagreement in the effect of track reconstruction interference. These corrections are run-period dependent.
6 decays into charged particles
All tracks in the chamber, after removal of those from the decay and their descendants, are extrapolated to their points of closest approach to the line of flight of the , . The distance of closest approach, , the momentum of the track at , and the extrapolation length are then computed. For each sign of charge, we consider the track with the smallest value of to be associated to the decay. Candidate tracks from decays must satisfy , with and cm, and cm cm.
For the selection of decays into charged particles, we require two good (i.e., satisfying the above criteria) decay tracks of opposite sign of charge. To improve the reconstruction, we then apply a vertex-reconstruction algorithm. The average efficiency for complete reconstruction is 54% for , 52% for , and 38% for , as evaluated from MC simulation. These efficiencies are then corrected as described in the following; the corrections range between 0.99 and 1.03 depending on the channel and on the run period.
The vertex efficiency is about 97%, and the values obtained from the MC are in agreement with those for data within 0.1%. The tracking efficiency is determined by counting the number of events in which there is a decay track of at least one sign and the number of events in which there are two decay tracks of opposite sign. The data-MC difference in the single-to-double ratio is then used to correct the MC estimate for the tracking efficiency. This correction is evaluated as function of the track momentum using and events.
To select events, we require at least one good decay track and two photons from a decay. To reject background, cuts are applied on the two-photon invariant mass and on the times of flight of the photons [7]. The momentum of one decay track is calculated with a resolution of about 10 MeV/ using the two photons from the decay and the momentum of the other decay track. In order to obtain the correction for higher momentum tracks (above 150 MeV/), decays are used. decays are selected by identifying the electrons by time of flight with a purity of 95%. The remaining background is due mostly to decays. The momentum of the second track is evaluated from the missing energy with a resolution of about 30 MeV/. The comparison of the tracking efficiency obtained from events and that obtained from events shows good agreement in the overlap region, MeV/, as seen from Fig. 1.


Because the expected momentum is determined with better precision in events at low momentum, for momenta smaller than 150 MeV/, we use the correction obtained from this sample, while for momenta greater than 150 MeV/, we use the correction obtained from events.
MC studies have shown that the best discriminant amongst the decay modes into charged particles is the smaller absolute value of the two possible values of , where and are the missing momentum and energy at the vertex, evaluated by assigning one track the pion mass and one track the muon mass. The shape of the spectrum is very sensitive to the radiative corrections to decay processes. This is particularly evident for decays (see Fig. 3).
The numbers of , , and events, fully inclusive with respect to final-state radiation, are obtained from fits to the distributions with a linear combination of MC distributions. An example of such a fit is shown in Fig. 2.
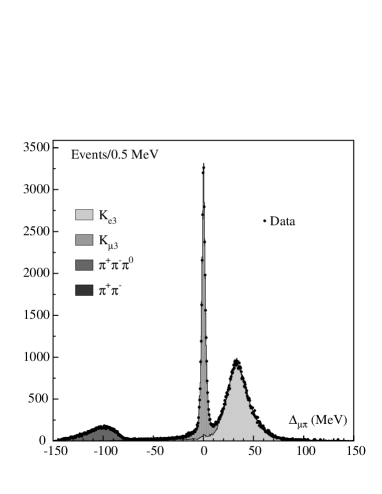

The residual background consists of of decays, decays with , regeneration, and production from -nuclear interactions. The total amount of background is about 0.5%.
In the MC, the momentum resolution is slightly better than it is for data. As described in Ref. [7], reconstructed track momenta for MC events are slightly smeared to obtain better agreement with data.
7 decays
The position of the vertex for decays is obtained from the arrival times of the photons at the calorimeter. The method is fully described in Refs. 5 and 8. The position of the vertex is assumed to be along the line of flight as reconstructed from the tagging decay. The arrival time of each photon gives an independent determination of the path length, , up to a two-fold ambiguity. One solution is easily discarded. The final value of is obtained from the weighted average of the different measurements. The accuracy of the method is checked using decays, by comparing the position of the decay vertex from the reconstruction of the tracks from the pair with the position obtained from photon arrrival-time measurements. Decays to are also used to measure the single-photon efficiency, for both data and MC.
For the selection of events, we require at least three photons with MeV originating from the decay point. The background contamination, which is concentrated in the three- and four-photon event samples, is dominated by events with additional clusters due to machine background.
Additional cuts are therefore made for events with three and four photons. First, we require that at least one of the photons have MeV. We then select the pair of clusters with the smallest separation, and reject events which satisfy and , where is the energy of the lower-energy cluster and is the polar angle of the mean position of the pair of clusters. These cuts are effective at reducing the contamination from events in which an extra cluster is present due to machine background. Moreover, the RMS pull of the individual measurements about the weighted-average value is required to be smaller than 1.2 in events with three photons. Finally, tracks from decays of the into charged secondaries are found to have comparatively high values of , the magnitude of the track momentum in the rest frame of the . We therefore reject three-photon events in which , where is the sum of the photon energies. This cut eliminates background from decays into charged particles without incurring inefficiencies in the presence of tracks from machine background, photon conversions, or unassociated track segments from the decay.
After making these selection cuts, we obtain the results listed in Table 1 for the photon multiplicity distribution for vertices in the fiducial volume. The distributions for data and MC agree at the 0.5% level.
| , data | dataMC | |
|---|---|---|
| 3 | ||
| 4 | ||
| 5 | ||
| 6 | ||
| 7 |
The reconstruction efficiency and the purity have been evaluated for each of the 14 data-taking periods. Their average values are and , respectively.
8 Systematic uncertainties
The systematic uncertainties on the absolute BR measurements are summarized in Table 2 for each decay mode. Correlations among channels are taken into account, and the complete information is contained in the error matrix [7].
| Tag bias | 0.0036 | 0.0034 | 0.0029 | 0.0058 |
|---|---|---|---|---|
| 0.0058 | 0.0058 | 0.0058 | 0.0058 | |
| Selection efficiencies | 0.0028 | 0.0026 | 0.0100 | 0.0032 |
| Kinematic shape | 0.0015 | 0.0033 | - | 0.0079 |
The systematic error on the evaluation of the tag bias is taken from the uncertainties on the individual corrections and from the study of the stability of the results obtained with different tagging criteria. The values of the cuts used to define the tag have been varied over a wide range. In total, we have studied the stablity of the result for 15 different tag configurations. In this study, the tagging efficiency changes by 50% with respect to the tagging efficiency obtained with the default tag. Corresponding fractional changes on the branching ratios of 0.25% to 0.56% are observed depending on the channel (see Table 2, line 1). We have also determined the tag bias with the requirement that the pions from be associated to calorimeter clusters in unoccupied trigger sectors. The fractional change in the result with respect to that obtained in the default configuration is smaller than 0.05%. Finally, a further 0.15% systematic uncertainty that is fully correlated between decay modes arises from the uncertainty on the correction for the track reconstruction interference effect. The effects of the limited knowledge of the lifetime and the nuclear interaction cross section are found to be negligible.
The main sources of uncertainty on the evaluation of the fiducial-volume efficiency are the limited knowledge of the -nuclear interaction cross section and the accuracy of the lifetime value. The uncertainty on the fiducial-volume efficiency obviously affects the BR measurements for all channels in the same way and its contribution cancels out if the sum of the branching ratios is constrained to unity. The 0.85% current accuracy on the lifetime [1] leads to a 0.56% uncertainty on the absolute BR measurements (Table 2, line 2). The beam loss due to nuclear interactions in the beam pipe and inner DC wall is estimated with the MC and corrected using data, as described in Ref. 7. The corrections are determined with an uncertainty of about 30%, both for regeneration and for production, resulting in a 0.15% relative contribution to the uncertainty on the fiducial-volume efficiency.
The uncertainty on the tracking efficiency correction is determined from sample statistics and by the variation of the results observed using different criteria to identify good tracks from decays. The fractional statistical uncertainty amounts to about 0.1% for and decays, and to about 0.3% for decays. The effect of differences in the resolution with which the variables and (Sec. 6) are reconstructed in data and in MC events and the possible bias introduced in the selection of the control sample have been studied by varying the values of the cuts made when associating tracks to vertices. These changes result in a variation of the tracking efficiency of about 20%. Corresponding fractional changes of the branching ratios of 0.26% to 0.32% are observed, depending on the channel (Table 2, line 3).
To assess the uncertainty on the BR measurements arising from limited knowledge of the momentum resolution and of the accuracy of the simulation of final-state radiation, we have examined the agreement between the distributions for data and MC using - and -enriched samples selected via electron identification with the calorimeter [7]. The comparisons are shown in Fig. 3 (, left, and , right).
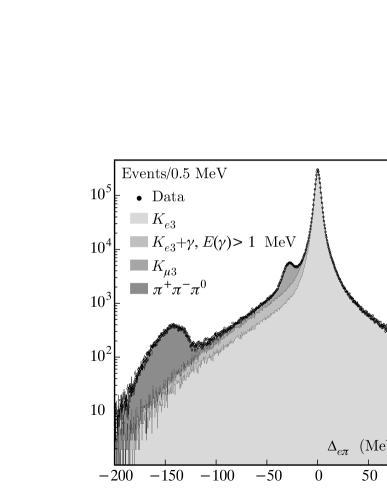
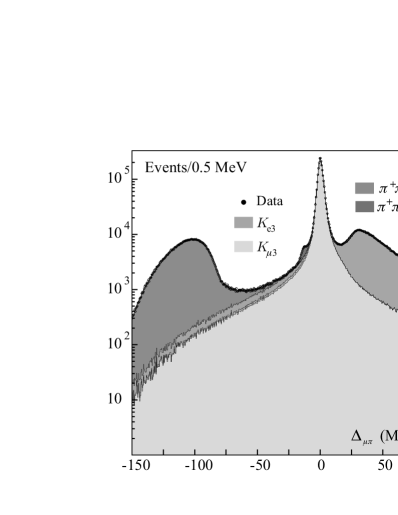
The uncertainties have been estimated by studying the change in the results for the BR’s with and without shape corrections obtained from the data-MC ratios of the distributions of for the control samples, and by repeating the measurement using different mass hypotheses. In all, five configurations have been studied: no shape corrections, shape corrections for all modes, shape corrections only for , shape corrections only for , use of the alternative mass hypothesis. Fractional variations of 0.15%, 0.3%, and 0.8% are observed for the , , and BR’s (Table 2, line 4).
The systematic uncertainty on the selection efficiency for decays includes the uncertainties in the photon-efficiency corrections, the effects of the cluster-splitting recovery algorithm, and the level of background from nuclear interactions. These uncertainties have been evaluated by checking the stability of the measured value of the BR with respect to modifications in the selection criteria. The largest deviation occurs if the minimum number of photons required at the vertex is rasied from three to five. This cut reduces the background contamination to about 0.1% while maintaining a signal efficiency of 88%. Requiring changes the result by 1%. This variation has been conservatively taken as the systematic error on the measurement of BR() (Table 2, line 3). The stability of the result for harder photon-energy thresholds has also been studied. The BR is stable to within 0.3% when the energy threshold for single photons is raised from 20 MeV to 50 MeV.
9 Results and determination of
9.1 Absolute branching ratios
A total of about tagged events are used for the measurement of the branching ratios. The absolute branching ratios are obtained separately for each of the 14 run periods. Good stability of the results is observed once the efficiency corrections for each run period are applied. We first use the value of the lifetime ns [11] to evaluate the fiducial-volume efficiency. The values for the absolute branching ratios obtained from the averages over all run periods are given in Table 3.
| Mode | BR | stat | syst-stat | syst | corr-syst |
|---|---|---|---|---|---|
| 0.4049 | 0.0006 | 0.0008 | 0.0018 | 0.0025 | |
| 0.2726 | 0.0006 | 0.0006 | 0.0014 | 0.0017 | |
| 0.2018 | 0.0003 | 0.0004 | 0.0023 | 0.0012 | |
| 0.1276 | 0.0004 | 0.0004 | 0.0014 | 0.0008 |
For decays into charged particles, the statistical errors above are obtained from the fit and include a contribution from MC statistics which is about equal to that from the signal statistics. The systematic-statistical error reflects the statistical uncertainties in the determination of the various corrections. The correlated-systematic error reflects all contributions to the errors on the BR’s that are 100% correlated for all channels, such as the uncertainty in the value of the lifetime. The sum of the four BR’s above, plus the sum of the PDG values for decays to , , and () [1], is .
9.2 branching ratios and lifetime
The correct value of the lifetime is the value for which the sum above is unity. We find
| (3) |
in agreement with the recent direct measurement obtained by KLOE using a high-statistics sample of decays [12]. By renormalizing the sum of the measured BR’s to , we finally obtain the results in Table 4.
| Mode | BR | stat | syst-stat | syst |
|---|---|---|---|---|
| 0.4007 | 0.0005 | 0.0004 | 0.0014 | |
| 0.2698 | 0.0005 | 0.0004 | 0.0014 | |
| 0.1997 | 0.0003 | 0.0004 | 0.0019 | |
| 0.1263 | 0.0004 | 0.0003 | 0.0011 |
After normalization, the complete correlation matrix is:
where the columns and rows refer, in order, to the errors on the BR’s for decays to , , , and , and to the error on .
The ratio )/) can be computed from the value of the form-factor slope . From our measurements above, we obtain to be compared with the value calculated using the average of the measurements of from KTeV [13] and ISTRA+ [14]. The ratio can be estimated from the isospin amplitudes obtained from branching ratios and Dalitz-plot slopes for decays. We find
to be compared with the result of Ref. 15, .
9.3 Determination of
Measurements of and provide the most precise test of the unitarity of the CKM mixing matrix, as contributes only at the level of 10-5. The inclusive semileptonic decay rates for and are given by
| (4) |
where stands for or , and the numerical factor in parentheses is chosen so that the phase space integral is unity when all final state particles are massless and there is no dependence of the form factor. The partial widths are given by BR. For , we use the average of the value from Eq. (3), ns, and our direct measurement [12], ns. These two measurements are uncorrelated; their average is
| (5) |
Furthermore, in Eq. (4), [16] is the short-range radiative correction factor, 1.022, is the normalization of the vector (and scalar) form factor at for , and is the remaining, mode-dependent, long-range electromagnetic correction, [9]. The phase space integral is a function of the form factor parameters , , and .
We use the values , , and , obtained from a combined fit to and results from KTeV [13] and ISTRA+[14, 17], weighting the errors as .We obtain:
with an average
taking correlations into account that mostly arise from the fact that the same lifetime value enters into the expression for the partial width for each channel. A precise estimate of , , was first given in 1984 [18]. Very recently, lattice calculations [19] have given the value , in excellent agreement with that from Ref. 18. Using the value from Ref. 18, we find:
This result can be compared with the value 0.22650.0021 obtained from unitarity if [20].
Conclusions
We have obtained new, precise values of the dominant branching ratios and of the lifetime. Our values for the branching ratios are fully inclusive of final-state radiation. Results for the value of the product show that the violation of unitarity in the first row of the CKM matrix suggested by the value for in the PDG listings [1] does not exist. We eagerly await improved estimates of the value of the form factor at . Better knowledge of the form factor parameters would also be welcome.
References
- [1] Particle Data Group, S. Eidelman, et al., Phys. Lett. B 592 (2004) 1.
- [2] KTeV Collaboration, T. Alexopolous, et al., Phys. Rev. D 70 (2004) 092006.
- [3] NA48 Collaboration, A. Lai, et al., Phys. Lett. B 602 (2004) 41.
- [4] M. Adinolfi, et al., The tracking detector of the KLOE experiment, Nucl. Instrum. Meth. A 488 (2002) 51.
- [5] M. Adinolfi, et al., The KLOE electromagnetic calorimeter, Nucl. Instrum. Meth. A 482 (2002) 364.
- [6] M. Adinolfi, et al., The trigger system of the KLOE experiment, Nucl. Instrum. Meth. A 492 (2002) 134.
-
[7]
M. Antonelli, et al., Measurements of the absolute branching ratios for
dominant decays, the lifetime, and with the KLOE
detector, KLOE Note 204 (2005).
URL http://www.lnf.infn.it/kloe/pub/knote/kn204.ps - [8] F. Ambrosino, et al., Data handling, reconstruction, and simulation for the KLOE experiment, Nucl. Instrum. Meth. A 534 (2004) 403.
- [9] C. Gatti, Monte Carlo simulation for radiative kaon decays, hep-ph/0507280, submitted to Eur. Phys. J. C (2005).
- [10] T. Andre, Radiative corrections in decays, hep-ph/0406006, submitted to Phys. Rev. D (2004).
- [11] K. G. Vosburgh, et al., Phys. Rev. D 6 (1972) 1834.
- [12] KLOE Collaboration, Measurement of the meson lifetime with the KLOE detector, hep-ex/0507088, submitted to Phys. Lett. B (2005).
- [13] KTeV Collaboration, T. Alexopolous, et al., Phys. Rev. Lett. 93 (2004) 181802.
- [14] O. P. Yushchenko, et al., Phys. Lett. B 581 (2004) 31.
- [15] J. Bijnens, F. Borg, Eur. Phys. J. C 40 (2005) 383.
- [16] A. Sirlin, Nucl. Phys. B 196 (1982) 83.
- [17] O. P. Yushchenko, et al., Phys. Lett. B 589 (2004) 111.
- [18] H. Leutwyler, M. Roos, Z. Phys. C 25 (1984) 91.
- [19] D. Becirevic, et al., Nucl. Phys. B 705 (2005) 339.
- [20] A. Czarnecki, W. J. Marciano, A. Sirlin, Phys. Rev. D 70 (2004) 093006.