CERN–EP-PH/2004-072
10 December 2004
DELPHI Collaboration
Abstract
Bose-Einstein correlations (BEC) between final state particles in the reaction have been studied. Data corresponding to a total integrated luminosity of 550 pb-1, recorded by the DELPHI detector at centre-of-mass energies ranging from 189 to 209 GeV, were analysed. An indication for inter-W BEC between like-sign particles has been found at the level of 2.4 standard deviations of the combined statistical and systematic uncertainties.
This paper is dedicated to the late Frans Verbeure. Frans was a very active member of the DELPHI collaboration and its QCD and WW working groups. The loss of Frans touched us all deeply.
(Accepted by Euro. Phys. Jour.)
J.Abdallah,
P.Abreu,
W.Adam,
P.Adzic,
Z.Albrecht,
T.Alderweireld,
R.Alemany-Fernandez,
T.Allmendinger,
P.P.Allport,
U.Amaldi,
N.Amapane,
S.Amato,
E.Anashkin,
A.Andreazza,
S.Andringa,
N.Anjos,
P.Antilogus,
W-D.Apel,
Y.Arnoud,
S.Ask,
B.Asman,
J.E.Augustin,
A.Augustinus,
P.Baillon,
A.Ballestrero,
P.Bambade,
R.Barbier,
D.Bardin,
G.Barker,
A.Baroncelli,
M.Battaglia,
M.Baubillier,
K-H.Becks,
M.Begalli,
A.Behrmann,
E.Ben-Haim,
N.Benekos,
A.Benvenuti,
C.Berat,
M.Berggren,
L.Berntzon,
D.Bertrand,
M.Besancon,
N.Besson,
D.Bloch,
M.Blom,
M.Bluj,
M.Bonesini,
M.Boonekamp,
P.S.L.Booth,
G.Borisov,
O.Botner,
B.Bouquet,
T.J.V.Bowcock,
I.Boyko,
M.Bracko,
R.Brenner,
E.Brodet,
P.Bruckman,
J.M.Brunet,
P.Buschmann,
M.Calvi,
T.Camporesi,
V.Canale,
F.Carena,
N.Castro,
F.Cavallo,
M.Chapkin,
Ph.Charpentier,
P.Checchia,
R.Chierici,
P.Chliapnikov,
J.Chudoba,
S.U.Chung,
K.Cieslik,
P.Collins,
R.Contri,
G.Cosme,
F.Cossutti,
M.J.Costa,
D.Crennell,
J.Cuevas,
J.D’Hondt,
J.Dalmau,
T.da Silva,
W.Da Silva,
G.Della Ricca,
A.De Angelis,
W.De Boer,
C.De Clercq,
B.De Lotto,
N.De Maria,
A.De Min,
L.de Paula,
L.Di Ciaccio,
A.Di Simone,
K.Doroba,
J.Drees,
M.Dris,
G.Eigen,
T.Ekelof,
M.Ellert,
M.Elsing,
M.C.Espirito Santo,
G.Fanourakis,
D.Fassouliotis,
M.Feindt,
J.Fernandez,
A.Ferrer,
F.Ferro,
U.Flagmeyer,
H.Foeth,
E.Fokitis,
F.Fulda-Quenzer,
J.Fuster,
M.Gandelman,
C.Garcia,
Ph.Gavillet,
E.Gazis,
R.Gokieli,
B.Golob,
G.Gomez-Ceballos,
P.Goncalves,
E.Graziani,
G.Grosdidier,
K.Grzelak,
J.Guy,
C.Haag,
A.Hallgren,
K.Hamacher,
K.Hamilton,
S.Haug,
F.Hauler,
V.Hedberg,
M.Hennecke,
H.Herr,
J.Hoffman,
S-O.Holmgren,
P.J.Holt,
M.A.Houlden,
K.Hultqvist,
J.N.Jackson,
G.Jarlskog,
P.Jarry,
D.Jeans,
E.K.Johansson,
P.D.Johansson,
P.Jonsson,
C.Joram,
L.Jungermann,
F.Kapusta,
S.Katsanevas,
E.Katsoufis,
G.Kernel,
B.P.Kersevan,
U.Kerzel,
A.Kiiskinen,
B.T.King,
N.J.Kjaer,
P.Kluit,
P.Kokkinias,
C.Kourkoumelis,
O.Kouznetsov,
Z.Krumstein,
M.Kucharczyk,
J.Lamsa,
G.Leder,
F.Ledroit,
L.Leinonen,
R.Leitner,
J.Lemonne,
V.Lepeltier,
T.Lesiak,
W.Liebig,
D.Liko,
A.Lipniacka,
J.H.Lopes,
J.M.Lopez,
D.Loukas,
P.Lutz,
L.Lyons,
J.MacNaughton,
A.Malek,
S.Maltezos,
F.Mandl,
J.Marco,
R.Marco,
B.Marechal,
M.Margoni,
J-C.Marin,
C.Mariotti,
A.Markou,
C.Martinez-Rivero,
J.Masik,
N.Mastroyiannopoulos,
F.Matorras,
C.Matteuzzi,
F.Mazzucato,
M.Mazzucato,
R.Mc Nulty,
C.Meroni,
Z. Metreveli,
E.Migliore,
W.Mitaroff,
U.Mjoernmark,
T.Moa,
M.Moch,
K.Moenig,
R.Monge,
J.Montenegro,
D.Moraes,
S.Moreno,
P.Morettini,
U.Mueller,
K.Muenich,
M.Mulders,
L.Mundim,
W.Murray,
B.Muryn,
G.Myatt,
T.Myklebust,
M.Nassiakou,
F.Navarria,
K.Nawrocki,
R.Nicolaidou,
M.Nikolenko,
A.Oblakowska-Mucha,
V.Obraztsov,
A.Olshevski,
A.Onofre,
R.Orava,
K.Osterberg,
A.Ouraou,
A.Oyanguren,
M.Paganoni,
S.Paiano,
J.P.Palacios,
H.Palka,
Th.D.Papadopoulou,
L.Pape,
C.Parkes,
F.Parodi,
U.Parzefall,
A.Passeri,
O.Passon,
L.Peralta,
V.Perepelitsa,
A.Perrotta,
A.Petrolini,
J.Piedra,
L.Pieri,
F.Pierre,
M.Pimenta,
E.Piotto,
T.Podobnik,
V.Poireau,
M.E.Pol,
G.Polok,
V.Pozdniakov,
N.Pukhaeva,
A.Pullia,
J.Rames,
L.Ramler,
A.Read,
P.Rebecchi,
J.Rehn,
D.Reid,
R.Reinhardt,
P.Renton,
F.Richard,
J.Ridky,
M.Rivero,
D.Rodriguez,
A.Romero,
P.Ronchese,
P.Roudeau,
T.Rovelli,
V.Ruhlmann-Kleider,
D.Ryabtchikov,
A.Sadovsky,
L.Salmi,
J.Salt,
A.Savoy-Navarro,
U.Schwickerath,
A.Segar,
R.Sekulin,
K. Seth,
M.Siebel,
A.Sisakian,
G.Smadja,
O.Smirnova,
A.Sokolov,
A.Sopczak,
R.Sosnowski,
T.Spassov,
M.Stanitzki,
A.Stocchi,
J.Strauss,
B.Stugu,
M.Szczekowski,
M.Szeptycka,
T.Szumlak,
T.Tabarelli,
M. Tabize,
A.C.Taffard,
F.Tegenfeldt,
J.Timmermans,
L.Tkatchev,
M.Tobin,
S.Todorovova,
A.Tomaradze,
B.Tome,
A.Tonazzo,
P.Tortosa,
P.Travnicek,
D.Treille,
G.Tristram,
M.Trochimczuk,
C.Troncon,
M-L.Turluer,
I.A.Tyapkin,
P.Tyapkin,
S.Tzamarias,
V.Uvarov,
G.Valenti,
P.Van Dam,
J.Van Eldik,
A.Van Lysebetten,
N.van Remortel,
I.Van Vulpen,
G.Vegni,
F.Veloso,
W.Venus,
P.Verdier,
V.Verzi,
D.Vilanova,
L.Vitale,
V.Vrba,
H.Wahlen,
A.J.Washbrook,
C.Weiser,
D.Wicke,
J.Wickens,
G.Wilkinson,
M.Winter,
M.Witek,
O.Yushchenko,
A.Zalewska,
P.Zalewski,
D.Zavrtanik,
V.Zhuravlov,
N.I.Zimin,
A.Zintchenko,
M.Zupan
11footnotetext: Department of Physics and Astronomy, Iowa State
University, Ames IA 50011-3160, USA
22footnotetext: Physics Department, Universiteit Antwerpen,
Universiteitsplein 1, B-2610 Antwerpen, Belgium
and IIHE, ULB-VUB,
Pleinlaan 2, B-1050 Brussels, Belgium
and Faculté des Sciences,
Univ. de l’Etat Mons, Av. Maistriau 19, B-7000 Mons, Belgium
33footnotetext: Physics Laboratory, University of Athens, Solonos Str.
104, GR-10680 Athens, Greece
44footnotetext: Department of Physics, University of Bergen,
Allégaten 55, NO-5007 Bergen, Norway
55footnotetext: Dipartimento di Fisica, Università di Bologna and INFN,
Via Irnerio 46, IT-40126 Bologna, Italy
66footnotetext: Centro Brasileiro de Pesquisas Físicas, rua Xavier Sigaud 150,
BR-22290 Rio de Janeiro, Brazil
and Depto. de Física, Pont. Univ. Católica,
C.P. 38071 BR-22453 Rio de Janeiro, Brazil
and Inst. de Física, Univ. Estadual do Rio de Janeiro,
rua São Francisco Xavier 524, Rio de Janeiro, Brazil
77footnotetext: Collège de France, Lab. de Physique Corpusculaire, IN2P3-CNRS,
FR-75231 Paris Cedex 05, France
88footnotetext: CERN, CH-1211 Geneva 23, Switzerland
99footnotetext: Institut de Recherches Subatomiques, IN2P3 - CNRS/ULP - BP20,
FR-67037 Strasbourg Cedex, France
1010footnotetext: Now at DESY-Zeuthen, Platanenallee 6, D-15735 Zeuthen, Germany
1111footnotetext: Institute of Nuclear Physics, N.C.S.R. Demokritos,
P.O. Box 60228, GR-15310 Athens, Greece
1212footnotetext: FZU, Inst. of Phys. of the C.A.S. High Energy Physics Division,
Na Slovance 2, CZ-180 40, Praha 8, Czech Republic
1313footnotetext: Dipartimento di Fisica, Università di Genova and INFN,
Via Dodecaneso 33, IT-16146 Genova, Italy
1414footnotetext: Institut des Sciences Nucléaires, IN2P3-CNRS, Université
de Grenoble 1, FR-38026 Grenoble Cedex, France
1515footnotetext: Helsinki Institute of Physics and Department of Physical Sciences, P.O. Box 64,
FIN-00014 University of Helsinki,
Finland
1616footnotetext: Joint Institute for Nuclear Research, Dubna, Head Post
Office, P.O. Box 79, RU-101 000 Moscow, Russian Federation
1717footnotetext: Institut für Experimentelle Kernphysik,
Universität Karlsruhe, Postfach 6980, DE-76128 Karlsruhe,
Germany
1818footnotetext: Institute of Nuclear Physics,Ul. Kawiory 26a,
PL-30055 Krakow, Poland
1919footnotetext: Faculty of Physics and Nuclear Techniques, University of Mining
and Metallurgy, PL-30055 Krakow, Poland
2020footnotetext: Université de Paris-Sud, Lab. de l’Accélérateur
Linéaire, IN2P3-CNRS, Bât. 200, FR-91405 Orsay Cedex, France
2121footnotetext: School of Physics and Chemistry, University of Lancaster,
Lancaster LA1 4YB, UK
2222footnotetext: LIP, IST, FCUL - Av. Elias Garcia, 14-,
PT-1000 Lisboa Codex, Portugal
2323footnotetext: Department of Physics, University of Liverpool, P.O.
Box 147, Liverpool L69 3BX, UK
2424footnotetext: Dept. of Physics and Astronomy, Kelvin Building,
University of Glasgow, Glasgow G12 8QQ
2525footnotetext: LPNHE, IN2P3-CNRS, Univ. Paris VI et VII, Tour 33 (RdC),
4 place Jussieu, FR-75252 Paris Cedex 05, France
2626footnotetext: Department of Physics, University of Lund,
Sölvegatan 14, SE-223 63 Lund, Sweden
2727footnotetext: Université Claude Bernard de Lyon, IPNL, IN2P3-CNRS,
FR-69622 Villeurbanne Cedex, France
2828footnotetext: Dipartimento di Fisica, Università di Milano and INFN-MILANO,
Via Celoria 16, IT-20133 Milan, Italy
2929footnotetext: Dipartimento di Fisica, Univ. di Milano-Bicocca and
INFN-MILANO, Piazza della Scienza 2, IT-20126 Milan, Italy
3030footnotetext: IPNP of MFF, Charles Univ., Areal MFF,
V Holesovickach 2, CZ-180 00, Praha 8, Czech Republic
3131footnotetext: NIKHEF, Postbus 41882, NL-1009 DB
Amsterdam, The Netherlands
3232footnotetext: Northwestern University, Evanston, IL-60208, USA
3333footnotetext: National Technical University, Physics Department,
Zografou Campus, GR-15773 Athens, Greece
3434footnotetext: Physics Department, University of Oslo, Blindern,
NO-0316 Oslo, Norway
3535footnotetext: Dpto. Fisica, Univ. Oviedo, Avda. Calvo Sotelo
s/n, ES-33007 Oviedo, Spain
3636footnotetext: Department of Physics, University of Oxford,
Keble Road, Oxford OX1 3RH, UK
3737footnotetext: Dipartimento di Fisica, Università di Padova and
INFN, Via Marzolo 8, IT-35131 Padua, Italy
3838footnotetext: Rutherford Appleton Laboratory, Chilton, Didcot
OX11 OQX, UK
3939footnotetext: Dipartimento di Fisica, Università di Roma II and
INFN, Tor Vergata, IT-00173 Rome, Italy
4040footnotetext: Dipartimento di Fisica, Università di Roma III and
INFN, Via della Vasca Navale 84, IT-00146 Rome, Italy
4141footnotetext: DAPNIA/Service de Physique des Particules,
CEA-Saclay, FR-91191 Gif-sur-Yvette Cedex, France
4242footnotetext: Instituto de Fisica de Cantabria (CSIC-UC), Avda.
los Castros s/n, ES-39006 Santander, Spain
4343footnotetext: Inst. for High Energy Physics, Serpukov
P.O. Box 35, Protvino, (Moscow Region), Russian Federation
4444footnotetext: J. Stefan Institute, Jamova 39, SI-1000 Ljubljana, Slovenia
and Laboratory for Astroparticle Physics,
Nova Gorica Polytechnic, Kostanjeviska 16a, SI-5000 Nova Gorica, Slovenia,
and Department of Physics, University of Ljubljana,
SI-1000 Ljubljana, Slovenia
4545footnotetext: Fysikum, Stockholm University,
Box 6730, SE-113 85 Stockholm, Sweden
4646footnotetext: Institute of High Energy Physics of Tiblisi State University, Georgia
4747footnotetext: Dipartimento di Fisica Sperimentale, Università di
Torino and INFN, Via P. Giuria 1, IT-10125 Turin, Italy
4848footnotetext: INFN,Sezione di Torino, and Dipartimento di Fisica Teorica,
Università di Torino, Via P. Giuria 1,
IT-10125 Turin, Italy
4949footnotetext: Dipartimento di Fisica, Università di Trieste and
INFN, Via A. Valerio 2, IT-34127 Trieste, Italy
and Istituto di Fisica, Università di Udine,
IT-33100 Udine, Italy
5050footnotetext: Univ. Federal do Rio de Janeiro, C.P. 68528
Cidade Univ., Ilha do Fundão
BR-21945-970 Rio de Janeiro, Brazil
5151footnotetext: Department of Radiation Sciences, University of
Uppsala, P.O. Box 535, SE-751 21 Uppsala, Sweden
5252footnotetext: IFIC, Valencia-CSIC, and D.F.A.M.N., U. de Valencia,
Avda. Dr. Moliner 50, ES-46100 Burjassot (Valencia), Spain
5353footnotetext: Institut für Hochenergiephysik, Österr. Akad.
d. Wissensch., Nikolsdorfergasse 18, AT-1050 Vienna, Austria
5454footnotetext: Inst. Nuclear Studies and University of Warsaw, Ul.
Hoza 69, PL-00681 Warsaw, Poland
5555footnotetext: Fachbereich Physik, University of Wuppertal, Postfach
100 127, DE-42097 Wuppertal, Germany
1 Introduction
Correlations between final-state particles in high energy collisions have been extensively studied during the last decades. They can be due to phase space, energy-momentum conservation, resonance production, hadronisation mechanisms, or be dynamical in nature.
In the particular case of identical bosons the correlations are enhanced by the Bose-Einstein effect [1, 2]. These Bose-Einstein correlations (BEC) are a consequence of quantum statistics. The net result is that multiplets of identical bosons are produced with smaller energy-momentum differences than non-identical ones.
Several aspects of BEC have been measured in hadronic Z decays and are well understood [3]. It is natural to expect the same behaviour in the hadronic decay of a single W. It is, however, not clear how BEC manifest themselves in a system of two hadronically decaying W’s, in particular between bosons coming from different W’s (inter-W BEC).
The separation between two W’s before their decay is of the order of 0.1 fm, compared to a typical hadronisation scale of several fm. Therefore, due to the large overlap between the two hadron sources, inter-W BEC cannot be a priori excluded. However, it is unclear whether these are of the same type as BEC measured inside a single decaying W, where they are, in contrast to the traditional Hanbury-Brown and Twiss [4] picture, not related to the total hadronisation volume.
Together with colour reconnection [5, 6], the poor understanding of the inter-W BEC effect introduces a large systematic uncertainty in the measurement of the W mass in the channel [7, 8]. The current statistical uncertainty of the combined LEP measurement in this channel amounts to 35 MeV [9], to be compared with the total systematic uncertainty in this channel of 107 MeV, which is, however, expected to decrease with improved measurements of colour reconnection. The effect of possible inter-W BEC amounts to 35 MeV [9]. It is thus clear that a better understanding of the phenomenon would help in reducing this uncertainty.
Measuring inter-W BEC is challenging in practice because of a low sensitivity to the effect. This is mainly due to the small fraction of relevant particle pairs coming from different W’s. Moreover, its isolation from BEC inside a single W requires careful attention and needs to be as model-independent as possible.
The scope of this paper is the model-independent analysis of the correlations of like-sign hadron pairs in , where both W’s decay into hadrons, with the aim of determining the presence and size of inter-W BEC.
The outline of the paper is as follows: In section 2 the mathematical formalism applied throughout this analysis is specified and a brief overview of the analysis is given. In section 3 experimental details, such as the detector setup and WW event selection, are presented. Section 4 focuses on the mixing procedure employed in order to construct an inter-W BEC-free reference sample from events where one W decays leptonically. Section 5 clarifies the details of the Monte Carlo models for comparison to the data. In section 6 a detailed overview of the numerical analysis of the measured correlation functions is given including a construction of weights applied in order to increase the sensitivity of the analysis, the subtraction of background and the determination of statistical errors and correlations of the bins. Moreover the parametrisation of the correlation function is discussed. In section 7 results are presented and in section 8 the systematic uncertainties are discussed. Finally, sections 9 and 10 discuss the results and conclusions are given.
2 Analysis method
The mathematical method used to extract a possible inter-W BEC signal is largely based on [10] and [11]. In the case of two stochastically independent hadronically decaying W’s, the single and two-particle inclusive densities obey the following relations:
| (1) | ||||
| (2) |
where denotes the inclusive single particle density of one W and the inclusive two-particle density of one W. The densities and then correspond to the single and two-particle inclusive densities of a fully-hadronic WW event. Assuming that the densities for the and the are the same, which is correct if one does not look at the absolute sign of the particles’ charges, equation (2) can be re-written as
| (3) |
The terms and can be measured in fully-hadronic and semi-leptonic WW decays respectively.
A pair or two-particle density is trivial to construct. The correlation measurement is made difficult by the fact that only the correlations between particles coming from different W’s are of interest and there is no way of determining where the particles originated from. Finally, in order to obtain a correlation function, it is necessary to construct a reference sample of events without BEC between particles coming from different W bosons. This sample corresponds, in our case, to the product of the single particle densities .
Events where only one of the W’s decays hadronically can be used to address these challenges. Taking two of these independent hadronically decaying W’s and mixing them to form one event allows an emulation of a fully-hadronic WW event, having BEC inside each of the W’s. By construction these events will have no correlations in pairs from different W’s and the measurement becomes a direct comparison between two event samples, without any model dependence. The event mixing should follow closely the electroweak production of WW events. Possible biases of the mixing procedure can be estimated by applying the same procedure to large samples of simulated events. Hence, the term in equation (3) replaced by a two-particle density , obtained by combining particles from two hadronic W decays taken from different semi-leptonic events. The details of this “mixing” procedure are explained in section 4. Expressed in the variable , where stands for the four-momentum of particles and , equation (3) can be re-written as
| (4) |
Keeping in mind that equation (2) was formulated for independent W decays, test observables can be constructed to search for deviations from this assumption. Such deviations will indicate that particles from different W decays do correlate. The observables considered are:
| (5) | ||||
| (6) | ||||
| Given the definition of the genuine inter-W correlation function [11], it can be shown that | ||||
| (7) | ||||
If no inter-W correlations exist, the variables and will be zero for all values of , while will be equal to one. Inter-W BEC will lead to an excess at small values of .
The selection of particles and pairs is straightforward, with the strongest requirement that they should originate from the primary interaction. Moreover, the selected WW candidates have a significant background which must be subtracted using a model dependent procedure.
BEC in Z decays have been extensively measured and constitute a natural basis to compare with inter-W BEC. The correlation functions measured in Z events use simulated events without BEC as reference samples. They are therefore close to being genuine correlation functions but with large model-dependent systematic errors and some dilution due to particles which are either not pions or which do no originate from the primary interaction. When the inter-W correlations are measured it is natural to compare to the Z and single-W data using the same fitting functions. Since the inter-W measurement uses data as reference, the model dependence is no longer present.
The mixing procedure, which allows events to be mixed more than once, leads to a rather involved description of the statistical properties of the correlation function. However, the same mixing can be used to investigate the sensitivity to the inter-W BEC effect. The applied mixing reuses semi-leptonic events up to 20 times, which affects the precision depending on whether pairs are constructed by mixing or come from inside single W’s. Finally, a pair-weighting technique was devised which improved the sensitivity and is described in section 6.1. For this purpose the mixed reference sample was used to determine statistically whether particles come from the same or different W’s.
3 Experimental details
3.1 The DELPHI detector
The DELPHI detector configuration for the LEP2 running evolved compared to the one at LEP1 [12, 13]. The main changes relevant to the analysis described in this paper were the extension of both the vertex and the inner detectors. This ensured a very good track quality also in the forward region down to small polar angles. During the operation of the detector in the latter part of the year 2000 one sector of the TPC malfunctioned and the data from this period are excluded from the results.
In order to verify that a track originates from the primary interaction it was required that the TPC participated in the measurement of the track. This effectively required the track to be within the polar angle region ∘ ∘. The reconstructed charged particles were required to fulfill the following criteria on the momentum, , the momentum error, , and the impact parameters with respect to the event vertex in the plane transverse to the beam, , or parallel to the beam, :
-
•
0.2 GeV ;
-
•
;
-
•
cm;
-
•
cm/sin.
The two track reconstruction efficiency in DELPHI drops for opening angles below 2.5∘. Since the mixing procedure does not necessarily reproduce this drop in efficiency all particle pairs having an opening angle below 2.5∘ were omitted in all two-particle density distributions. These requirements lead to a typical efficiency of about 85% and reduce the total fraction of secondary tracks to about 5%. Secondary tracks are typically tracks from secondary decays (, , etc.) or from secondary interactions in the beam pipe and with detector material. Particles not coming from the primary interaction or not being pions will dilute the observed correlation. The combined effect was estimated to reduce the measured BEC to about 70% of the nominal one. This dilution was not corrected for due to model dependence and affects all pair densities in nearly the same way. When results from different experiments are combined it will be necessary to apply such corrections in order to get comparable results.
3.2 Selection of WW events
| Year | 1998 | 1999 | 2000 | |||
|---|---|---|---|---|---|---|
| (GeV) | 189 | 192 | 196 | 200 | 202 | 204-209 |
| (pb-1) | 158.0 | 25.9 | 76.9 | 84.3 | 41.1 | 163.4 |
The total analysed dataset amounts to an integrated luminosity of 549.6 pb-1, collected with the DELPHI detector during the years 1998–2000. A summary of the integrated luminosity per energy point is given in table 1.
The samples of fully-hadronic and semi-leptonic events required for the WW BEC analysis were selected using neural networks, developed in [14] and [15].
For the fully-hadronic event selection, it was demanded that the events fulfill the following requirements: a large enough charge multiplicity, a large effective centre-of-mass energy, large visible energy and four or more jets.
The final selection was performed using a neural network trained on thirteen event variables. The dominant background contribution comes from the events. All other backgrounds are negligible. Hadronically decaying ZZ events, which constitute 5% of the selected sample, were treated as signal as they, except for events where at least one Z decays into b-quarks, will have similar space-time kinematics. A comparison between data and simulated events of the neural network output for the fully-hadronic selection is shown in figure 1.
By requiring a neural network output larger than a given value, a desired purity or efficiency can be reached. The whole analysis was repeated for several cuts on the neural network output, selecting samples with an increasing purity, ranging from 83% to 97%. This allowed the choice of an optimal working point, minimising the sum of the statistical and background uncertainty, corresponding to a selection efficiency and purity of 63% and 92% respectively, with 3252 events selected in total.
The semi-leptonic events were selected by requiring two hadronic jets, a well-isolated identified muon or electron or (for tau candidates) a well-isolated particle associated with missing momentum possibly from the neutrino. The missing momentum direction was required to point away from the beam pipe. Dedicated neural network trainings were used for all lepton flavours. Combining all three lepton flavours, an overall efficiency and purity of respectively 58% and 96% was reached, corresponding to 2567 selected events. The three neural network outputs, corresponding to the three lepton flavours are shown in figure 2 for data and simulated events.
4 Mixing procedure
The mixed two-particle density, , was constructed by combining the hadronically- decaying W’s from pairs of different semi-leptonic WW events, , from which the lepton was removed and irrespective of the charge of the W’s.
The momentum of each hadronic W can be constructed as the visible W momentum or the W momentum after a constrained fit imposing energy- and momentum-conservation and constraining the two W masses in the event to be equal to 80.35 GeV. After mixing the W’s, the first method gives mixed events which have smaller missing momenta than the fully-hadronic events while the second gives larger missing momenta. It was therefore decided to use the average of the visible W momentum with a weight of 0.4 and the fitted W momentum with a weight of 0.6 to obtain the final W momentum. This procedure gave the best agreement with respect to the missing momenta, and it was cross checked that the mixing quality does not depend significantly on the used weights.
In WW events the W’s are nearly back-to-back due to momentum conservation. In mixed events this was accomplished by requiring that one W polar angle lay within 10∘ opposite to the polar angle of the other W. Pairings where the two W polar angles were within 10∘ after inverting the -component of one W were also accepted. The momenta of the W’s were then approximatively balanced by rotating one W around the beam axis so that the W’s became back-to-back in the plane transverse to the beam axis. The above transformations reflect the azimuthal and forward-backward symmetry of the DELPHI tracking detectors.

All mixed events were subjected to the same event selection as the fully-hadronic events. The agreement between fully-hadronic events and mixed events was verified for several event variables and single-particle distributions. Small differences in the distributions are taken into account in the estimation of the systematic errors. Examples are shown in figure 3, comparing the particle momenta, charge multiplicity, total missing momentum and reconstructed W mass between simulated fully-hadronic events and simulated mixed events. These events were generated with the BEI model described in section 5.
5 Monte Carlo models
All Monte Carlo generated events were hadronized using the JETSET algorithm unless stated otherwise. BEC were included using the local reweighting algorithm LUBOEI [19, 7]. It takes as starting point the hadrons produced by the string fragmentation in JETSET, where no Bose-Einstein effects are present. Then the momenta of identical bosons are shifted such that the inclusive distribution of the relative separation of identical pairs is enhanced by a factor , parametrised with the phenomenological form
| (8) |
where is the difference in four-momentum of the pair, and are free parameters related to the correlation strength and the spatial scale of the source of the correlations.
The corresponding change in the momentum of the particles is not unique. In addition, energy and momentum cannot be simultaneously conserved. In the model, the momentum is always conserved and afterwards all three-momenta are rescaled by a constant factor, close to unity, in order to restore energy conservation. Even when BEC is only allowed for pairs coming from the same W (BEI), this global rescaling introduces unreasonable negative shifts in the reconstructed W mass. The BE32 variant of LUBOEI overcomes this problem by including extra momentum shifts to restore total energy conservation, instead of a rescaling of the momenta.
The BE32 model was tuned to hadronic Z decays, keeping all fragmentation parameters fixed, giving a satisfactory result for all hadronic Z events and hadronic Z events with reduced b-content. The resulting LUBOEI parameters for the correlation strength, , and the correlation length scale, , are PARJ(92)=1.35 and PARJ(93)=0.34 GeV-1 (= 0.6 fm), respectively. Monte Carlo sets exceeding ten times the size of the WW data set were simulated at each centre-of-mass energy.
The tuned model gives a good description of DELPHI’s Z data (see figure 10(a)) and the hadronic decay of single W’s. The latter is illustrated in figure 4, where the two-particle correlation function defined as
| (9) |
is shown for selected semi-leptonic W decays in data and MC simulation. The dip around GeV in the BE32 curve in figure 4 is understood to come from the conservation of the total multiplicity in the model and is taken into account by the fit in equation (11). The signal at low Q values is naturally compensated by a depletion at higher Q values.
In this paper the label BEI is used for the LUBOEI model including only BEC between particles from the same W, BEA is used when all particles are subjected to BEC and BE0 when all BEC are switched off.

|
 |
|
 |
6 Numerical analysis
The numerical analysis of the BEC measurement is complicated by statistical correlations introduced by the methodology. Each charged particle occurs in several pairs and each semi-leptonic event is used to produce several different mixed events. All these statistical correlations were included in the numerical analysis and the performance evaluated using resampling techniques.
6.1 Pair weights
The sensitivity of any inter-W BEC measurement is limited by the small fraction of particle pairs coming from different W’s, resulting in a small value. This is illustrated in figure 5(a), where the fraction of pairs from different W’s, denoted as , is shown. It drops to around 15% at very low values.
In addition to , the Lorentz factor, , and the decay angle of a particle pair, , are sensitive to whether two particles come from the same or from different W’s. The decay angle, , is defined as the angle between the momentum vector of one of the particles in the two-particle rest frame and the vector sum of the two particle momenta in the lab frame. As such, each individual pair of tracks can be estimated to have a probability to come from different W’s. was parametrised for this analysis using large samples of simulated mixed semi-leptonic W decays. Figure 5(b) illustrates the distribution of for pairs with GeV. The BEI model is shown for the mixed and same W’s and compared to the data results.
A particle is combined with the other particles in one event when constructing . It is combined with the other particles in many other events when constructing . Therefore, has smaller local fluctuations than even though they are constructed using the same particles. Using a detailed error analysis it was determined that pairs from the same W contribute a factor more to the final variance of the BEC measurements at low -values than pairs from different W’s. For this analysis a value of was determined and used in the following.
The contribution to the statistical variance was estimated for samples of pairs with a given purity and was found to be proportional to . Finally, all pairs were weighted by divided by the above variance factor. Using these weights, the improvement in the statistical error on the final measurement was 9%. This is the reason for choosing the analysis which weights all particle pairs with their information content for the final result. The above procedure not only reduces the statistical error but makes the analysis more sensitive to pairs which originate from different W’s.
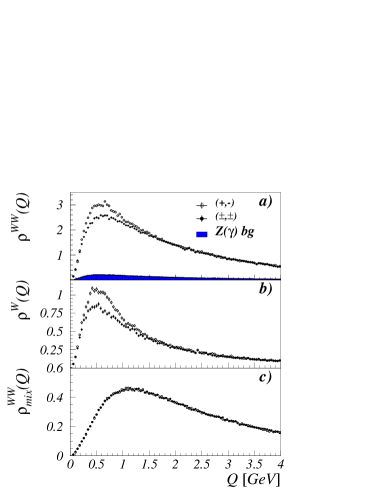
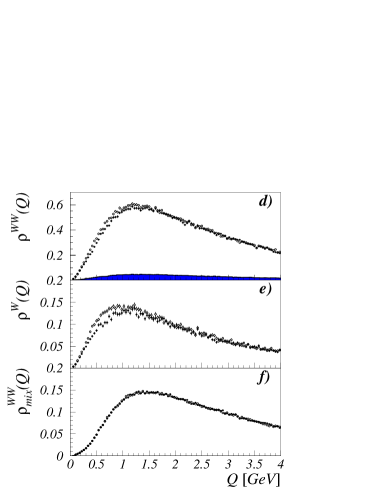
The two-particle densities in for the combined data set are shown in figure 6 for both like-sign particle pairs and unlike-sign particle pairs, with and without pair weights. In both the fully-hadronic and semi-leptonic samples, the number of unlike-sign pairs is higher than the number of like-sign pairs at values below 2 GeV. This is due to the large number of resonance decays with masses in this range. The region around GeV is dominated by pairs coming from the resonance which is abundantly present in hadronic decays of the W. Reflections of three-body decays are also present in the like-sign distributions. The two-particle densities of like-sign and unlike-sign pairs for the mixed events coincide, the reason for this being that all pairs in this distribution contain particles from different events. When pair weights are applied, contributions from resonance decays are down-weighted, therefore the like-sign and unlike-sign spectra become more similar.
6.2 Background subtraction
The histograms in figure 6 show the contribution from background events as they are simulated with the BE32 model. The density is, consequently, corrected for this background using the expression
| (10) |
where and are the total number of selected events and the number of selected background events, respectively, and and the respective number of particle pairs from these events.
The correlation strength parameter, PARJ(92), was re-tuned to a value of 0.9 in order to get a better description of four-jet Z events, which are more similar to the selected background than inclusive Z decays. This re-tuning was only used for the background events. Details on the background tuning are discussed in section 8.
6.3 Fit parametrisation
| sample/parameter | /ndf | ||||
|---|---|---|---|---|---|
| BE32 | 0.77 0.02 | 0.59 0.01 | -0.78 0.02 | 0.013 0.003 | 141.8/96 |
| data | 0.64 0.07 | 0.59 | -0.78 | 0.018 0.017 | 114.7/98 |
In order to quantify an excess at small values, fits were performed to the inter-W correlation function . The choice of fitting function is motivated by the shape of the measurements. and have nearly the same physical meaning but different systematics since is dependent on the fragmentation model used. This means that the optimal fitting functions are not necessarily the same and that comparisons between and results must be done carefully.
It is known from BEC measurements of the hadronic final state of a Z or a single W that two particle correlation functions are reasonably well described by either a Gaussian or an exponential parametrisation [3, 20]. However, the BE32 Monte Carlo samples show a more detailed structure in the range between 0.5 and 1.5 GeV, as can be seen from figure 4. The slope observed around 1 GeV flattens out above GeV. Therefore in the plots of the correlation functions we restrict to the range 0-2 GeV. The fits are, however, performed in the range 0-4 GeV. The dip around GeV and the following slope of the correlation function were treated as integral parts of the BE correlation function and as integral parts of the BEC effect. Therefore, all distributions are fitted with the parametrisation
| (11) |
where denotes the correlation strength, is related to the source size, and the term with accommodates the dip around GeV. The auxiliary term accounts for small differences in the charged multiplicity of the signal and reference samples leading to a potential bias in the normalisation.
The results of the correlation function, , are summarised in table 2 and shown in figure 4. In order to compare the measured correlation strength, , between data and the BE32 model, the and parameters were fixed to the values obtained from the model. The measured correlation strength in data was found to be slightly smaller than in the model. The significance of this difference is 1.8 standard deviations, but it does not include systematic errors. Fitting measurements of must typically include an additional slope parameter and implies that it takes into account the uncertainty due to fragmentation. This leads to a large correlation with the parameter and means that it is no longer possible to extract meaningful results on , since it is not known whether to attribute the dip to the signal or the fragmentation of the reference sample. The parameter will also be affected by this but to a lesser degree and finally the parameter is the most stable. No reliable way has been found to quantify the systematic errors on the measurements, and therefore only a qualitative agreement between BE32 and the semi-leptonic data can be demonstrated.
When fitting the normalization, , can no longer be described as a simple additive parameter, and is included in the fits as:
| (12) |
The comparison of and results is limited by the systematics of the measurements, as described above. Througout the paper, for reasons of clarity, the symbols and wil be used when referring to fits of the and distributions respectively.
6.4 Statistical errors and correlations
The values of the two-particle density distributions for different bins are statistically correlated, since in general a particle occurs in several pairs and because of non-Poissonian fluctuations in the overall particle multiplicity [21].
The covariance matrix elements for the histogrammed spectra are given by , where and are the contents of bins and . These covariances are propagated in the computation of the errors related to the distributions in equations (5)–(7). The use of pair weights does not pose any problems within this approach. The statistical errors shown in the figures in this paper were computed only from the diagonal elements of the covariance matrices.
Because of the limited precision of , the covariance matrix was treated carefully from a numerical point of view in the subsequent fits. The results and the covariance matrix were obtained from the same data and therefore correlated. This correlation is effectively enhanced by the substantial correlations in and is a cause for biases in the fit results. By choosing suitable transformations of the fitting functions this bias can often be reduced. However, for the observable the value of is already nearly unbiased when no transformation is applied. All these biases were found to be inversely proportional to the number of fitted events and the effect could therefore be estimated by comparing the fit results on large samples to the fit results on data-sized samples. The final biases on the parameters and (see section 6.4) which were obtained for data-sized samples, were estimated to be and 0.0121, respectively. The biases on and were found to be completely negligible. All the final fit results were corrected for these biases.
The statistical errors were verified using resampling techniques and were found to be unbiased within a relative precision of 2%.
7 Results
|
|
| sample/parameter | /ndf | ||||
|---|---|---|---|---|---|
| free and fixed to BEA values | |||||
| BEA (,) | 1.50 0.06 | 0.72 0.02 | -0.50 0.03 | -0.010 0.002 | 116.4/96 |
| Data (,) | 1.42 0.63 | 1.14 0.33 | -0.50 | -0.002 0.020 | 88.3/97 |
| BEA (+,–) | 0.30 0.03 | 0.41 0.03 | -0.60 0.09 | -0.010 0.002 | 110.8/96 |
| Data (+,–) | 0.43 0.22 | 0.45 0.15 | -0.60 | 0.000 0.020 | 93.2/97 |
| and fixed to BEA values | |||||
| Data (,) | 0.82 0.29 | 0.72 | -0.50 | -0.005 0.020 | 89.9/98 |
| BEI (,) | 0.10 0.05 | 0.72 | -0.50 | -0.009 0.004 | 99.3/98 |
| BE0 (,) | 0.02 0.02 | 0.72 | -0.50 | -0.010 0.002 | 98.0/98 |
| Data (+,–) | 0.40 0.18 | 0.41 | -0.60 | -0.001 0.020 | 93.2/98 |
| BEI (+,–) | 0.01 0.03 | 0.41 | -0.60 | -0.005 0.003 | 137.5/98 |
| BE0 (+,–) | -0.04 0.02 | 0.41 | -0.60 | -0.009 0.002 | 138.0/98 |
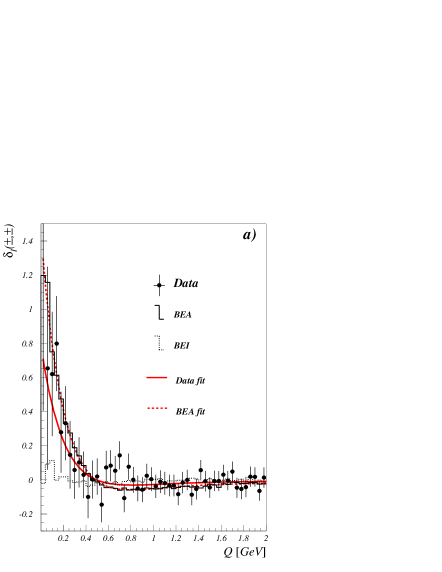
Inter-W BE correlations were studied as function of the observables , and as defined in equations (5)–(7). These results are shown as function of in figures 7,8 and compared to predictions of the LUBOEI model. In the like-sign distributions, an excess in data at low values can be observed. Numerical results were extracted from the distribution, shown in figure 8. This choice was made since the is a genuine inter-W correlation function having a clear physical interpretation. Other results are given for comparison. Note that none of the results are corrected for pion purity or secondary tracks, as was mentioned in section 3.
The distribution for like-sign pairs was fitted using equation (12). The fits to the BEA model were performed with all four fit parameters left free. The correlation strengths obtained from the BEI and BE0 models were used to estimate a possible bias for the measurement which is treated as systematic error (see section 8). The result where both and were left free in the fit provides the most model-independent result. However, fixing the values of and to the ones predicted by LUBOEI BE32 tuned to DELPHI inclusive Z data, makes model comparisons easier and contains the same statistical significance.
The results on the data and models are summarised in table 3. The main result of this paper is then the observed correlation strength for like-sign pairs:
| (13) |
with fixed to 0.72 fm. The first error is statistical and the second error is systematic. The evaluation of the systematic uncertainty of this result is discussed in section 8. The expectation from the BEA model yields
| (14) |
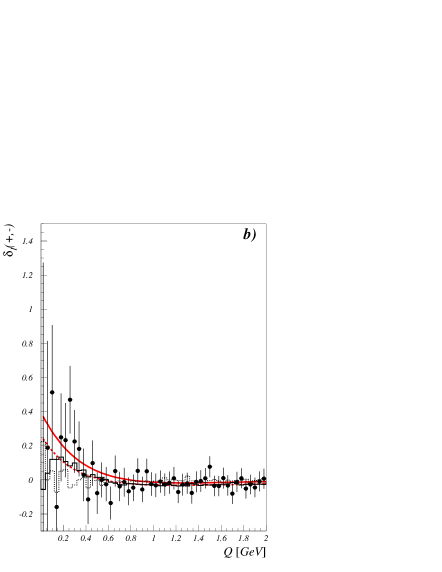
The correlations in unlike-sign pairs were also measured using the same procedure as for the like-sign pairs. The result is shown in figure 8 (b) and summarised in table 3. The distribution shows some enhancements at low when compared to the prediction from BEI. Fitting with the same expression as for the like-sign pairs, but with and fixed to the unlike-sign BEA prediction, yields:
| (15) |
in agreement with the expectation from BEA:
| (16) |
The LUBOEI model prediction for unlike-sign pairs has not been tuned on Z events as it was the case for the like-sign pairs. Therefore this prediction should be treated more carefully and an interpretation will be made in the discussion section.
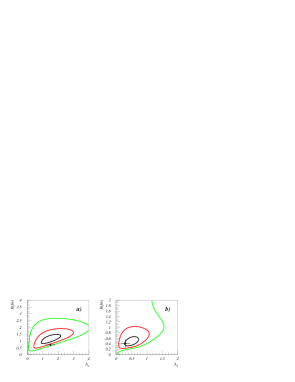
The numerical results of the simultaneous fit of and are shown in table 3. Since the two parameters are strongly correlated the results are presented as curves in 2-d plots. Figure 9 shows the fit results for both the like- and unlike-sign pairs. In these fits, the value of is still fixed since the data do not contain enough information about this parameter. The position of the dip in the correlation function is hence forced to scale like . The systematic error is of the same size as the measurement with fixed and not included in the fits shown in table 3 and figure 9.
8 Systematic uncertainties
The model-independent analysis of inter-W correlations performed in this paper avoids potential biases by the use of the event mixing and a direct data-to-data comparison. Therefore only few sources of systematic uncertainty remain to be considered; these are the subtraction of the background, the quality of the mixing of W final states from semi-leptonic events and the possible influence of colour reconnection.
The background was subtracted using BE32 simulation where the correlation strength can be varied via the parameter PARJ(92). Although the standard BE32 tuning, using PARJ(92)=1.35, gives a good description of inclusive Z-events, it was found that an input parameter strength of PARJ(92)=0.9 gives a better description of Z-events having a clear four-jet topology. This can be seen in figure 10 where both tunings are compared with inclusive Z-decays and four-jet like events. The four-jet events were selected with the LUCLUS [17] clustering algorithm with GeV.
Both background samples were subtracted from the data and half of the absolute difference in the final result of , 0.075, was taken as a systematic uncertainty due to the lack of knowledge about BEC in events.
In addition, data with a lower purity than at the working point were used to estimate the correlations in the background itself. Four different purity bins were chosen and fits performed in each bin to obtain the dependency of on the event purity. The measured correlation strength depends non-linearly on the correlation strength parameter PARJ(92) used in the LUBOEI simulation of the background. A linear interpolation between the model predictions for the two parameter choices of the following form has therefore been used: Model() = Model(PARJ(92)=1.35) + Model(PARJ(92)=0.90). The extrapolation was found also to apply satisfactory outside the range .
In each purity bin and for several different background subtractions (as determined by different values of ) the data were then fitted in order to obtain the corresponding values of and . Only the uncorrelated errors were used in these fits, so that the results are independent except for the semi-leptonic events which are identical for each bin. The results of these fits are shown in table 4. The value of was then varied to obtain the background subtraction, for which the values are independent of the purity. The result of this variation gave the result: , with for 3 degrees of freedom.
This value of is consistent with the value used, , and is an additional strong indication that the correlations in background 4-jet events are smaller than for the inclusive sample (). The data are shown in figure 11, where the background with is subtracted. The amount of subtracted background was varied by 10% (relative), which changed by 0.007, which is negligible.
| Purity bin | a | b | c | d |
|---|---|---|---|---|
| Purity | 0.60 | 0.77 | 0.89 | 0.97 |
| 0.39 0.36 | 1.28 0.35 | 0.74 0.23 | 1.33 0.33 | |
| -0.69 | -0.48 | -0.17 | -0.08 | |
| 0.91 0.40 | 1.64 0.36 | 0.87 0.24 | 1.39 0.33 |
In the semi-leptonic events the background is a factor 2 smaller than in the fully-hadronic events. It was verified that the topologies of these backgrounds are identical to those of the signal, i.e. mostly 2-fermion decays into hadrons. These events behave with respect to BEC in the same way as inclusive Z-events and therefore the BEC in these events are not expected to be significantly different than in the signal W-events. Finally, these background events do not suffer from the large extrapolation uncertainties of the 4-jet background in the fully-hadronic channel. The estimated systematic errors are shown in table 5.
The selection of the data and the construction of the mixed reference sample may introduce distortions in the two-particle densities and therefore may lead to a non-zero value of , measured in Monte Carlo samples without inter-W BEC. The fragmentation models used at LEP do not give a perfect description of all the details of the soft fragmentation and correlations. However, they constitute a reliable test for the magnitude of variation which can be expected for such effects. The largest absolute value of the measured , 0.125, for these models (PYTHIA [17], HERWIG [22], ARIADNE [23]) was taken as a measure for the influence of selection procedures and mixing method on the measurement. The above method sums over many possible problems of the mixing. In order to verify that the sum is not small due to an accidental cancellation of large effects a weighting procedure was applied for several event variables and single particle distributions as described in section 4. BEI events were weighted so that the mixed and fully-hadronic events were in perfect agreement and the weighted events were refitted. The maximum shift in was found to be 0.045 which is easily covered by the inclusive estimation.
Detector effects are very small due to the analysis method. Any simple variation of detector performance was found to give zero shift in . Higher order effects are still possible, but these are also correlated with fragmentation properties and it was therefore assumed that they are covered by the previous estimate.
A systematic uncertainty was attributed to the Colour Reconnection (CR) effect. This effect could have, in addition to inter-W BEC drastic consequences for the W mass measurement in the fully-hadronic channel [5, 6]. As for BEC, it violates the assumption that the two produced W bosons decay independently of each other.
Colour reconnection occurs when independent colour singlets interact strongly before hadron formation. In fully-hadronic W decays it recombines partons from different parton showers. After fragmentation, the resulting hadrons carry therefore a mixture of energy-momentum of both original W’s.
The CR effect has been modelled in various ways [5, 6, 24]. Only the extreme models [5], where reconnection occurs in all events, have been ruled out by the LEP experiments [9]; however the absence of CR is also disfavoured by the same information.
For this reason, three possible models of CR as implemented in JETSET, ARIADNE and HERWIG, were used to estimate their influence on this measurement. The maximum difference in between the CR samples and their equivalent models without CR implementation, 0.07, was found with the HERWIG implementation and was conservatively taken as systematic uncertainty due to the CR effect.
Finally, half of the bias correction (0.033) described in section 6.4 was conservatively attributed as a systematic error due to fit biases.
The total systematic uncertainty on the measured value is the sum in quadrature of the contributions listed in table 5 for both like-sign and unlike-sign particle pairs.
| syst source | contribution to | contribution to |
|---|---|---|
| background BE model | 0.07 | 0.02 |
| semi-leptonic Bg. | 0.01 | 0.01 |
| cuts & mixing | 0.12 | 0.04 |
| Colour Reconnection | 0.07 | 0.22 |
| Bias Correction | 0.03 | 0.03 |
| Total syst. | 0.17 | 0.22 |
9 Discussion
The result, , presented in section 7 shows an indication for BEC in like-sign pairs between two hadronically decaying W bosons at the level of 2.4 (standard deviations). The effect is 2.2 below the prediction of BE32, assuming that the systematic uncertainties due to cuts and mixing are 100% correlated. The spatial scale, , of the correlations is higher at the level of 1.3 , based on statistical uncertainties only. The QCD background to the WW signal is by itself of interest to study, and the data show that the BEC are weaker in these events than in inclusive hadronic Z events.
The measurement where both and are left free and measured from the data contains the most model-independent information, while the result with fixed is optimal for testing the excess in the direction predicted by BE32.
The results for unlike-sign pairs are difficult to interpret due to a large model dependency and systematic errors. The unlike-sign pairs show a smaller excess at low Q values. The excess is at the 1.4 level and in some agreement with the BE32 prediction, but a bit too large if the unlike-sign effect is scaled to follow the like-sign. The unlike-sign pairs are statistically correlated with the like-sign pairs at the level of 60%. Therefore it is not possible to rule out a large statistical component of these effects.
The tuning of the BE32 model was verified using the semi-leptonic WW events. The overall agreement including the description of the dip around GeV was found to be excellent, except that the data show a bit less correlation than the prediction tuned on Z’s. To this 1.8 statistical difference a systematic uncertainty which comes from extrapolating from Z data using the model has to be added. This uncertainty which is difficult to control is also the reason why the main result of this paper does not rely on BE32 simulation.
Inside the LUBOEI models the input parameter PARJ(92) determines the strength of the correlations. However, due to non-linear effects in the implementation, there is no one-to-one correspondence between the generated strength and the measured strength, . Even with a fixed value of PARJ(92) the observed does depend on the multiplicity of the event. The used value of PARJ(92)=1.35 leads to a measured value of for the semi-leptonic BE32 events while the BEA result is . The two BE32 results come from fits to and respectively. The systematics are expected to be small on these numbers because they compare events which use the same fragmentation. The above observation can be combined with the information that the improvement in the statistical sensitivity to BE32 was smaller (9%) than the improvement (17%) expected from pure statistics. This indicates that the BEA not only adds correlations between particles from different W’s compared to BEI, but increases the strength of all correlations significantly. This enhancement scenario is not supported by the 4-jet Z-data where the BE32 model clearly overestimates the correlations when tuned on inclusive events.
Both and are subject to additional corrections if their values are to be combined with other experiments. is diluted due to pair impurities to a level of about 70%, while is only comparable to either other data or models.
In conclusion this paper presents a model-independent measurement of inter-W BEC. The measurement does assume that intra-W BEC are the same in 2-jet and 4-jet WW decays. The direction in which the signal is looked for is motivated by the measured BEC in semi-leptonic WW events and implemented via the BE32 model tuned to Z data. The measurement is firmly based on the mixing of the hadronic final state of independent W bosons from semi-leptonic WW events. This technique yields small systematic uncertainties in spite of the small fraction of particle pairs from different W’s. A weighting technique allowed the effective purity to be raised to about 20%.
The treatment of statistical errors and bin correlations of the correlation function allows for a reliable specification of the statistical error of the quoted correlation strength. The remaining systematic uncertainties and their dependence on model parameters were carefully studied.
10 Conclusion
Overall, there is an indication of correlations in like-sign pairs from different W’s with a significance of 2.4 standard deviations. The results are 2.2 standard deviations lower than the expectation of the BE32 model which was tuned to DELPHI Z data and verified on semi-leptonic WW events. The spatial scale of the correlations is larger but consistent with BE32. The results from the unlike-sign pairs are inconclusive, and their interpretation is model dependent.
The prediction of the LUBOEI model is disfavoured not only by the behaviour of the WW data but also through the investigations of the background. It is clear that developments in the theoretical side of fragmentation models are needed before the BEC results presented in this paper can be fully understood.
These final results of the DELPHI experiment have a limited statistical accuracy. The precision would be significantly increased by a combination with the results of the LEP experiments which can be found in [20].
Acknowledgements
We are greatly indebted to our technical
collaborators, to the members of the CERN-SL Division for the excellent
performance of the LEP collider, and to the funding agencies for their
support in building and operating the DELPHI detector.
We acknowledge in particular the support of
Austrian Federal Ministry of Education, Science and Culture,
GZ 616.364/2-III/2a/98,
FNRS–FWO, Flanders Institute to encourage scientific and technological
research in the industry (IWT), Belgium,
FINEP, CNPq, CAPES, FUJB and FAPERJ, Brazil,
Czech Ministry of Industry and Trade, GA CR 202/99/1362,
Commission of the European Communities (DG XII),
Direction des Sciences de la Matire, CEA, France,
Bundesministerium fr Bildung, Wissenschaft, Forschung
und Technologie, Germany,
General Secretariat for Research and Technology, Greece,
National Science Foundation (NWO) and Foundation for Research on Matter (FOM),
The Netherlands,
Norwegian Research Council,
State Committee for Scientific Research, Poland, SPUB-M/CERN/PO3/DZ296/2000,
SPUB-M/CERN/PO3/DZ297/2000, 2P03B 104 19 and 2P03B 69 23(2002-2004)
FCT - Fundação para a Ciência e Tecnologia, Portugal,
Vedecka grantova agentura MS SR, Slovakia, Nr. 95/5195/134,
Ministry of Science and Technology of the Republic of Slovenia,
CICYT, Spain, AEN99-0950 and AEN99-0761,
The Swedish Research Council,
Particle Physics and Astronomy Research Council, UK,
Department of Energy, USA, DE-FG02-01ER41155.
EEC RTN contract HPRN-CT-00292-2002.
References
-
[1]
G. Goldhaber et al., Phys. Rev. Lett. 3 (1959) 181
G. Goldhaber et al., Phys. Rev. 120 (1960) 300. -
[2]
B. Lorstad, Int. J. Mod. Phys. A4 (1989) 2861
D. H. Boal, C. K. Gelbke and B. K. Jennings, Rev. Mod. Phys. 62 (1990) 553
G. Baym, Acta Phys. Polon. B29 (1998) 1839
G. Alexander, Rept. Prog. Phys. 66 (2003) 481. -
[3]
P. Abreu et al. (DELPHI Collaboration), Phys. Lett. B286 (1992) 201
P. Abreu et al. (DELPHI Collaboration), Z. Phys. C63 (1994) 17
P. Abreu et al. (DELPHI Collaboration), Phys. Lett. B355 (1995) 415
P. Abreu et al. (DELPHI Collaboration), Phys. Lett. B471 (2000) 460
P. Achard et al. (L3 Collaboration), Phys. Lett. B524 (2002) 55
P. Achard et al. (L3 Collaboration), Phys. Lett. B540 (2002) 185
P. Acton et al. (OPAL Collaboration), Phys. Lett. B267 (1991) 143
P. Acton et al. (OPAL Collaboration), Phys. Lett. B287 (1992) 401
P. Acton et al. (OPAL Collaboration), Phys. Lett. B298 (1993) 456
R. Akers et al. (OPAL Collaboration), Z. Phys. C67 (1995) 389
G. Alexander et al. (OPAL Collaboration), Z. Phys. C72 (1996) 389
K. Ackerstaff et al. (OPAL Collaboration), Eur. Phys. J. C5 (1998) 239
G. Abbiendi et al. (OPAL Collaboration), Eur. Phys. J. C11 (1999) 239
G. Abbiendi et al. (OPAL Collaboration), Eur. Phys. J. C16 (2000) 423
G. Abbiendi et al. (OPAL Collaboration), Eur. Phys. J. C21 (2001) 23
G. Abbiendi et al. (OPAL Collaboration), Phys. Lett. B523 (2001) 35
G. Abbiendi et al. (OPAL Collaboration), Phys. Lett. B559 (2003) 131
D. Decamp et al. (ALEPH Collaboration), Z. Phys. C54 (1992) 75
A. Heister et al. (ALEPH Collaboration), Eur. Phys. J. C36 (2004) 147
S. Schael et al. (ALEPH Collaboration), Two-Particle Correlations in pp, and pairs from Hadronic Z decays , CERN-PH-EP-2004-033,
submitted to Phys. Lett. B. - [4] R. Hanbury Brown and R.Q. Twiss, Nature 178 (1956) 1046.
- [5] T. Sjöstrand and V. A. Khoze, Z. Phys. C62 (1994) 281.
- [6] L. Lönnblad, Z. Phys. C70 (1996) 107.
- [7] L. Lönnblad and T. Sjöstrand, Phys. Lett. B351 (1995) 293.
- [8] S. Jadach and K. Zalewski, Acta Phys. Polon. B28 (1997) 1363.
- [9] The LEP collaborations, The LEP Electroweak Working Group, and the SLD Heavy Flavour Group, A Combination of Preliminary Electroweak Measurements and Constraints on the Standard Model, CERN-PH-EP/2004-069, hep-ex/0412015.
- [10] S.V. Chekanov, E.A. De Wolf and W. Kittel, Eur. Phys. J. C6 (1999) 403.
- [11] E.A. De Wolf, Correlations in hadronic decays, hep-ph/0101243.
- [12] P. Aarnio et al. (DELPHI Collaboration), Nucl. Instrum. Methods A303 (1991) 233.
- [13] P. Abreu et al. (DELPHI Collaboration), Nucl. Instrum. Methods A378 (1996) 57.
- [14] J. Abdallah et al. (DELPHI Collaboration), Eur. Phys. J. C34 (2004) 127.
- [15] J. Abdallah et al. (DELPHI Collaboration), Eur. Phys. J. C34 (2004) 399.
- [16] A. Ballestrero et al., Comp. Phys. Comm. 152 (2003) 175.
- [17] T. Sjöstrand et al., Comp. Phys. Comm. 135 (2001) 238.
- [18] S. Jadach, B. F. L. Ward and Z. Was, Comp. Phys. Comm. 130 (2000) 260.
- [19] L. Lönnblad and T. Sjöstrand, Eur. Phys. J. C2 (1998) 165.
-
[20]
P. Abreu et al. (DELPHI Collaboration), Phys. Lett. B401 (1997) 181
M. Acciarri et al. (L3 Collaboration), Phys. Lett. B493 (2000) 233
P. Achard et al. (L3 Collaboration), Phys. Lett. B547 (2002) 139
G. Abbiendi et al. (OPAL Collaboration), Eur. Phys. J. C8 (1999) 559
G. Abbiendi et al. (OPAL Collaboration), Eur. Phys. J. C36 (2004) 297
R. Barate et al. (ALEPH Collaboration), Phys. Lett. B478 (2000) 50
S. Schael et al. (ALEPH Collaboration), Phys. Lett. B606 (2005) 265. - [21] A. De Angelis and L. Vitale, Nucl. Instrum. Methods A423 (1999) 446.
- [22] G. Corcella et al., HERWIG 6.5, JHEP 0101 (2001) 010, hep-ph/0210213.
- [23] L. Lönnblad, Comp. Phys. Comm. 71 (1992) 15.
- [24] G. Altarelli,T. Sjöstrand and F. Zwirner, Physics at LEP2 CERN yellow report, CERN 96-01, Vol 1. p191.