![[Uncaptioned image]](/html/hep-ex/0507053/assets/x1.png)
SCIPP 05/05
July 2005
SELECTRON MASS RECONSTRUCTION AND THE RESOLUTION OF THE
LINEAR COLLIDER DETECTOR
SHARON GERBODE, HEATH HOLGUIN, TROY LAU, PAUL MOOSER, ADAM PEARLSTEIN, JOE ROSE, BRUCE SCHUMM
Santa Cruz Institute for Particle Physics
University of California, Santa Cruz
We have used ISAJET and the JAS LCD fast simulation to explore the precision of Snowmass Point SPS1a selectron mass reconstruction for the Silicon Detector concept. Simulating collisions at TeV, we have found that most of the information constraining the selectron mass is carried in the forward () region. We have also found that, for a beam energy spread of 1% (conventional RF design), detector resolution limitations compromise the selectron mass reconstruction only in the forward region. However, for a beam energy spread of less than 0.2% (superconducting RF design), the detector resolution compromises the selectron mass reconstruction over the full angular region.
Talk presented at the 2005 International Linear Collider Workshop, Stanford University, Stanford, California, March 18-22, 2005
2005 International Linear Collider Workshop –
Stanford, U.S.A.
Selectron Mass Reconstruction and the Resolution of the
Linear Collider Detector
Abstract
We have used ISAJET and the JAS LCD fast simulation to explore the precision of Snowmass Point SPS1a selectron mass reconstruction for the Silicon Detector concept. Simulating collisions at TeV, we have found that most of the information constraining the selectron mass is carried in the forward () region. We have also found that, for a beam energy spread of 1% (conventional RF design), detector resolution limitations compromise the selectron mass reconstruction only in the forward region. However, for a beam energy spread of less than 0.2% (superconducting RF design), the detector resolution compromises the selectron mass reconstruction over the full angular region.
I INTRODUCTION
For some time, the Santa Cruz Linear Collider R&D group has been interested in exploring the requirements that measuring forward selectron production places on the Linear Collider Detector. With right-handed selectron and lightest neutralino masses of 143 and 95 GeV, respectively, Snowmass Point SPS1a produces a substantial forward () population of electrons from selectron decay. Over the past two years, the Santa Cruz group has developed techniques to isolate the forward selectron-decay signal from Standard-Model backgrounds, as well as techniques to extract the selectron mass from the observed selectron-decay electron spectrum. This paper reports on the results of those studies.
II SIGNAL SELECTION
Backgrounds to the selectron-decay electron signal come from two primary sources: four-electron production for which two of the final-state fermions are close in angle to the beam trajectory, and thus escape detection, and the -boson fusion process . During the course of searches for supersymmetry at LEP, several cuts were developed to isolate potential SUSY signals from Standard Model backgrounds.
-
•
Fiducial Region Cut: Exactly one final-state positron and one final-state electron pair must be detected in the fiducial region. For this study, the fiducial region lies above 5 GeV in momentum, and within for central-region studies, or within for studies including the forward region.
-
•
Tagging Cut: No observable electron or positron in the low-angle ‘tagging calorimetry’ (with assumed coverage of 20mrad 110mrad).
-
•
Transverse Momentum Cut: Cuts events for which the vector sum of the observed pair transverse momenta is less than 500 Gev (20 mrad).
For a signal region of , these cuts completely eliminate the four-electron background up to diagrams with additional radiation, and sufficiently select against the process. However, as one attempts to reconstruct the selectron decay signal beyond , both the radiative four-electron background and the backgrounds approach poles in their respective production cross sections, and begin to dominate the selectron signal. To suppress these backgrounds to a degree appropriate for use of the forward selectron decay signal, two additional cuts were applied.
-
•
Photon Cut: Remove event if there is an observed photon of 20 GeV or greater in either the fiducial or tagging region.
-
•
High-Momentum Cut: Remove even if the vector sum of the pair momenta has a magnitude of greater than 225 GeV.
With the application of these cuts to events produced at TeV with 80% right-handed-polarized electron beam and unpolarized positrons, it was found that Standard Model processes provided a negligible background to the right-handed selectron signal. In addition, the application of these selection criteria did not significantly alter the shape of the selectron-decay electron spectrum in either the central or forward region. Nevertheless, in the analysis that follows all of the selection cuts will be applied to the selectron signal; however, Standard Model backgrounds will be ignored from this point on. Finally, running with an 80% right-polarized electron beam, electrons from the decay of the more massive left-handed selectron provide a diffuse background to the right-handed selectron decay electron spectrum. This contribution was also ignored in the right-handed selectron analysis.
III SIMULATION OF THE SELECTRON SIGNAL
The selectron signal was generated at TeV using the Snowmass point SPS1a sps parameters GeV, GeV, , , and sgn() = . The SPS1a specifications were implemented within the ISAJET isajet package, and included the effects of initial state radiation, beamstrahlung (), and three different values of the fractional beam energy spread (assuming a gaussian distribution): 1.0%, 0.16%, and 0.0%.
For this point in SUSY parameter space, the endpoint of the selectron-decay electron energy distribution lies above 270 GeV, making the precise measurement of the endpoint energy by the tracking system somewhat challenging. Nonetheless, the projected resolution of the tracking system at this energy is somewhat better than that expected for the electromagnetic calorimetry.
The distribution of final-state electrons and positrons from the decay of right-handed selectrons is peaked towards , due to the sizeable t-channel contribution admitted by the relatively light selectron and neutralino. Approximately half of the signal lies in the forward region, beyond .
IV DETERMINATION OF THE RIGHT-HANDED SELECTRON MASS
To focus on the accuracy of the selectron mass reconstruction, it was assumed for now that the lightest neutralino mass was known precisely from other measurements. The Santa Cruz group plans to relax this assumption in further studies.
The selectron mass was determined by finding the best fit of the selectron energy spectrum to that of a series of ‘template’ distributions generated with slightly varying right-handed selectron masses, but with all other aspects of the signal generation, including beam energy spread and detector smearing effects, the same as for the data simulation. Templates were produced for 15 right-handed selectron masses in a range of approximately GeV about the nominal SPS1a mass of 143.11 GeV.
A total of 120 independent data sets, each corresponding to an integrated luminosity of 115 fb-1, were generated at the nominal SPS1a mass. For each of these data sets, a was formed against each of the templates points, according to
| (1) |
where the sum is over energy bins in the selectron-decay electron spectrum, and are the data and template bin contents, respectively, and
| (2) |
is the relative sample-size weighting factor. To minimize the statistical contributions of the template files, they were generated with an integrated luminosity of approximately 1000 fb-1 each.
For each data set, the contour was fit with a quartic polynomial, which was then minimized to find the best-fit selectron mass. This procedure was repeated for the 120 data sets, and the mean and root-mean-square deviation was calculated from the distribution of best-fit right-handed selectron masses.
In forming the for each of the 120 independent data sets, it was found that the inclusion of energy-spectrum bins not sufficiently close to the upper and lower endpoints to provide useful information on the endpoint location introduced unacceptable scatter in the contour. Thus, for each scenario that was studied (beam energy spread, detector model, polar angle reach), only bins near the upper and lower endpoint were used in forming the . The exact energy ranges used in the calculation depended on the scenario under study, and was determined in a data-driven manner by examining the spectrum in the region of the endpoints in the generated data samples. Table I shows the regions used in the forming the for the different scenarios.
IV.1 Scenarios Explored
To explore the effects of detector resolution, data sets and mass templates were generated assuming perfect detector resolution as well as that of the SDMAR01 detector. Detector resolution effects were incorporated via gaussian smearing based on error matrices from Billior-based tracking error calculations provided by the LCDTRK program lcdtrk . Two different ranges in were explored: between 0.0 and 0.8 and between 0.0 and 0.994. Finally, three different values of the beam energy spread were explored: (to allow benchmark comparisons to previous studies uriel ; yang ), (approximately that expected for the superconducting RF design), and, for comparison, 0.0%.
| Scenario(s) | Lower Endpoint Range | Upper Endpoint Range |
|---|---|---|
| Perfect detector resolution and/or no energy spread | 5.2–6.4 GeV | 269.2–273.2 GeV |
| realistic resolution; 0.16% energy spread | 5.2–6.4 GeV | 267.8–274.6 GeV |
| realistic resolution; 1.0% energy spread | 5.2–6.4 GeV | 267.2–275.2 GeV |
V RESULTS
Figure 1 shows the root-mean-square deviation observed for the 120 independent data sets for the different scenarios that were explored in the study (in all cases, the mean value of the fit mass was reasonably consistent with the input vale of the right-handed selectron mass of 143.1 GeV).
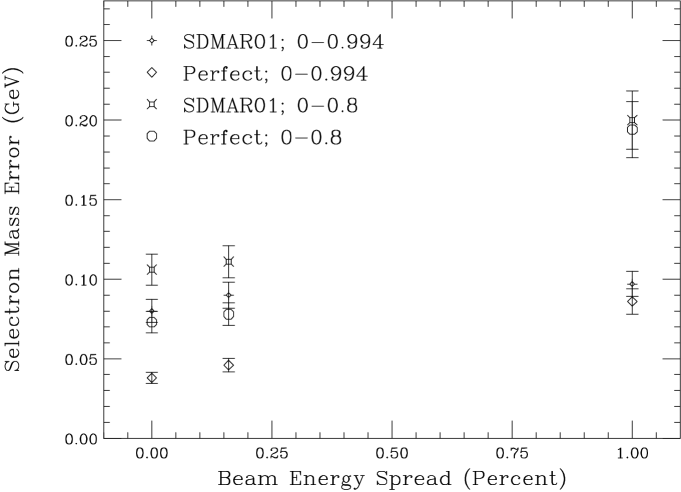
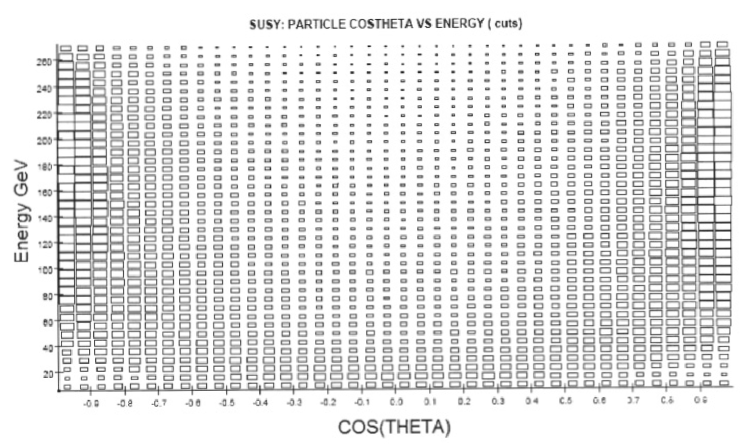
For a perfect detector (no measurement uncertainty), the inclusion of the forward region provides substantial improvement in the selectron mass measurement, independent of beam energy spread. In fact, the improvement is better than one would expect from the factor-of-two increase in the number of signal electrons that is associated with the inclusion of the forward region. A study of the two-dimensional frequency distribution of signal electrons as a function of energy and the cosine of the polar angle (Figure 2) reveals that the spectrum has a greater contribution at higher energy, where the sensitivity to the selectron mass is greatest, at high values of . Thus, in this case, most of the information on the selectron mass (and on slepton masses in general) is in the forward region.
For large beam energy spread, it is seen that the sensitivity to the selectron mass has little dependence on the detector resolution. For this case, the SiD design seems to be adequate to take advantage of the physics capabilities of the accelerator. However, for smaller beam energy spread, this is not the case. For the energy spread anticipated for the selected machine design, substantial improvement in the selectron mass determination can be achieved by improving the detector resolution, particularly in the forward region.
VI CONCLUSIONS
To examine the issue of measuring selectron masses in the forward region of the Linear Collider Detector, we have simulated SPS1a selectron production at TeV. By developing two new selection criteria, we have demonstrated that the selectron signal can be separated from Standard Model backgrounds through the entire forward tracking region .
Due to the stiffening of the selectron-decay electron spectrum at higher values of , for a light selectron most of the information on selectron mass (and slepton mass in general) comes from the forward region. For large beam energy spread (), we find that the SiD detector design is adequate to exploit the potential of the Linear Collider; however, for the expected beam energy spread of the chosen cold RF technology, gains in sensitivity to the selectron mass can be made by further improvements in momentum resolution, in both the central and forward regions.
Acknowledgements.
Although they appear as authors on this paper, one of us (Schumm) would like to acknowledge the dedication and creativity of the other authors, who performed these studies as undergraduate physics majors at the University of California at Santa Cruz.References
- (1) N. Ghodbane and H. Martyn, ‘Compilation of SUSY particle spectra from Snowmass 2001 benchmark models’, hep-ph/0201233, January, 2002.
- (2) F. Paige, S. Protopopescu, H. Baer, X. Tata, ‘ISAJET 7.69 A Monte Carlo Event Generator for , , and Reactions’, hep-ph/0312045, December, 2003.
- (3) B. Schumm, http://www.slac.stanford.edu/schumm/lcdtrk20011204.tar.gz
- (4) M Dima et al., Phys. Rev. D65:071701,2002.
- (5) K. Riles and H. Yang, physics/0506198, June, 2005.