M. Ablikim1, J. Z. Bai1, Y. Ban11,
J. G. Bian1, X. Cai1,
H. F. Chen16,
H. S. Chen1, H. X. Chen1,
J. C. Chen1,
Jin Chen1, Y. B. Chen1, S. P. Chi2,
Y. P. Chu1, X. Z. Cui1,
Y. S. Dai18,
Z. Y. Deng1, L. Y. Dong1a,
Q. F. Dong14,
S. X. Du1, Z. Z. Du1, J. Fang1,
S. S. Fang2, C. D. Fu1, C. S. Gao1,
Y. N. Gao14, S. D. Gu1, Y. T. Gu4,
Y. N. Guo1, Y. Q. Guo1,
Z. J. Guo15,
F. A. Harris15, K. L. He1, M. He12,
Y. K. Heng1, H. M. Hu1, T. Hu1,
G. S. Huang1b, X. P. Huang1,
X. T. Huang12,
X. B. Ji1, X. S. Jiang1,
J. B. Jiao12,
D. P. Jin1, S. Jin1, Yi Jin1,
Y. F. Lai1, G. Li2, H. B. Li1,
H. H. Li1, J. Li1, R. Y. Li1,
S. M. Li1, W. D. Li1, W. G. Li1,
X. L. Li8, X. Q. Li10, Y. L. Li4,
Y. F. Liang13, H. B. Liao6, C. X. Liu1,
F. Liu6, Fang Liu16, H. H. Liu1,
H. M. Liu1, J. Liu11, J. B. Liu1,
J. P. Liu17, R. G. Liu1, Z. A. Liu1,
F. Lu1, G. R. Lu5, H. J. Lu16,
H. M. Liu1, J. Liu11, J. B. Liu1,
J. P. Liu17, R. G. Liu1, Z. A. Liu1,
F. Lu1, G. R. Lu5, H. J. Lu16,
J. G. Lu1, C. L. Luo9, F. C. Ma8,
H. L. Ma1, L. L. Ma1, Q. M. Ma1,
X. B. Ma5, Z. P. Mao1, X. H. Mo1,
J. Nie1, S. L. Olsen15,
H. P. Peng16,
N. D. Qi1, H. Qin9, J. F. Qiu1,
Z. Y. Ren1, G. Rong1,
L. Y. Shan1,
L. Shang1, D. L. Shen1,
X. Y. Shen1,
H. Y. Sheng1, F. Shi1,
X. Shi11c,
H. S. Sun1, J. F. Sun1, S. S. Sun1,
Y. Z. Sun1, Z. J. Sun1, Z. Q. Tan4,
X. Tang1, Y. R. Tian14,
G. L. Tong1,
G. S. Varner15, D. Y. Wang1, L. Wang1,
L. S. Wang1, M. Wang1, P. Wang1,
P. L. Wang1, W. F. Wang1d,
Y. F. Wang1,
Z. Wang1, Z. Y. Wang1, Zhe Wang1,
Zheng Wang2, C. L. Wei1, D. H. Wei1,
N. Wu1, X. M. Xia1, X. X. Xie1,
B. Xin8b, G. F. Xu1, Y. Xu10,
M. L. Yan16, F. Yang10,
H. X. Yang1,
J. Yang16, Y. X. Yang3, M. H. Ye2,
Y. X. Ye16, Z. Y. Yi1, G. W. Yu1,
C. Z. Yuan1, J. M. Yuan1, Y. Yuan1,
S. L. Zang1, Y. Zeng7, Yu Zeng1,
B. X. Zhang1, B. Y. Zhang1,
C. C. Zhang1,
D. H. Zhang1, H. Y. Zhang1,
J. W. Zhang1,
J. Y. Zhang1, Q. J. Zhang1,
X. M. Zhang1,
X. Y. Zhang12, Yiyun Zhang13,
Z. P. Zhang16,
Z. Q. Zhang5, D. X. Zhao1,
J. W. Zhao1,
M. G. Zhao10, P. P. Zhao1,
W. R. Zhao1,
Z. G. Zhao1e, H. Q. Zheng11,
J. P. Zheng1,
Z. P. Zheng1, L. Zhou1,
N. F. Zhou1,
K. J. Zhu1, Q. M. Zhu1, Y. C. Zhu1,
Y. S. Zhu1, Yingchun Zhu1f, Z. A. Zhu1,
B. A. Zhuang1, X. A. Zhuang1, B. S. Zou1 (BES Collaboration)
1 Institute of High Energy Physics, Beijing 100049, People’s
Republic of China
2 China Center for Advanced Science and Technology (CCAST),
Beijing 100080, People’s Republic
of China
3 Guangxi Normal University, Guilin 541004, People’s Republic of
China
4 Guangxi University, Nanning 530004, People’s Republic of China
5 Henan Normal University, Xinxiang 453002, People’s Republic of
China
6 Huazhong Normal University, Wuhan 430079, People’s Republic of
China
7 Hunan University, Changsha 410082, People’s Republic of China
8 Liaoning University, Shenyang 110036, People’s Republic of
China
9 Nanjing Normal University, Nanjing 210097, People’s Republic of
China
10 Nankai University, Tianjin 300071, People’s Republic of China
11 Peking University, Beijing 100871, People’s Republic of China
12 Shandong University, Jinan 250100, People’s Republic of China
13 Sichuan University, Chengdu 610064, People’s Republic of China
14 Tsinghua University, Beijing 100084, People’s Republic of
China
15 University of Hawaii, Honolulu, HI 96822, USA
16 University of Science and Technology of China, Hefei 230026,
People’s Republic of China
17 Wuhan University, Wuhan 430072, People’s Republic of China
18 Zhejiang University, Hangzhou 310028, People’s Republic of
China
a Current address: Iowa State University, Ames, IA 50011-3160,
USA
b Current address: Purdue University, West Lafayette, IN 47907,
USA
c Current address: Cornell University, Ithaca, NY 14853, USA
d Current address: Laboratoire de l’Accélératear
Linéaire, Orsay,
F-91898, France
e Current address: University of Michigan, Ann Arbor, MI 48109,
USA
f Current address: DESY, D-22607, Hamburg, Germany
Abstract
Decays of are observed for the first time using a
sample of events collected with the BESII
detector. The branching ratios are determined to be and , where the
first errors are statistical and the second systematic. The
significances of the two signals are and ,
respectively.
1 Introduction
Exclusive quarkoninum decays provide an important laboratory for
investigating perturbative quantum chromodynamics. Compared with
and decays, one has much less knowledge on
decays. While a few exclusive decays of have
been measured, many decay modes remain unknown. Current theoretical
analyses of decays provide only a rough treatment of the
color-octet wave function. For mode, so far
only measurements of [1] and
[2] are available
with low statistics. Precise measurements for more channels
will help in better understanding the various mechanism [3, 4]
of decays and the nature of bound states.
Further, the decays of , especially and
, provide a direct window on glueball dynamics in the
and channels since the hadronic decays may proceed
via .
Recently, the branching ratio for [5] has been measured by the BES
collaboration. In the present analysis, a search for
decaying into final states is carried out using 14 million
events [6] accumulated at the upgraded BES detector
(BESII). Signals of and decaying to
pairs in radiative decays are observed for the first time.
2 The BES detector
The Beijing Spectrometer (BES) is a conventional solenoidal magnet
detector that is described in detail in Ref. [7]; BESII is the
upgraded version of the BES detector [8]. A 12-layer vertex
chamber (VC) surrounding the beam pipe provides trigger
and position information. A forty-layer main drift chamber (MDC),
located radially outside the VC, provides trajectory and energy loss
() information for charged tracks over of the total
solid angle. The momentum resolution is ( in GeV/c), and the resolution
for hadron tracks is . An array of 48 scintillation
counters surrounding the MDC measures the time-of-flight (TOF) of
charged tracks with a resolution of ps for hadrons.
Outside of the TOF counters is a 12-radiation-length barrel shower
counter (BSC) comprised of gas proportional tubes interleaved with
lead sheets. This measures the energies of electrons and photons over
of the total solid angle with an energy resolution of
( in GeV). Outside of the solenoidal
coil, which provides a 0.4 Tesla magnetic field over the tracking
volume, is an iron flux return that is instrumented with three double
layers of counters that identify muons of momentum greater than 0.5
GeV/c.
A GEANT3 based Monte Carlo (MC) program with
detailed consideration of the detector performance (such as dead
electronic channels) is used to simulate the BESII detector. The
consistency between data and Monte Carlo has been carefully checked in
many high purity physics channels, and the agreement is quite
reasonable [9].
3 Event selection
3.1 signal
In this analysis, channels are
investigated using radiative decays to .
Events with four charged tracks
and five or six photons are selected.
Each charged track is required to be well fit by a three-dimensional
helix and to have a polar angle, , within the fiducial region
. To ensure tracks originate from the interaction
region, we require cm and cm,
where , , and are the and coordinates of the
point of closest approach of each track to the beam axis.
A neutral cluster is considered to be a photon candidate if it is
located within the BSC fiducial region (), the
energy deposited in the BSC is greater than 40 MeV, the first hit
appears in the first 10 radiation lengths, and the angle between the
cluster and the nearest charged track is greater than .
A six constraint (6-C) kinematic fit to the hypothesis
with the invariant mass of the two photon pairs
constrained to the mass is performed, and the
of the 6-C fit is required to be less than 15. For events with six
photons candidates, the combination having the minimum is
chosen, and the probability of the 6-C fit is required to be larger than
that of the 7-C fit to the hypothesis to suppress potential background from
.
Since there are four pair combinations from ,
the pair with the minimum , which is defined as
is chosen for further analysis. Here, is the invariant mass
of three pions and superscript 1, 2 denote different pion
combinations. Therefore, there is only one entry for each
event.
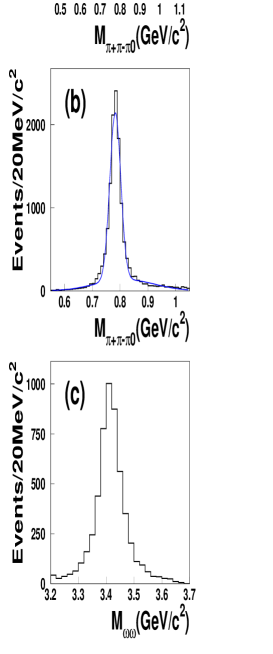
Figures 1 and 2 show mass distributions for
candidate events in the high mass
( GeV/) and low mass regions ( GeV/),
respectively.
Here (a) is the scatter plot of versus , (b)
is the
distribution recoiling against the opposite ,
selected by requiring
MeV/, and (c) is the invariant
mass distribution for events in the pair signal region,
defined by MeV/.
In Fig. 1, clear
signal can be seen in (b), and clear and
signals in (c),
indicating the existence of decays. By contrast,
in the low mass
region, shown in Fig. 2, the pair signal
is less significant than in the high mass region. Here, only
pair events in high mass region are studied.
Figure 1: Distributions of events surviving the selection criteria
described in the text with GeV. (a)
versus , (b) recoiling against the opposite
, selected by requiring MeV/, and (c)
invariant mass distribution for events where the
pair satisfies MeV/.
Figure 2: Distributions defined as in Fig. 1 but with GeV/.
In order to test if the selection criteria in this analysis will give
‘fake’ pair events from non- pair events, 300000 MC
simulated events are generated
in which decays according to the phase space.
Fig. 3 shows the distributions of the surviving MC
phase space events after requiring the same selection criteria as for the
real data. No peak around the mass is seen, which shows that the
pair selection
criteria in this analysis does not generate fake pair signals.
Figure 3: distributions from MC phase space simulated
.
The annular region around the pair signal circle, shown in
Fig 1(a), is taken as the sideband region. Fig. 4 shows
the sideband distributions defined using the radius R to be (a)
MeV and (b) MeV/. No obvious
signals seen in these sideband distributions.
Figure 4: distribution of events in sideband regions
(a) MeV and (b) MeV.
3.2 MC simulation
A MC simulation of
is used to determine the detection efficiency. The proper angular
distributions of the photon emitted in are
used [10].
Fig. 5 shows the distributions, identical to those in Fig. 1
for MC simulated events
passing the same selection criteria as for the real data. MC simulated
events
have similar distributions.
Figure 5: Distributions defined as in Fig. 1 from
MC simulated
events.
3.3 Mass spectrum fit
The Maximum Likelihood (ML) method is used to fit the mass
spectrum of events in the
pair
signal region (Fig. 1(c)). The signal functions are
determined from MC simulation, as shown in Fig. 5(c) for ,
while the background function is taken from the sideband distribution,
shown in Fig 4(a). The fit result is represented by the solid curve in
Fig. 6, and the fit yields
Figure 6: Fit of the distribution. Dots with error bars are
data, the solid histogram represents the maximum likelihood fit result,
and the dashed histogram is the sideband background.
The statistical significances of and are
and , respectively, which are estimated from
, where is the difference
between the logarithmic ML values of the fit with and without the
corresponding signal function.
4 Systematic error
The systematic error in this branching ratio measurement includes the
uncertainties in the MDC tracking efficiency, photon efficiency,
kinematic fit, background shape, number of events, etc.
4.1 MDC tracking efficiency and photon efficiency
For charged tracks, the uncertainty of the tracking efficiency is
determined by comparing data and MC for some very clean decay
channels [9], and an error of 2% is found for
each track. A similar comparison has also been performed for
photons [12], and the difference is also about 2% for a single
photon.
4.2 Kinematic fit
The systematic error associated with the kinematic fit is due to
differences between data and MC simulation in the
determination of the track momentum, the track fitting error matrix, and the
photon energy and direction. The effect is studied for charged tracks
and neutral tracks separately. By comparing the number of events before
and after the kinematic fit for very clean event samples for data and
MC simulated data, the difference is determined to be 8.4%, which is
taken as the systematic error.
4.3 Background shape
Two different sideband spectrum shapes, shown in Fig. 4, are
used as the background function. The difference in the number of events
obtained with the two different shapes is taken as a systematic error.
Table 1: Individual sources and total systematic error (%).
Source
track efficiency
8
8
photon efficiency
10
10
6-C fit
8.4
8.4
background shape
6.0
1.0
signal region
3.4
4.3
binning and fit range
1.4
3.2
angular distribution
–
9.4
No. of events
4
4
5.1
6.7
0.9
0.9
0.0
0.0
Total
18.1
20.4
4.4 Binning, fit range, and signal region
The differences caused by different binning and fit ranges in the mass
spectrum fit are 1.2% and 3.4% for and , respectively.
Different sized signal regions yield differences of 3.1% and 2.4% for
and , respectively, which are taken as a
systematic error.
4.5 Angular distribution of
In the estimation of the efficiency, a phase space generator
with only the angular distribution of the radiative photon
is considered. While this is correct for decays, it
may introduce bias for decays. The effect is estimated
by generating different angular distributions of the omega
in the rest frame. The efficiency difference between
these tests and the phase space generator is estimated to be
9.4%, which is put into the systematic error.
4.6 Branching ratios of intermediate states
The errors on intermediate state branching ratios are obtained from
the PDG [13] except for , where
recent CLEO results [14] are used.
Table 1 summarizes all contributions to the systematic errors,
and the total systematic error is determined by the quadratic sum of all
terms.
Table 2: Branching ratio results and relevant numbers.
Quantity
number of events
efficiency (%)
1.66
1.55
5 Results
The branching ratio of is determined from
where is the number of events selected,
the total number of events,
is the detection efficiency for the investigated channel, and
and are the branching ratios of
, and , respectively.
Table 2
lists the branching ratio results, together with
numbers used in the branching ratio calculation.
In summary, signals in the decay of are observed,
and their branching ratios measured for the first time.
and decays to have similar decay branching
ratios, which is different from other
decays .
This measurement, together with previous measurements of , will be helpful in understanding the nature of states.
6 Acknowlegements
The BES collaboration thanks the staff of BEPC for their hard
efforts. This work is supported in part by the National Natural
Science Foundation of China under contracts Nos. 10491300,
10225524, 10225525, 10425523, the Chinese Academy of Sciences under
contract No. KJ 95T-03, the 100 Talents Program of CAS under
Contract Nos. U-11, U-24, U-25, and the Knowledge Innovation
Project of CAS under Contract Nos. U-602, U-34 (IHEP), the
National Natural Science Foundation of China under Contract No.
10225522 (Tsinghua University), and the Department of Energy under
Contract No.DE-FG02-04ER41291 (U Hawaii).
References
[1]BES Collaboration, J. Z. Bai Phys. Rev.
D60, (1999) 072001.
[2]BES Collaboration, M. Ablikim Phys. Rev.
D70, (2004) 092003.
[3]C. Amsler and F. Close, Phys. Rev. D53 (1996) 295.
[4]H. Q. Zhou, R. G. Ping, B. S. Zou, Phys.Lett. B611 (2005) 123
[5]BES Collaboration, M. Ablikim Phys. Rev. D70
(2004) 092002.
[6]X. H. Mo HEP&NP, 28 (2004) 455 (in Chinese).
[7]J. Z. Bai BES Collab., Nucl. Instr. Meth. A344
(1994) 319.
[8]J. Z. Bai BES Collab., Nucl. Instr. Meth. A458
(2001) 427.
[9]BES Collaboration, M. Ablikim accepted by Nucl.
Instr. Meth. A.
[10]Mark-I Collaboration, W. Tanenbaum Phys. Rev.
D17 (1978) 1731; G. Karl, S. Meshkov, and J. L. Rosner, 13
(1976) 1203; Crystall Ball Collaboration,
M. Oreglia 25 (1982) 2259.
[11]BES Collaboration, J. Z. Bai, Phys. Rev. D70 (2004) 042005.
[12]S. M. Li, HEP&NP, 28 (8), (2004) 859 (in Chinese)
[13]Particle Physics Group, S. Eidelman Phys. lett.
B592 (2004) 814-835.
[14]CLEO Collaboration, S. B. Athar, Phys. Rev.
D70 (2004) 112002.